
EB Daily Market Report - Tuesday, July 21, 2026
Executive Summary
- Futures were higher overnight and our major indices gapped up at the open
- U.S. stocks have extended their gains, particularly aggressive areas
- Technology (XLK, +2.69%) is easily today's leading sector
- Electronic equipment ($DJUSAI, +5.45%) and semiconductors ($DJUSSC, +3.95%) pace the technology group
- Energy (XLE, +0.65%) is also performing well on the back of rising crude oil ($WTIC, +2.10%), now approaching key resistance at $85 per barrel
- Other commodities are mostly higher as well, as gold ($GOLD, +1.82%) and silver ($SILVER, +3.81%) both jump
- Meanwhile, the defensive consumer staples group (XLP, -0.87%) is the primary laggard on the session
- Danaher Corp (DHR, -11.28%) and MSCI, Inc. (MSCI, -10.25%) are the two worst-performing stocks in the S&P 500 after reporting quarterly results
- Alphabet, Inc. (GOOGL, -0.97%) and Tesla, Inc. (TSLA, +2.77%) will kick off earnings among Mag 7 stocks on Wednesday afternoon
Market Outlook
I know a lot of market pundits are still believing that we have an inflation problem. I'm most definitely NOT in that camp. In fact, I believe the exact opposite. I don't see an inflation problem at all. The Fed's dual mandate has been to stabilize prices and maximize employment. In regard to the former, the Fed has stated its goal of 2% inflation. Since inflation hit its peak at 6.70%, former Fed chief Jerome Powell constantly reiterated the Fed's goal of achieving its 2% target.
Here is where inflation currently stands and where it's come down from:
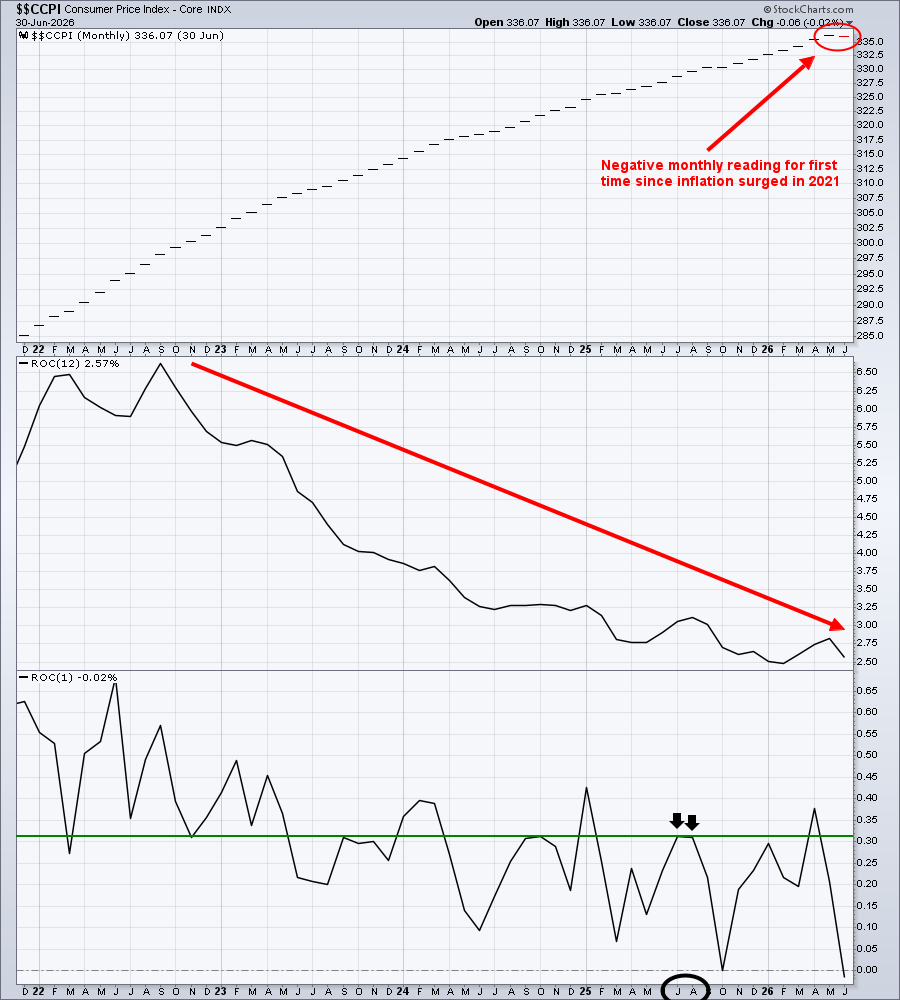
Would you say that inflation continues to move towards the Fed's 2% target or would you say that inflation is heating back up again and could become a problem? I know which one I say. Inflation IS NOT a problem. The talking heads have tried to convince everyone that higher inflation is just around the corner for the past few years. And just about every month, core inflation comes in below expectations and moves closer and closer to that 2% target.
If you look at those black arrows on the chart above, they highlight the Core CPI readings from July and August of 2025. Those two readings, which are both above +0.3%, will be replaced by lower numbers in July and August of 2026, in my opinion. That will move the annual Core CPI rate even closer to the 2% target.
Sectors/Industries
There are three asset classes/areas that I expect to rise when Wall Street sees or is expecting higher inflation. Gold ($GOLD). Real Estate (XLRE). 10-Year Treasury Yields ($TNX). Gold and inflation are known hedges against the effects of inflation. Treasuries are often sold when higher inflation is expected as bond traders demand a higher yield. The selling of treasuries always sends yields higher as there's a 100% inverse relationship between the two.
In the chart below, I've included $GOLD, XLRE, and $TNX, with the first two showing relative performance vs. the benchmark S&P 500. In an inflationary environment, or in an environment in which inflation is expected to surge, we should see $GOLD and XLRE outperforming the S&P 500. Check this out:
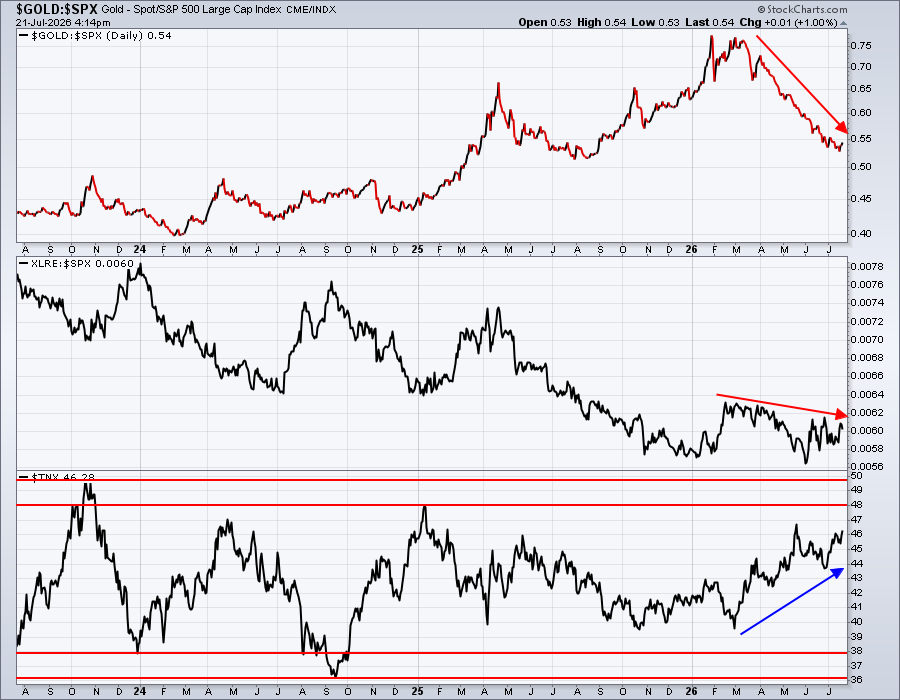
The 10-year treasury yield ($TNX) has been mostly trending higher in 2026, potentially supporting the inflationary thesis. However, if we look back over the past few years, the TNX remains in a sideways, rectangular type of pattern. Gold and real estate, on the other hand, have been significantly underperforming the S&P 500. So while the big Wall Street firms may be sending their analysts/influencers into the media, spreading the inflation hype, they are not backing it up with their money.
ChartLists and Trading Strategies
I've posted plenty of times about stocks that gap up strongly after reporting better-than-expected revenues and earnings. I also love to trade stocks that break out above key resistance, particularly if the stock has based for awhile. Here is a recent example:
GD:
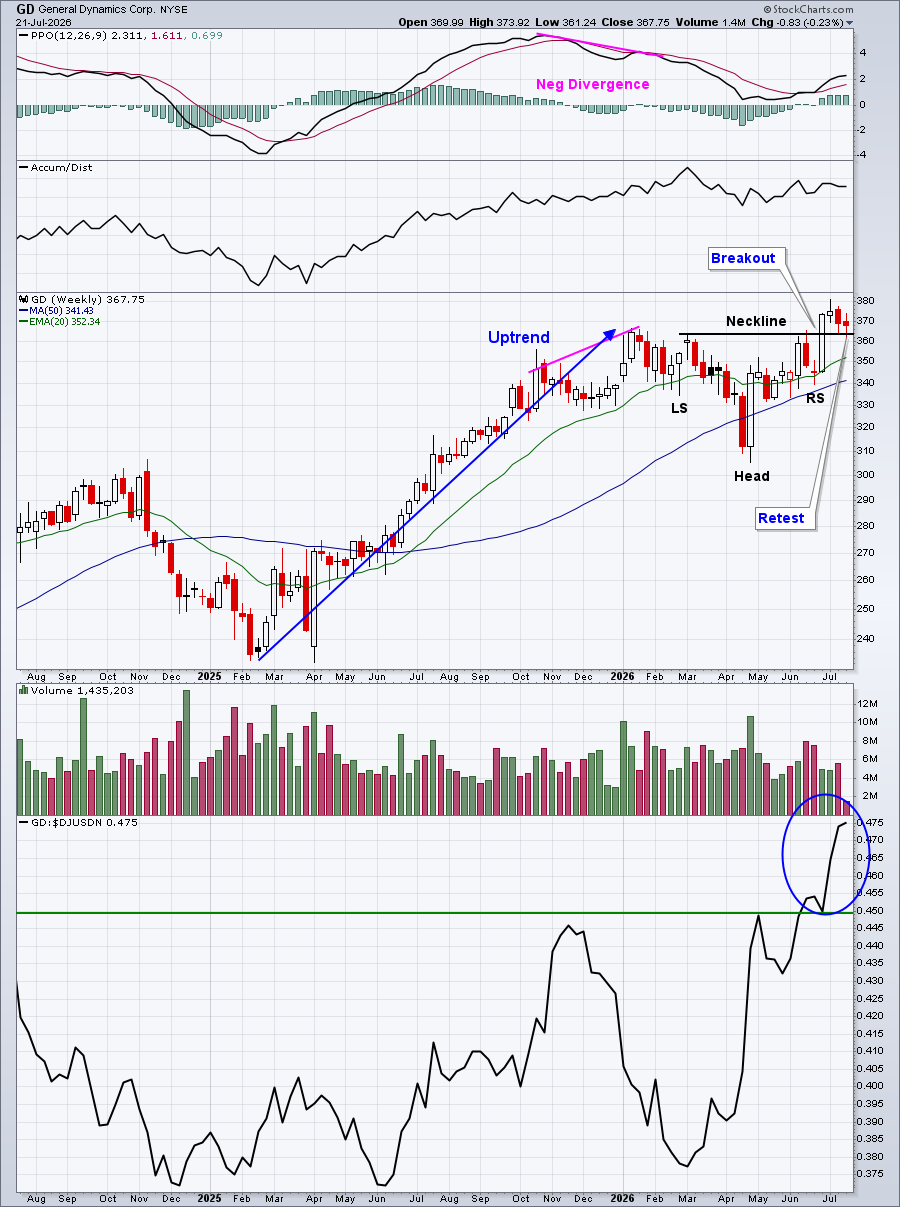
GD printed a negative divergence on its weekly chart back in early 2026, then proceeded to consolidate within a bullish inverse head & shoulders continuation pattern over the past 5 months. Then, in late June, GD finally broke out above neckline resistance in the 360-365 area. Given its inverse head of 306, there's a measurement of nearly 60 bucks that we can tack on the neckline. That suggests a potential target in the 420-425 zone.
Upcoming Earnings
Upcoming Earnings and Upcoming Earnings Relative Strength ChartLists are now available on our website and we'll continue to track upcoming earnings reports and provide them to you via ChartLists throughout Q2 earnings season.
Economic Reports
None
Happy trading!
Tom