
EB Daily Market Report - Thursday, July 23, 2026
Well, the first two Mag 7 quarterly earnings reports have come and gone and Wall Street is quite clear. They didn't like them.
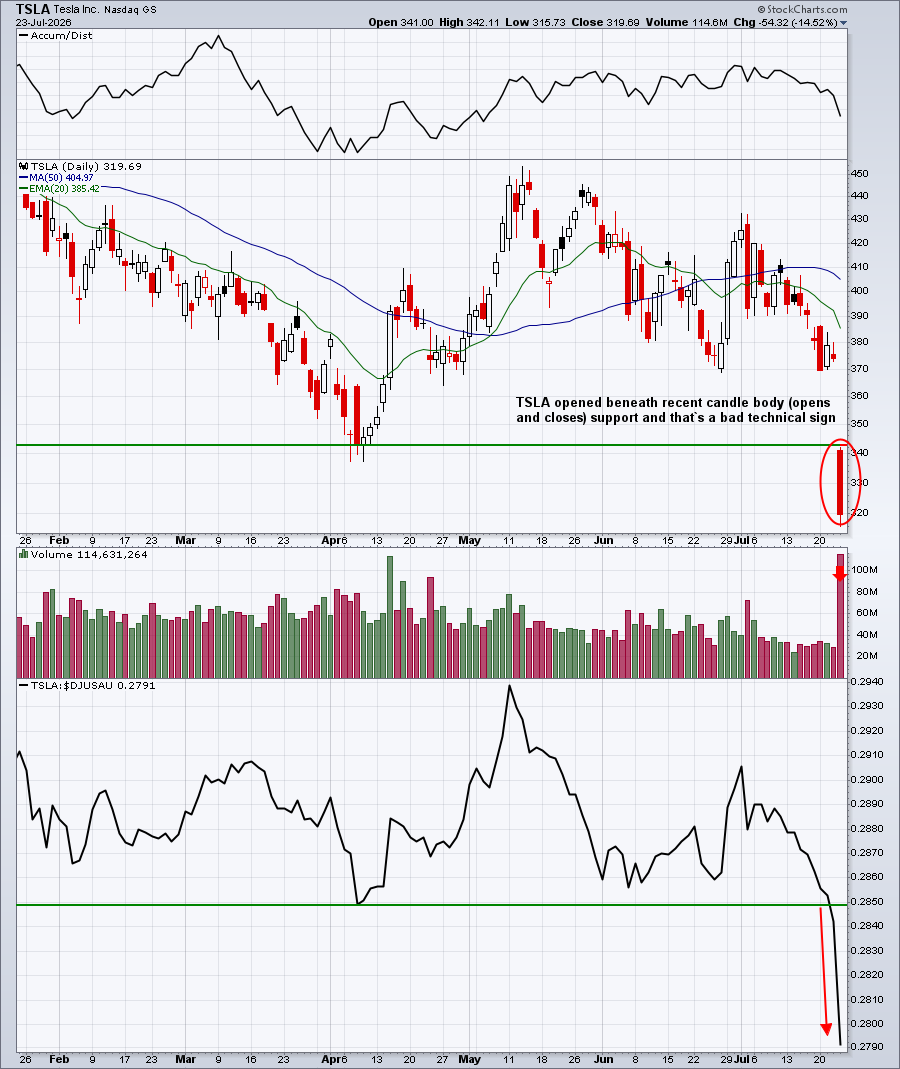
Tesla, Inc. (TSLA) had a significant miss on earnings, producing a 0.33 profit vs. the consensus estimate of 0.50. TSLA had been trending down relative to its auto peers ($DJUSAU) and was at a 52-week relative low when the company reported its results yesterday after the close. This type of poor relative performance, in my opinion, is a signal to steer clear of a stock as it could be setting up to deliver bad news. That's exactly what TSLA did and shareholders are paying the price today:
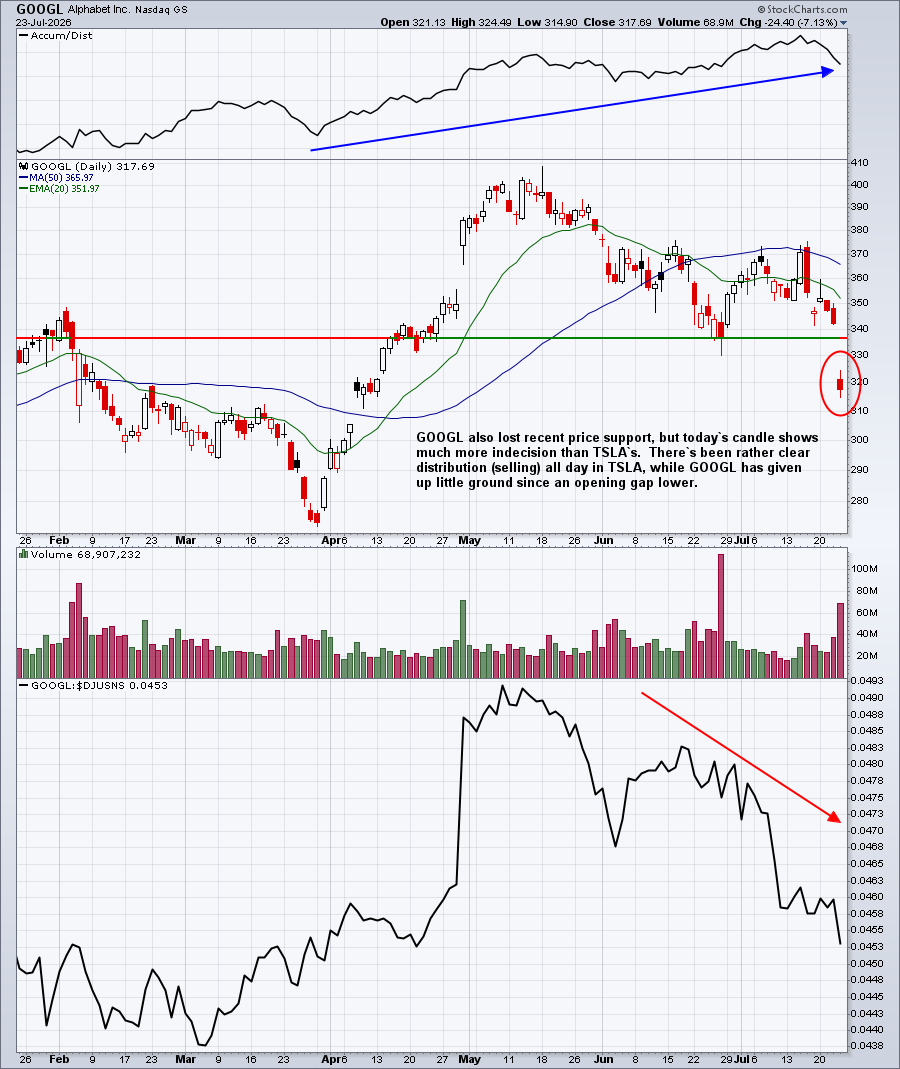
The other negative reaction came from Alphabet (GOOGL), although GOOGL did beat Wall Street consensus estimates as to both revenues and EPS. Nearly all of the selling was at the opening bell, which is much different than how TSLA has traded today. Nonetheless, down is down and GOOGL shareholders are suffering too:
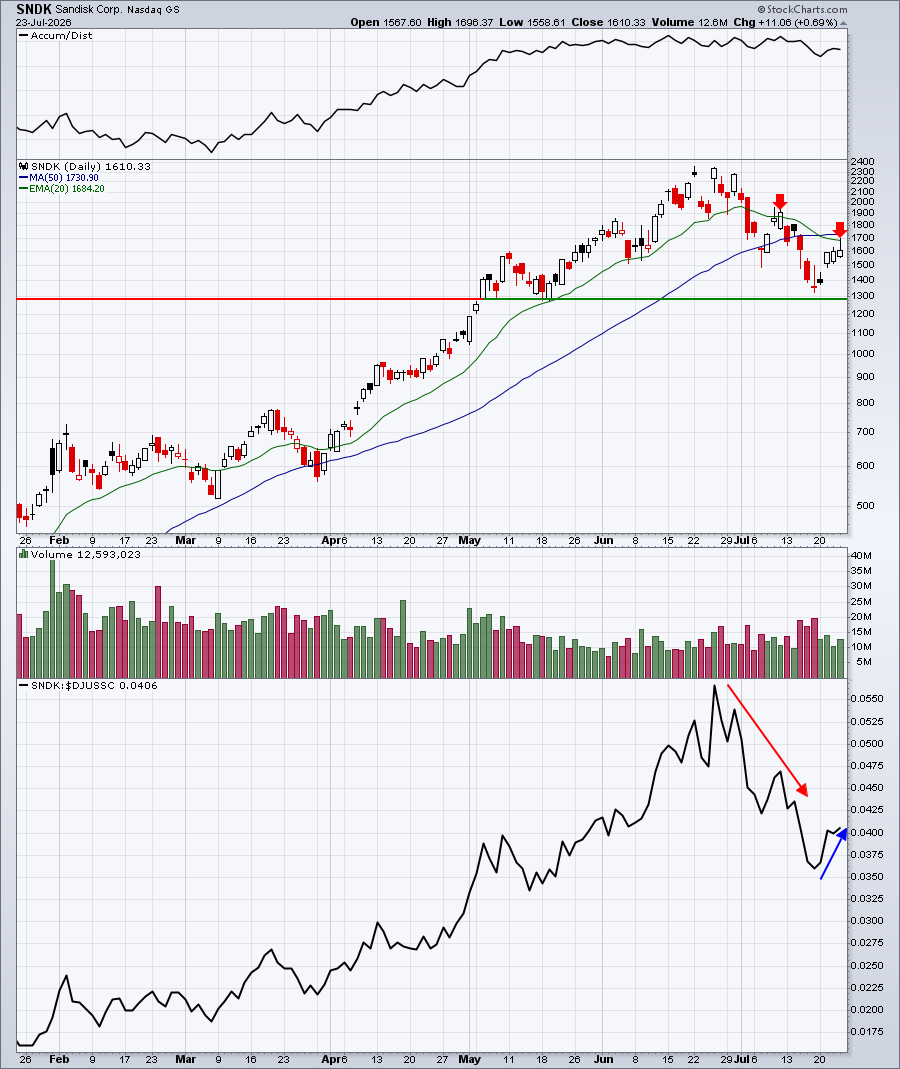
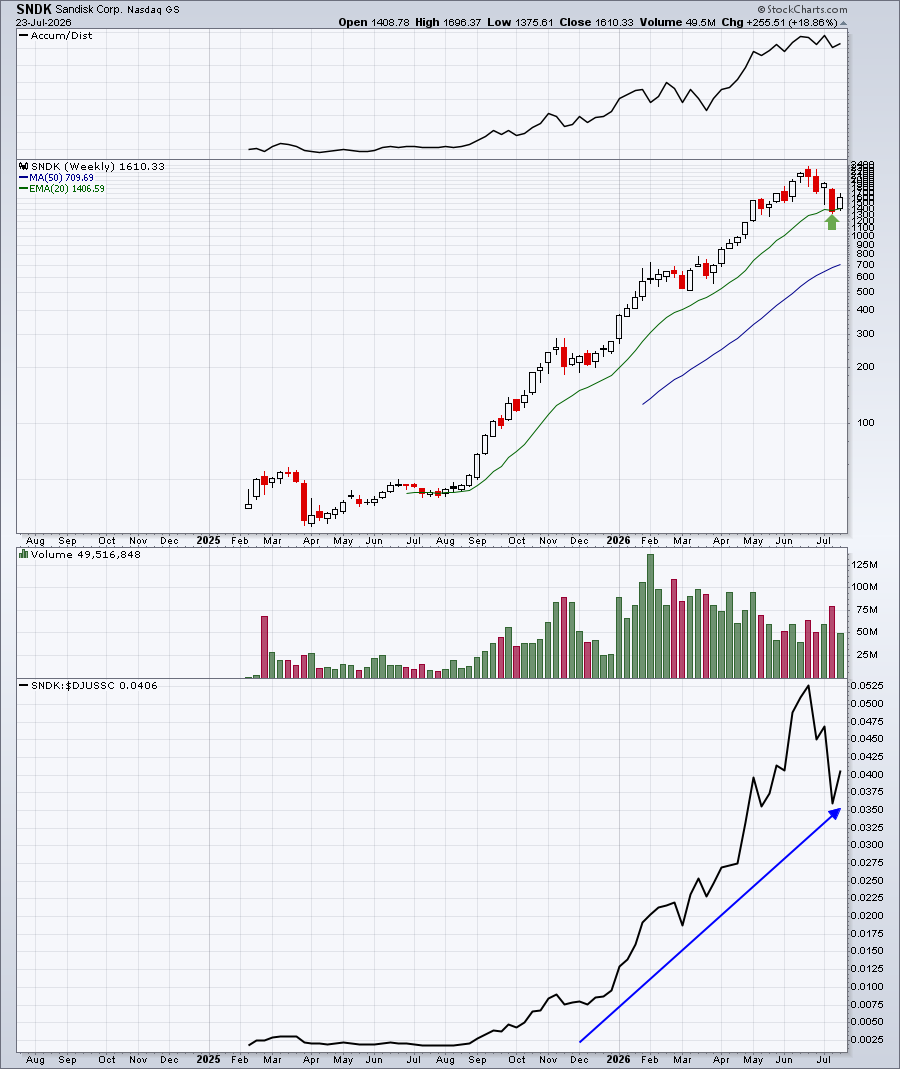
The Volatility Index ($VIX, +17.55%) has soared as our major indices have been weak throughout the day. Most of our key indices are down 1% or more. The aggressive NASDAQ 100 ($NDX) is the laggard, falling more than 2%. In a twist, however, semiconductors ($DJUSSC, -1.25%) are not leading this decline, rather simply participating in it. A few leaders like Sandisk Corp (SNDK) and Micron Technology (MU) are actually higher on the session. SNDK has now tested its 20-day EMA resistance after recently testing 20-week EMA support. Which one gives first?
SNDK - Daily Chart
SNDK - Weekly Chart
As many of you know, I keep a Key Manipulation spreadsheet updated every week to try to identify companies trending in one direction while market makers seem to be on the other side of the trade. That certainly appears to be the case with SNDK as the company lost 674.00 from its June 22nd close of 2274.15 (the day the SOXX topped) to its Wednesday close 0f 1600.15. But the breakdown of how SNDK has traded throughout the day and lost those dollars is very interesting:
Opening gaps: -297.78
9:30-10:00am: -256.91
10:00-11:00am: -278.42
11:00am-2:00pm: +117.98
2:00-4:00pm: +41.13
The selling, on a cumulative basis, has taken place via opening gaps and during the first hour and a half of trading. Meanwhile, during this decisively negative move lower, SNDK has actually gained ground over the final 5 hours of the trading day this past month. That seems quite suspicious to me and certainly doesn't appear to be distribution by Wall Street. Instead, it reeks of manipulation by market makers, likely leading to higher prices in SNDK down the road. At least that's my conclusion based on this trading pattern. Only time will tell if I'm right.
Happy trading!
Tom