
EB Daily Market Report - Wednesday, July 29, 2026
Executive Summary
- Futures were mixed overnight, but our major indices mostly got off to a negative start on the session
- We've seen relative weakness today in the Dow Jones, as its largest component stock, Goldman Sachs (GS, -3.60%) threatens a short-term breakdown
- The Volatility Index ($VIX, +6.92%) is on the rise and approaching 20, just as the Federal Reserve gets set to announce its latest policy decision at 2:00pm ET
- The 10-year treasury yield ($TNX) is up 5 basis points to 4.65%, likely adding pressure to U.S. equities
- Crude oil prices ($WTIC, +6.61%) are surging again and are back above $84 per barrel as President Trump threatens further action against Iran
- Rising crude is lifting energy shares (XLE, +2.17%), with Chevron (CVX, +2.44%) near the top of the Dow Jones leaderboard
- Meanwhile, technology shares (XLK, -1.39%) are off their earlier lows, but continue in their spiral lower
- Semiconductors (SOXX, -3.67%) remain under intense pressure as morning selling once again carried many stocks in this space much, much lower
- So will the Fed decide to raise interest rates today? The probability is that they remain on hold, but there is growing sentiment for a hike
- Fed Chief Warsh is ADAMANT that he will ensure that inflation is a thing of the past - that's been his common theme since taking over at the Fed; therefore, a rate hike can not be definitively ruled out
- Personally, I don't believe the data points to a rate hike, but we'll see
Market Outlook
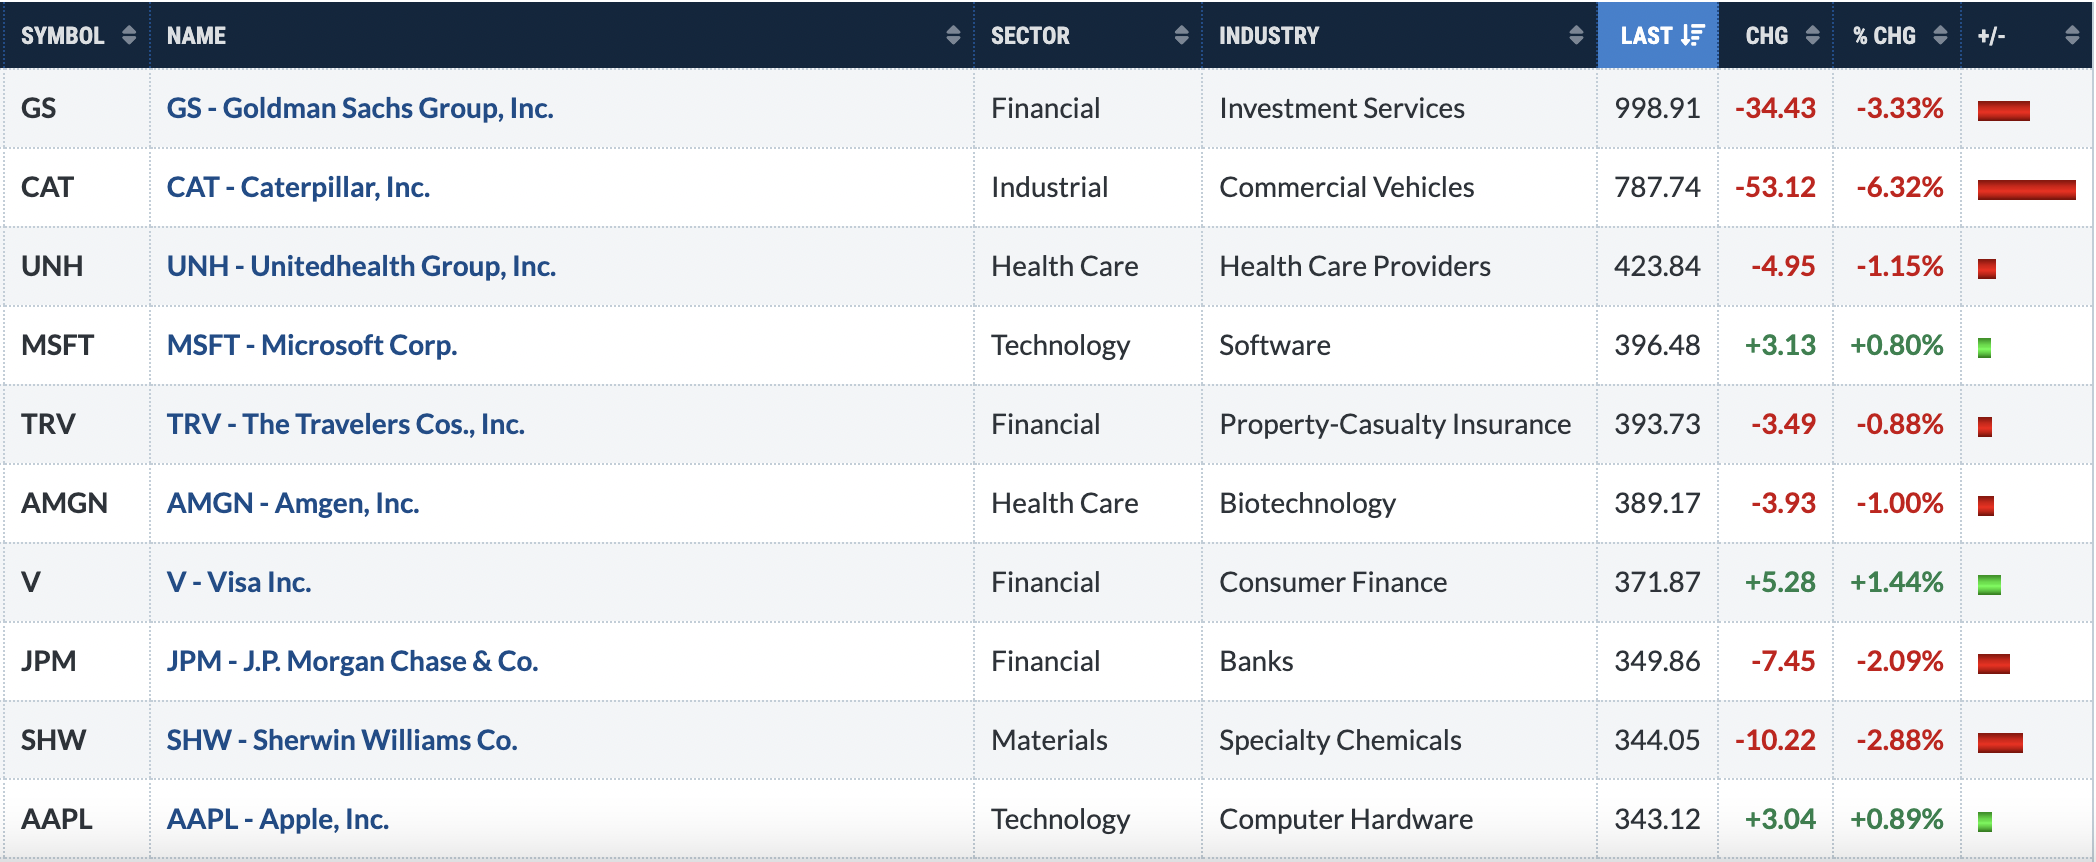
While the S&P 500 and NASDAQ 100 indices are market-cap weighted, meaning that the largest companies have the biggest impacts, the Dow Jones is not like that at all. Instead, the Dow Jones is primarily impacted by its highest PRICED stocks, like Goldman Sachs (GS) and Caterpillar (CAT), which just so happen to be the two worst-performing stocks in the Dow Jones today, triggering the relative weakness in this index. Here are the biggest influencers on the Dow Jones, based on current price:
In order to corroborate this, here's the latest breakdown of the Dow Jones Top 10 Holdings on Fidelity:
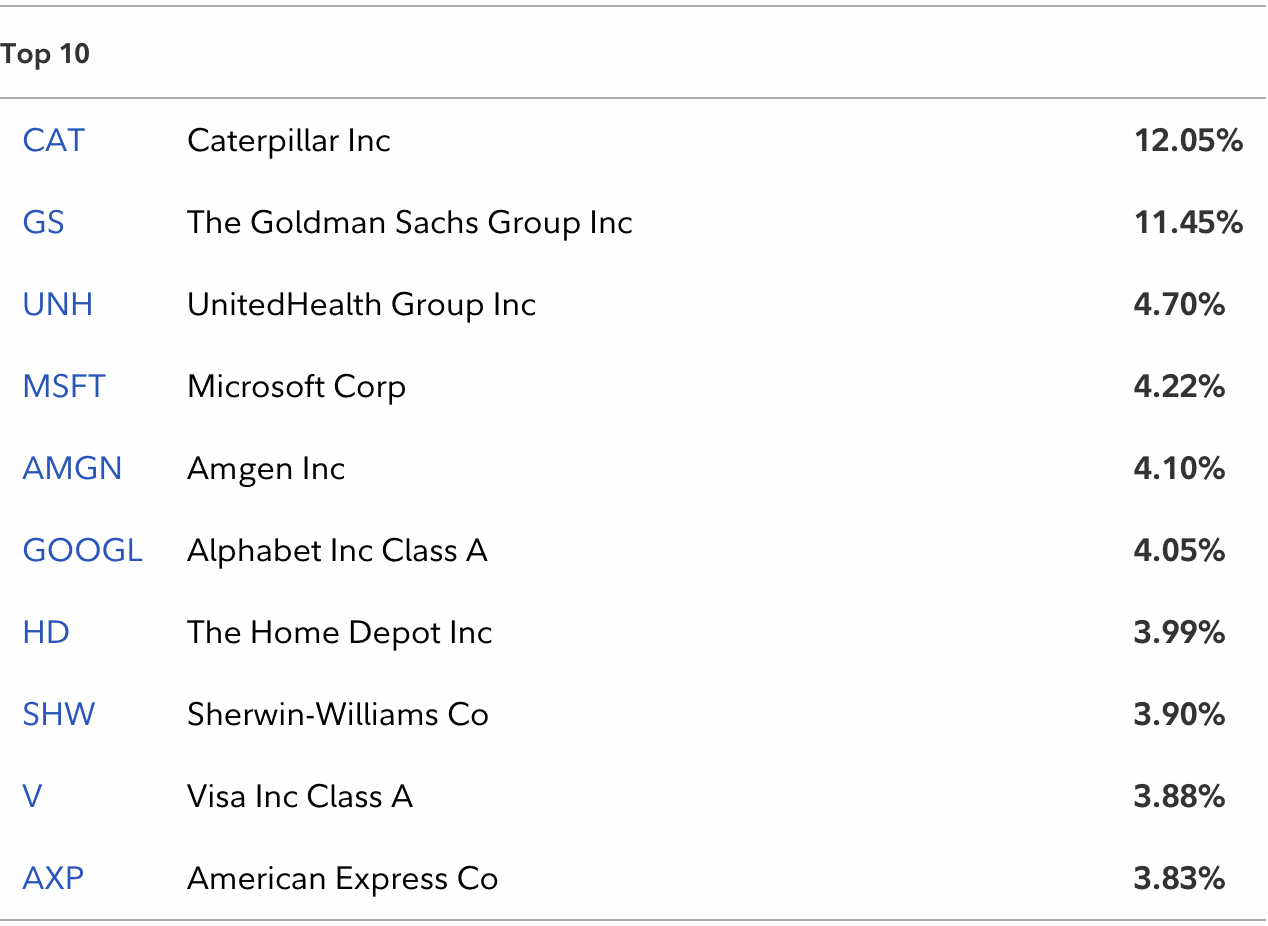
You'll see some disparities between the two, but keep in mind that Fidelity's Top 10 is as of June 30th and prices have changed somewhat on the Dow Jones components over the past month. StockCharts prices reflect today's intraday prices.
Sectors/Industries
Financials and industrials are the two largest sectors in the Dow Jones, which helps to explain why the Dow Jones tends to trail the S&P 500 and, especially the NASDAQ 100, during secular bull market advances. Financials and industrials represent more than 45% of the Dow Jones and these two sectors tend to go along with the S&P 500 and are not typically relative strength winners over the long haul. By including the Dow Jones in your portfolio, you are probably reducing your returns over time, but increasing your diversification during periods of instability and volatility.
Deciding on portfolio structure is a personal decision and it should be based, in my opinion, on your time horizon and risk tolerance. Those are the two keys.
ChartLists and Trading Strategies
Business training & employment agencies ($DJUSBE) have suddenly caught fire, something we haven't really seen in a few years. In fact, the DJUSBE has just reclaimed a key price level on its chart, moving back above 107-108:
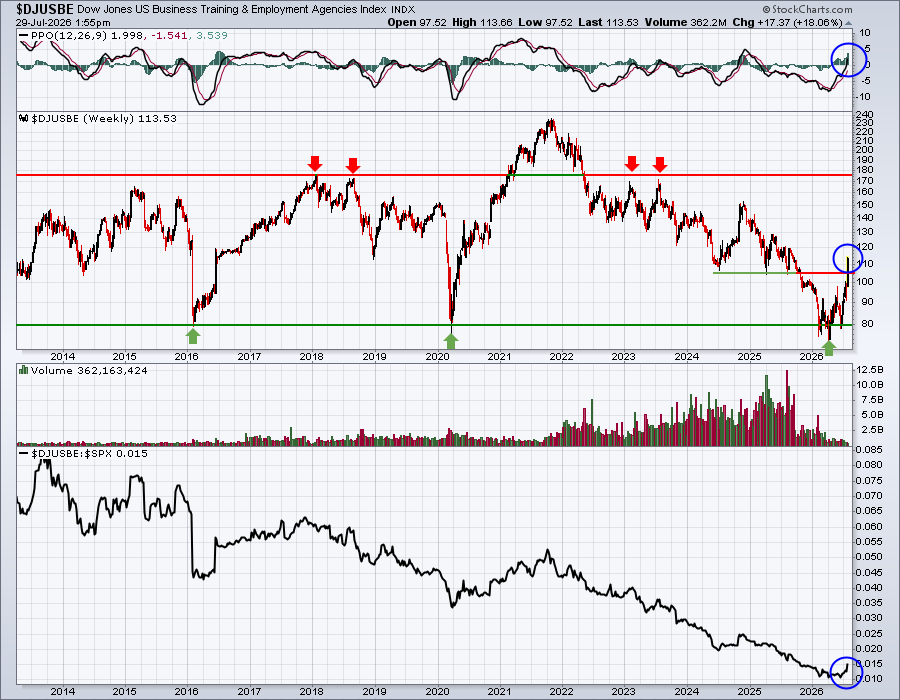
The PPO is now above zero and the group is showing the most relative strength vs. the benchmark S&P 500 than it has at any point since Q4 2024. We've already discussed recently the strength in Manpower (MAN) after its blowout earnings report. Here are a couple of other names in this space that report quarterly results later today or tomorrow morning and look great on a relative basis:
TNET (reports tomorrow morning before the opening bell)
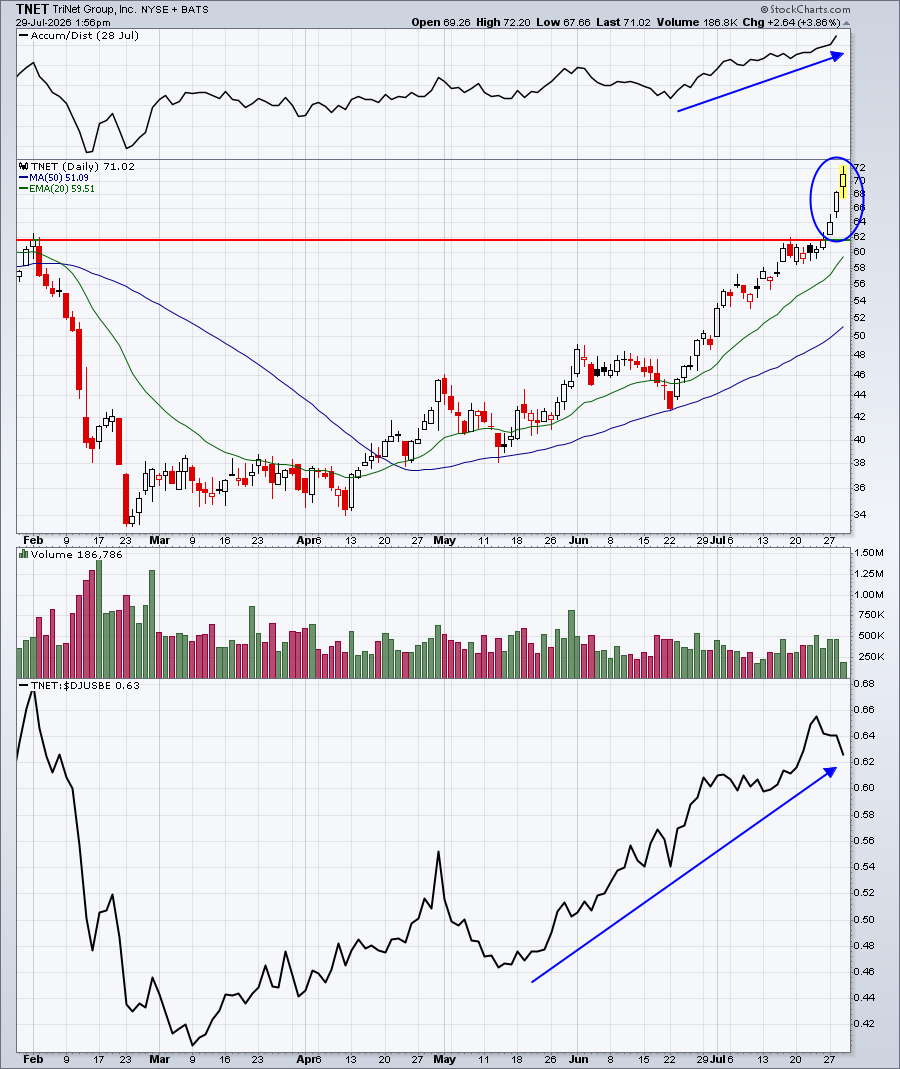
TNET has already exploded, anticipating excellent results. I see a great report coming, so if TNET were to sell off immediately after earnings, or perhaps a week or two down the road, I'd love to enter this stock on a 20-day EMA test and/or close to 62.00.
NSP (reports today after the market close)
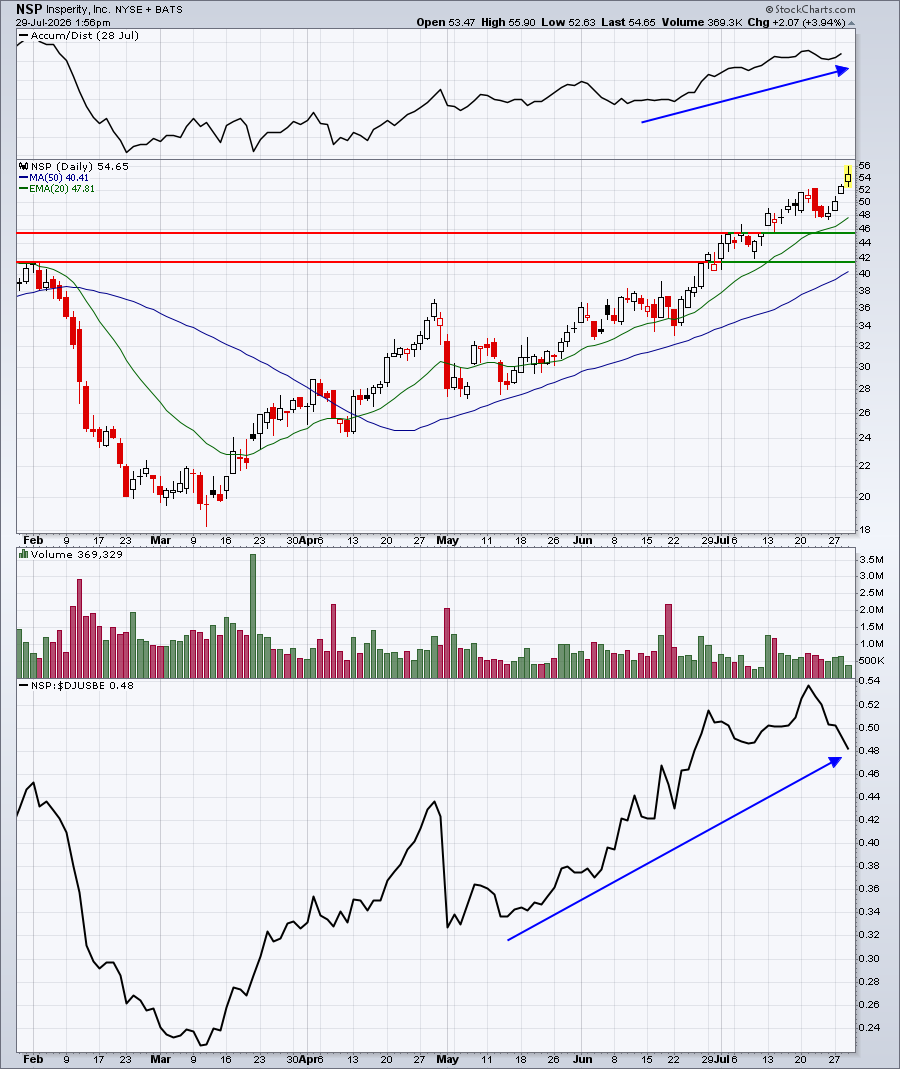
NSP's volume isn't quite as convincing on its latest breakout as is TNET's. And NSP does have a slight negative divergence in play on its daily chart (lower PPO not shown on above chart). If NSP reports excellent results, which I expect, then a subsequent selloff down into the 42.00-46.00 range could be quite tantalizing from a long perspective.
Upcoming Earnings
Upcoming Earnings and Upcoming Earnings Relative Strength ChartLists are now available on our website and we'll continue to track upcoming earnings reports and provide them to you via ChartLists throughout Q2 earnings season.
Economic Reports
FOMC policy decision at 2:00pm ET
Happy trading!
Tom