
EB Daily Market Report - Tuesday, August 4, 2026
Executive Summary
- Futures were up overnight and, after gapping higher, buying has continued throughout the day
- Strength is seen in a number of areas, but aggressive areas are favored
- Large cap growth (IWF, +2.95%) is dominating large cap value (IWD, +0.94%)
- The aggressive NASDAQ 100 ($NDX, +3.27%) is soaring and that leadership supports the breakouts we're seeing - more on this below in the Market Outlook
- Technology (XLK, +5.14%) is rebounding strongly, continuing its strength off of last Wednesday's low
- Semiconductors ($DJUSSC, +5.40%) are gaining headlines, but the electronic equipment ($DJUSAI, +7.99%) is taking center stage with a massive move
- 7 of the 11 sectors are higher, with only defensive groups and energy (XLE, -0.33%) in negative territory
- Crude oil ($WTIC, -5.73%) has dropped back beneath $76 per barrel as news seems to be pointing to a Strait of Hormuz deal between the U.S. and Iran
- The 10-year treasury yield ($TNX), which hit 4.75% on Friday, has fallen 12 basis points over the past two days
- More key earnings reports will be out after the bell today with Space Exploration (SPXC, +7.35%) and Advanced Micro Devices (AMD, +8.91%) on deck to report
- I view AMD as one of the strongest semiconductor stocks, so look for a blowout report
Market Outlook
The Dow Jones ($INDU) closed at an all-time high on Monday. The S&P 500 ($SPX) and the small cap Russell 2000 (IWM) are following the Dow's lead, as both are setting new all-time highs today. The more aggressive NASDAQ 100 ($NDX) is well behind, because of the relative weakness in semiconductors ($DJUSSC) and AI-related stocks, but it too is having a monstrous day, adding to big gains that it's seen since last Wednesday's close. If the NDX were to have another day tomorrow like it's having today, this aggressive index would find itself on the verge of a breakout as well.
I've continually emphasized the need to see "overwhelming" bearish evidence before exiting U.S. stocks and today clearly demonstrates why. Long-term investors should almost always stay the course. The exception to the rule should truly be....an exception. We should not be looking for reasons to exit. If it's time to exit, the signals will beat us over the head.
As major indices break out, it's important to see leadership from aggressive areas. If you check out ALL of our sustainability ratios, they are ALL moving up to support this breakout:
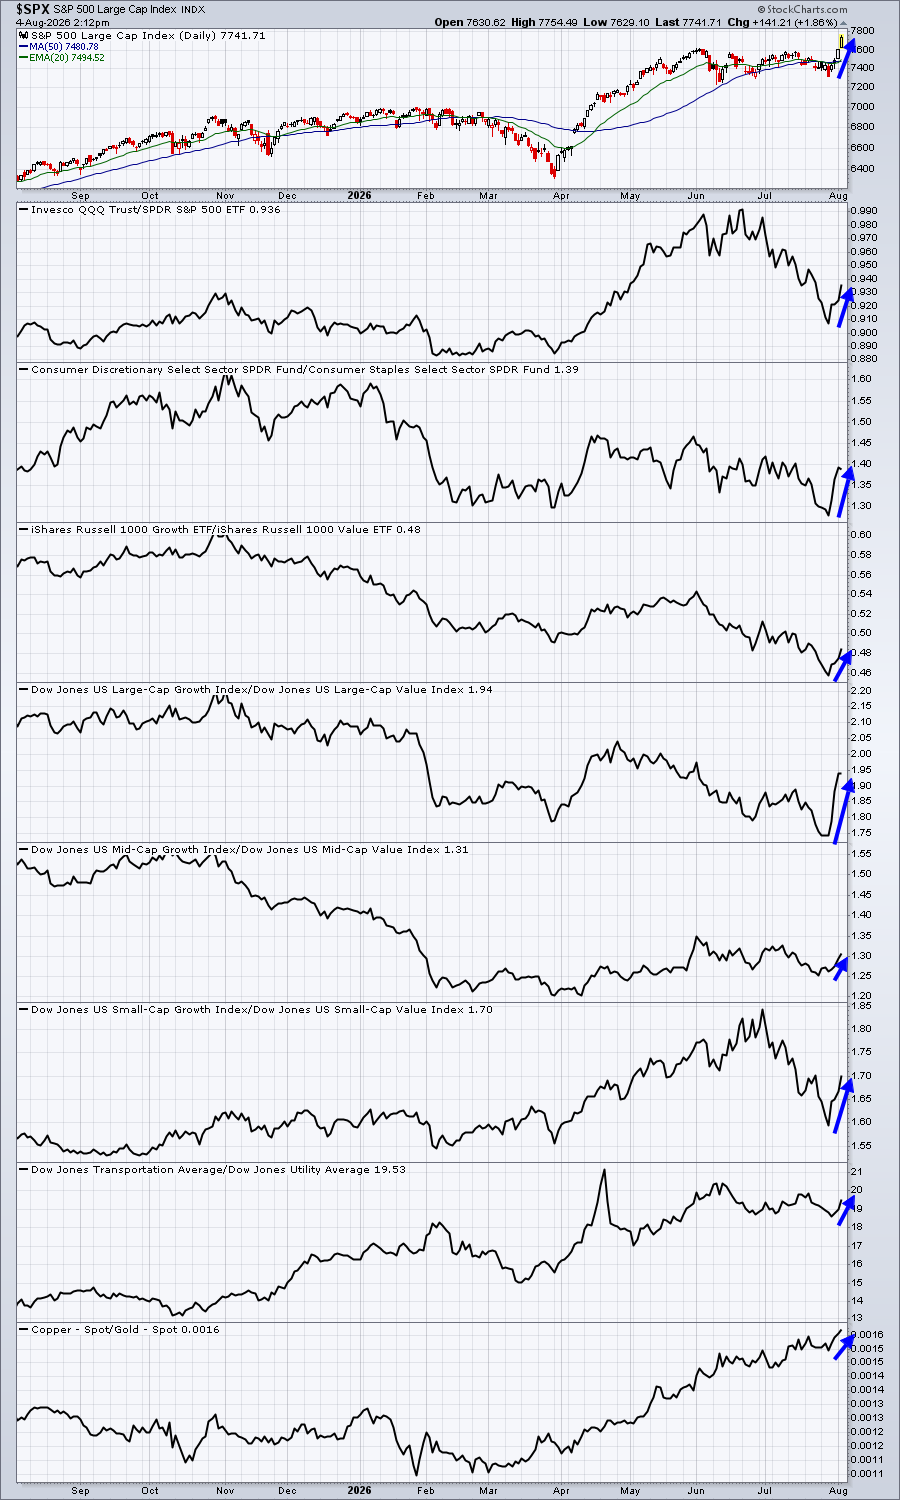
This is the support that we want to see on a breakout. Let me also be clear that our sustainability work is NOT done. Many of these ratios are turning up from lower levels. We want to see market participants remain in "risk on" mode, meaning that we want to see these ratios continue to strengthen. If the S&P 500 keeps rising and many of our ratios roll back over, that would be a more damaging signal - at least in the near-term.
Sectors/Industries
I've often referred to medical equipment stocks ($DJUSAM) as a more aggressive area within health care (XLV), which is typically thought of as a defensive sector. So I welcome both absolute and relative strength within this industry group. After many months of weakness, we've definitely seen significant improvement, but is the bottom in?
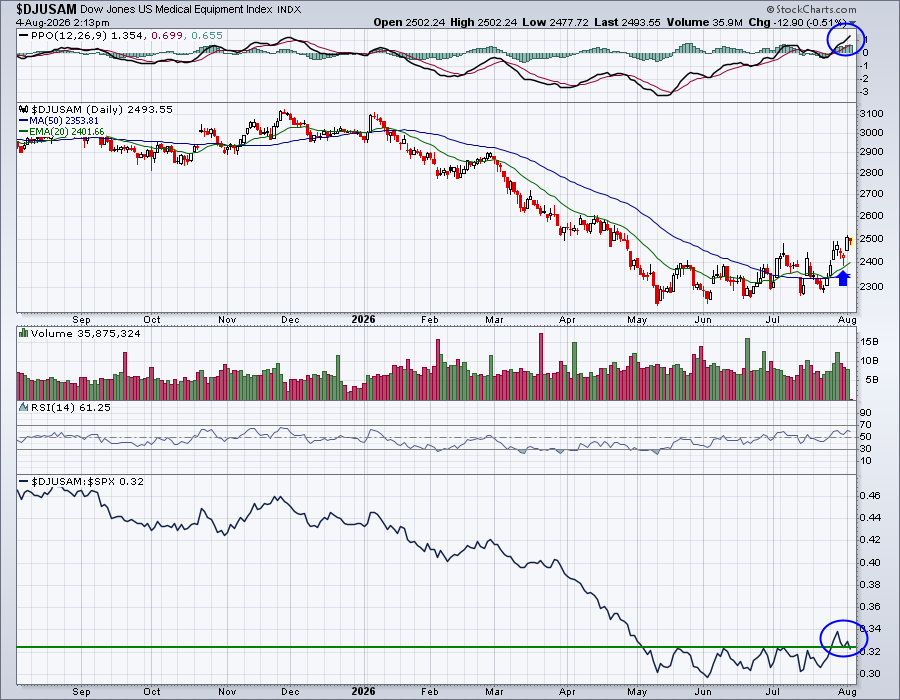
I'd argue that the odds have improved that a bottom is in, but it is by no means a guarantee. I love the PPO screaming through centerline resistance and hitting its highest momentum level in the past year. I also like the recent price range breakout and subsequent successful 20-day EMA test (blue arrow). I'm watching that relative strength panel at the bottom closely, however. It could be that the group improves on an absolute basis, but rolls over on a relative basis. We want to trade leading stocks in leading industry groups, so it's important to make sure that the $DJUSAM:$SPX ratio turn back up and set a new recent relative high.
ChartLists and Trading Strategies
I discussed the improving strength in medical equipment, but another aggressive area in health care is biotechnology ($DJUSBT). One stock that I really like in the biotech area is Medpace Holdings, Inc. (MEDP). After the closing bell on July 22nd, MEDP reported revenues and EPS that both easily exceeded expectations, as follows:
Revenues: $707.3 mil (actual) vs. $699.5 mil (estimate)
EPS: $4.25 (actual) vs. $4.08 (estimate)
In addition, MEDP raised its guidance for FY 2026. Revenues were upped to a range of $2.81 to $2.88 billion, while its previous estimate was $2.78 billion. Its EPS estimate of $17.07 was raised to a range of $17.25-$17.95:

On the price chart, MEDP gapped up significantly after earnings, but has since pulled back to a much more palatable level for entry:
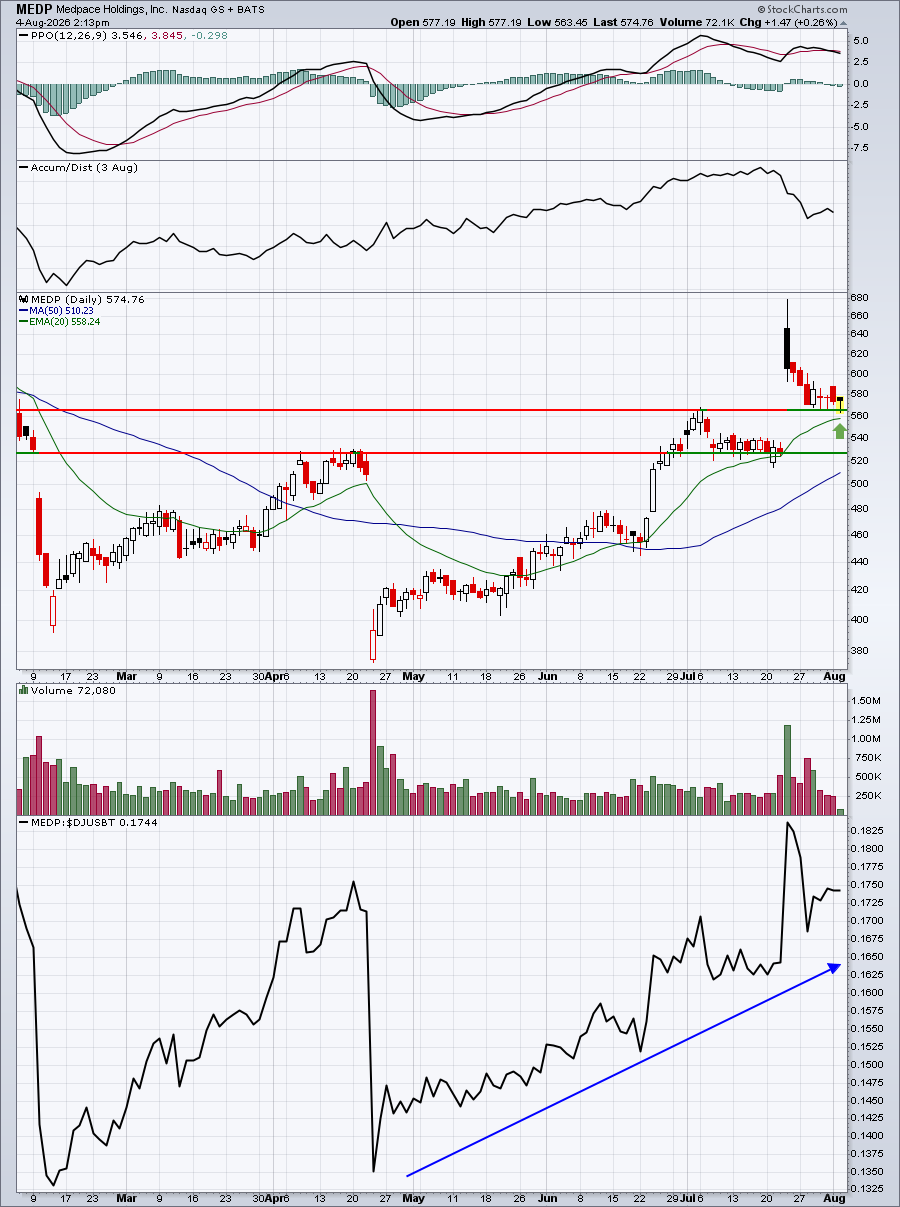
MEDP is a leader among biotech stocks and I see 3 key levels of support. The first is the prior price high, before the earnings-related gap higher. That closing high was 565.09, which MEDP tested earlier today. The next level of support is the rising 20-day EMA, currently at around 558. Then comes the bottom of gap support at 528.12. Personally, I don't believe we'll get there, but it's possible. I bought MEDP today, expecting the combination of price support at 565.09 and the 20-day EMA to hold as support. Using a 2nd or even a 3rd entry at the price levels mentioned makes solid technical sense to me. I believe MEDP will head back to its "after earnings high" near 680, which would represent more than a 20% gain from the current price.
Time will tell.
Upcoming Earnings
Upcoming Earnings and Upcoming Earnings Relative Strength ChartLists are now available on our website and we'll continue to track upcoming earnings reports and provide them to you via ChartLists throughout Q2 earnings season.
Economic Reports
June factory orders: -0.3% (actual) vs. +0.3% (estimate)
June JOLTS: 7,400,000 (actual) vs. 7,400,000 (estimate)
Happy trading!
Tom