
EB Daily Market Report - Wednesday, August 5, 2026
Executive Summary
- Futures were up slightly overnight and our major indices gapped higher
- A bit of selling followed and we're now mostly flat to lower
- The 10-year treasury yield ($TNX) is slightly lower to 4.62%, extending its losing streak to 3 days
- Energy (XLE, -1.89%) again finds itself lagging badly as crude oil prices ($WTIC, -1.53%) drop below $75 per barrel
- Other commodities, however, like gold ($GOLD, +3.57%) and silver ($SILVER, +3.34%) are having their best days, with the former climbing above its 50-day SMA for the first time since March
- Alphabet (GOOGL, -4.16%) is leading a weak communications services group (XLC, -1.49%)
- SpaceEx (SPCX, -10.68%) and Advanced Micro Devices (AMD, -6.28%) are both lower after earnings, dragging the NASDAQ 100 fractionally lower
- The ADP employment report showed that jobs have slowed, but remain positive; the Friday's nonfarm payrolls report will be more closely watched
- Headlining the earnings docket tonight will be Sandisk Corp (SNDK, -0.72%) and Western Digital (WDC, -0.06%)
Market Outlook
Technically, we honestly couldn't ask for much more. On the weekly chart, all of our key indices have remained above their respective rising 20-week EMAs and are bouncing beautifully, including breakouts on the Dow Jones, S&P 500, Russell 2000, and S&P 400 Mid Cap indices. Transports ($TRAN) have been weak, but are currently testing their rising 20-week EMA, a great spot for entry. Even the weaker NASDAQ 100 ($NDX) shows a successful test and bounce off its 20-week EMA:
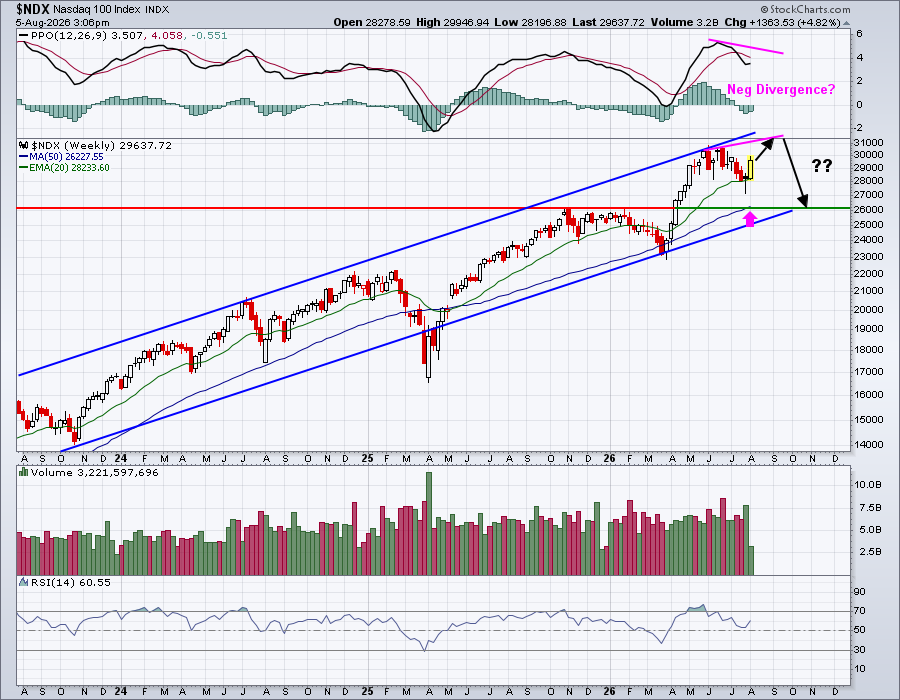
Let me give you my "worst case" scenario as we approach Q4. We know that August, September, and even parts of October can be troublesome. It's possible that the NDX could break out, print a negative divergence, and then retreat back to its rising trend line and its 50-week SMA, resetting its weekly PPO at the centerline in the process. I'm not predicting this, but if semiconductors were to continue to struggle on a relative basis, it's not out of the question.
Like I said above, the charts are BULLISH right now. I am NOT betting against this market making a further upside move. I'm simply offering up a bearish/cautious possibility given negative divergences that could develop, along with a cautious time of the year historically.
Sectors/Industries
I know a lot of folks have wanted to write off software stocks ($DJUSSW) for a long time, mostly hailing AI as a major headwind for the industry. I'm not in that camp. Instead, I see the DJUSSW as an index that absolutely flew from the cyclical bear market bottom in October 2023 at 3560.85 to a top in October 2025 of 9040.04. That was roughly a 160% advance in 2 years. It's ok to consolidate those types of gains for awhile. Unfortunately, most market participants lack in the perspective department. Do you want to know what I see on the charts? A group that exploded to the upside and printed a POTENTIAL head & shoulders top, which really fueled the bears and their doomsday predictions:
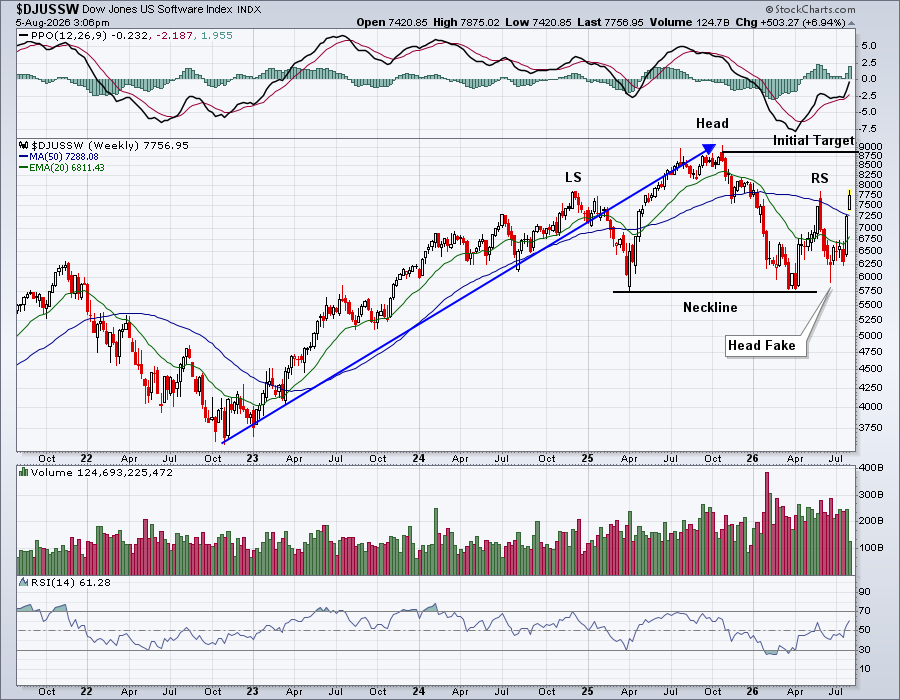
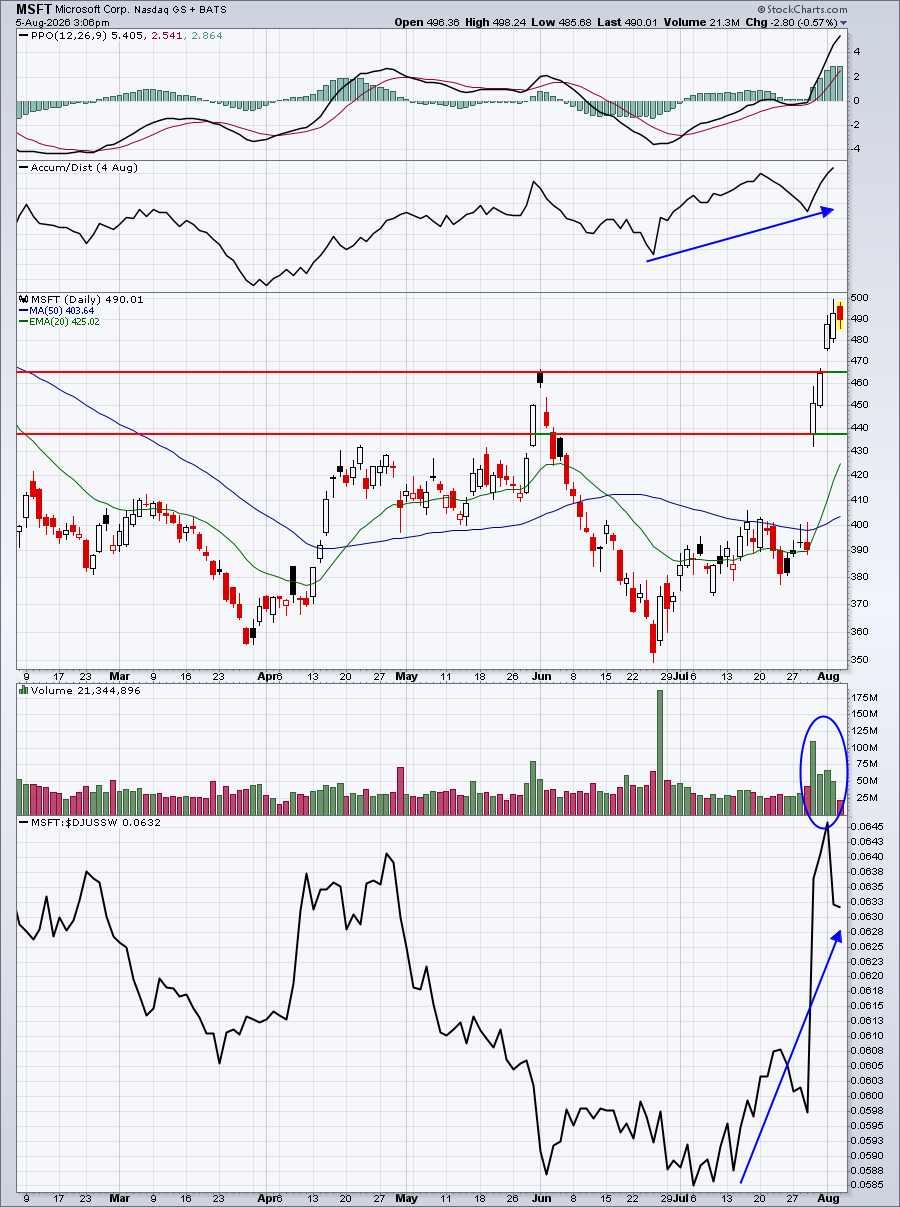
When the group scorched higher in May, I thought the double bottom was in and we were heading back to test the 9000 level. I was wrong. Software turned around and printed one more low, a head fake if you will, before rallying back up to the right shoulder high. This bearish pattern is still intact, by the way. If you're bearish the group and continue to argue that this is the top and nasty downtrend is about to begin, I can't really argue technically. The pattern is there and it's easy to see. But there are two things that would make me argue otherwise. The first is the simple fact that we're in a secular bull market and I do NOT look for bearish execution of patterns. They rarely occur during secular bull markets. They do nothing, but provide fodder for the bears, in my opinion. Second, prior leadership is showing resiliency and resuming their prior strength - stocks like Microsoft (MSFT) and Palantir (PLTR), which both demonstrated with their latest quarterly results that they are, by no means, dead.
Check out their latest charts:
MSFT:
PLTR:
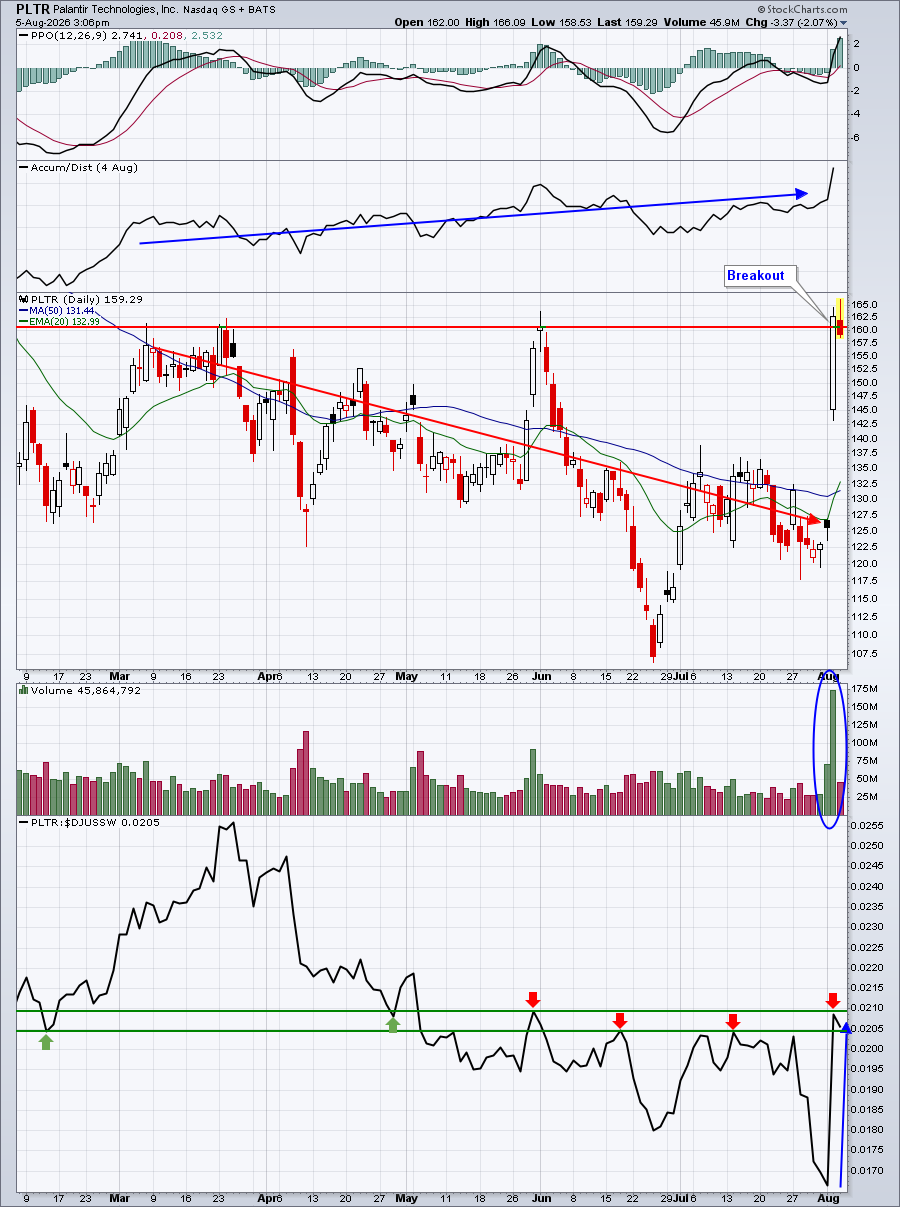
These just don't look like broken stocks to me and if you're looking for a collapse in software stocks, the leaders have to go to. I just don't see it. While admittedly PLTR still has much technical work left to do, check out its AD line rising over the past 5 months, while the stock has been consistently weakening. There are folks on Wall Street that believe in this company and so do I.
ChartLists and Trading Strategies
If you tend to struggle with always chasing and buying stocks AFTER they've made big moves and then watching as they pull back, change your strategy. One of our predefined scans on our website is what we refer to as our Downtrend Reversal scan. This scan will ONLY pick up companies that have printed lower daily highs for at least the past 5 days, where the current day actually is printing a higher high. While this does not guarantee that a stock will continue to climb, it is the necessary first step and it also will eliminate the habit of chasing red-hot stocks and, instead, buying pullbacks. Yesterday, two stocks from our Strong Earnings (SECL) and Raised Guidance (RGCL) ChartLists made the cut on this scan - BG and HXL. I found the charts interesting, particularly BG, because the recent pullback took the stock down to key price support.
BG:
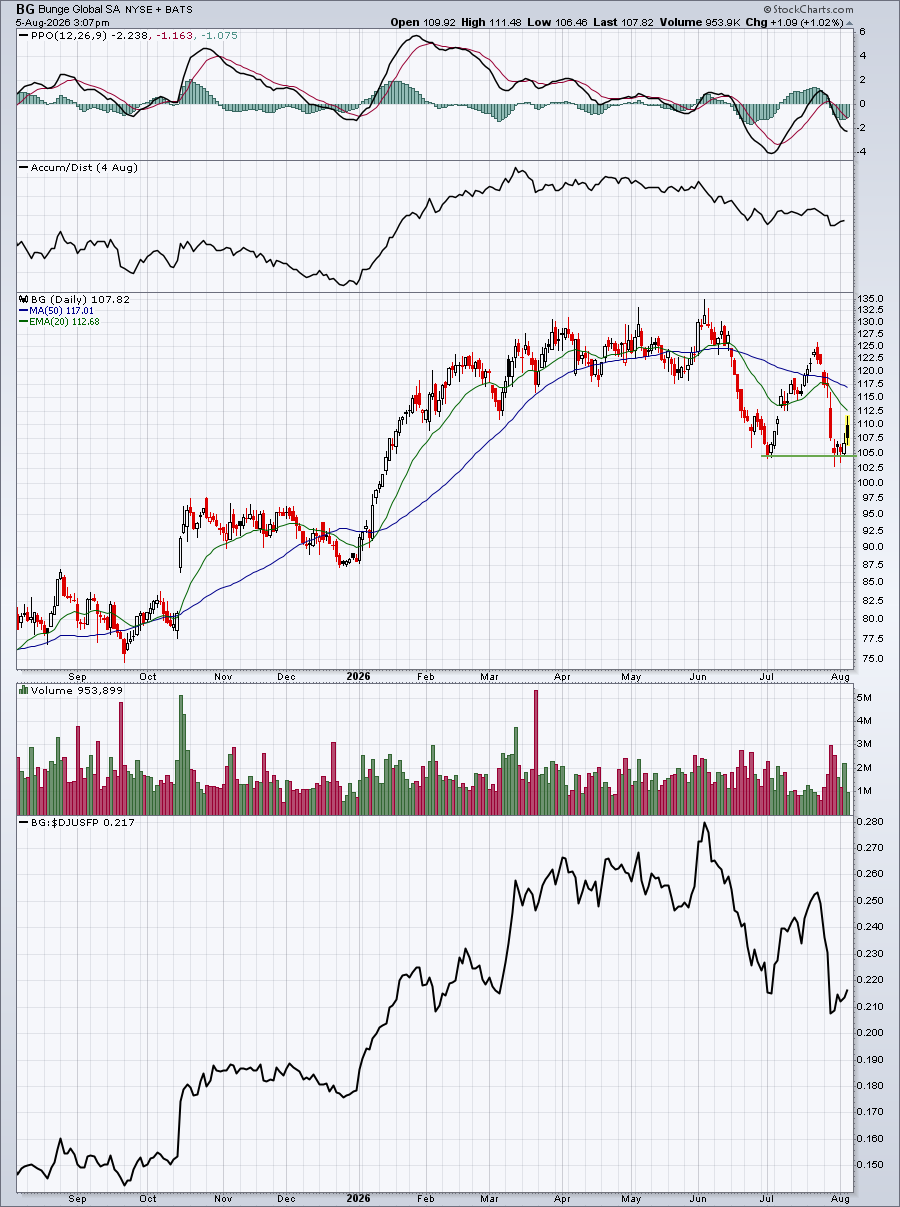
I'm not saying this is the best stock to trade, but the scan ensures that you don't simply chase winning stocks.
I ran this same scan today and there were 13 stocks returned, as follows:
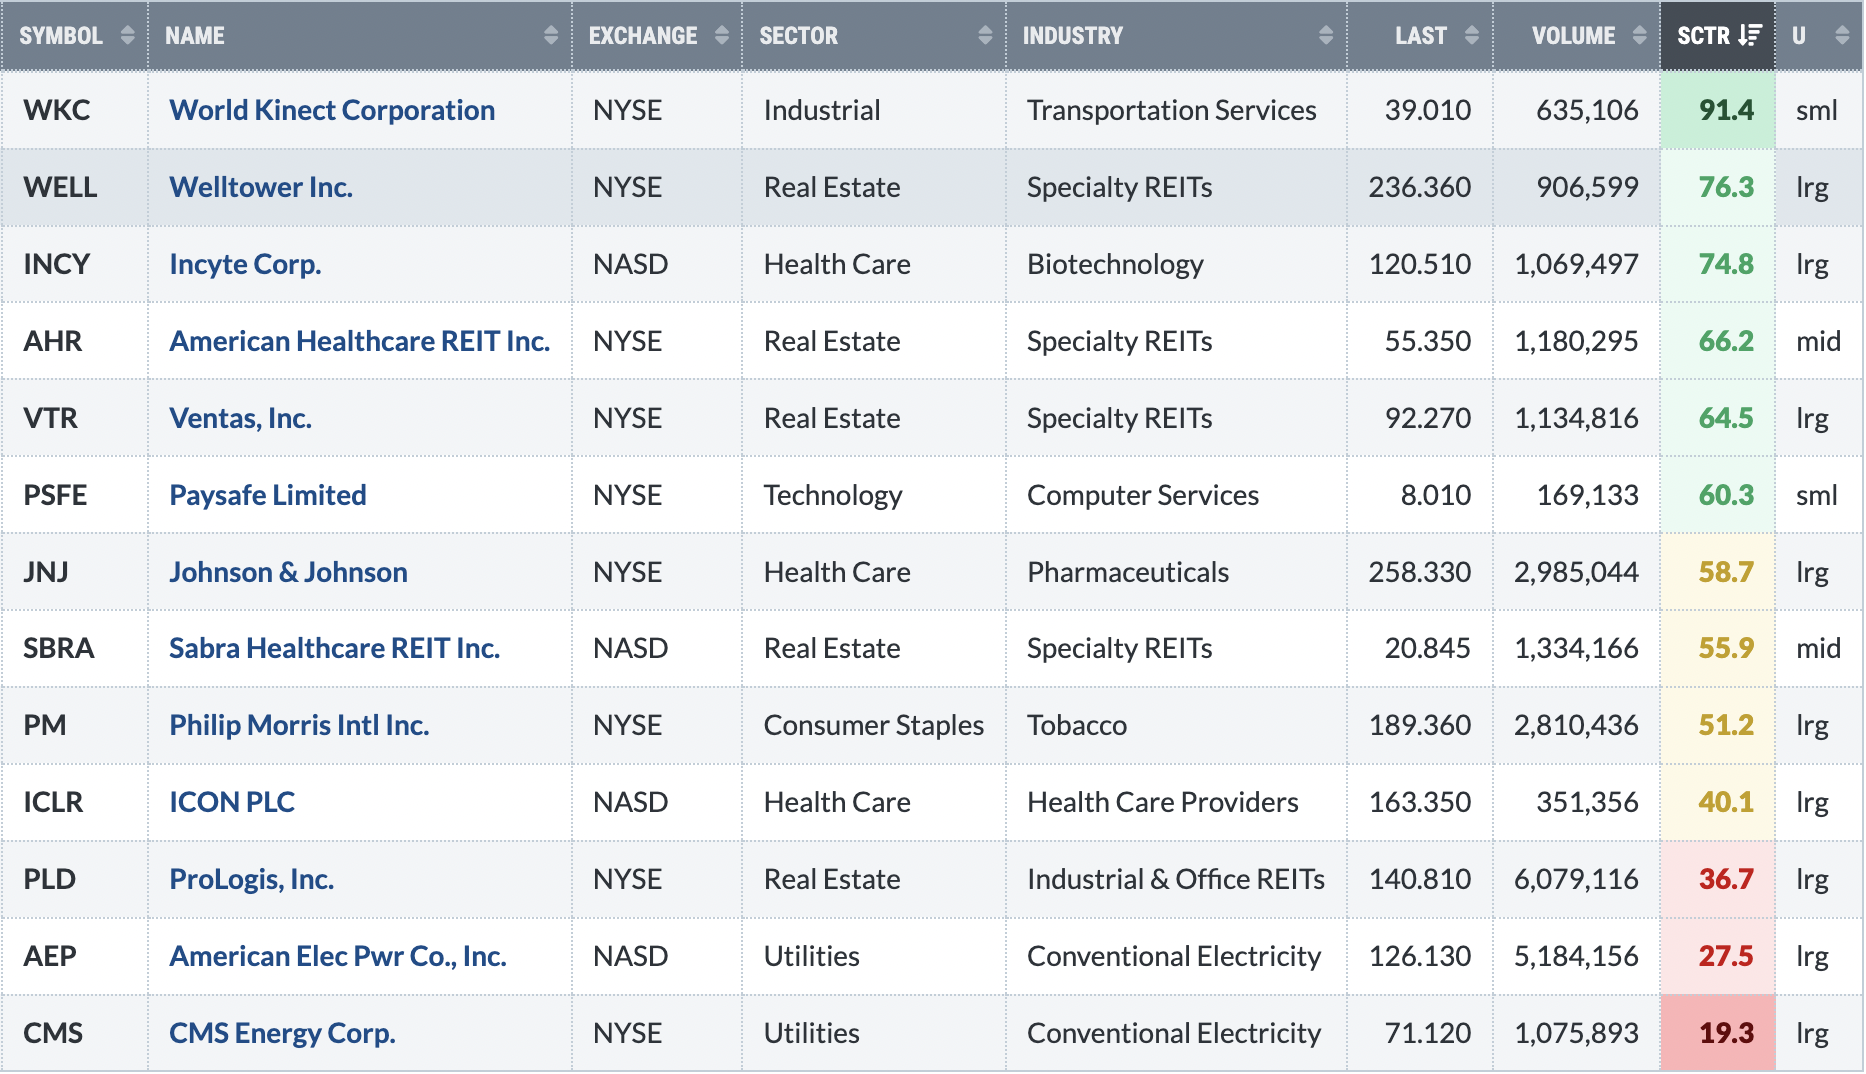
I thought INCY and VTR looked interesting, with the former testing its 20-day EMA yesterday with a hammer and the latter testing its 50-day SMA with a hammer. Let's check out VTR:
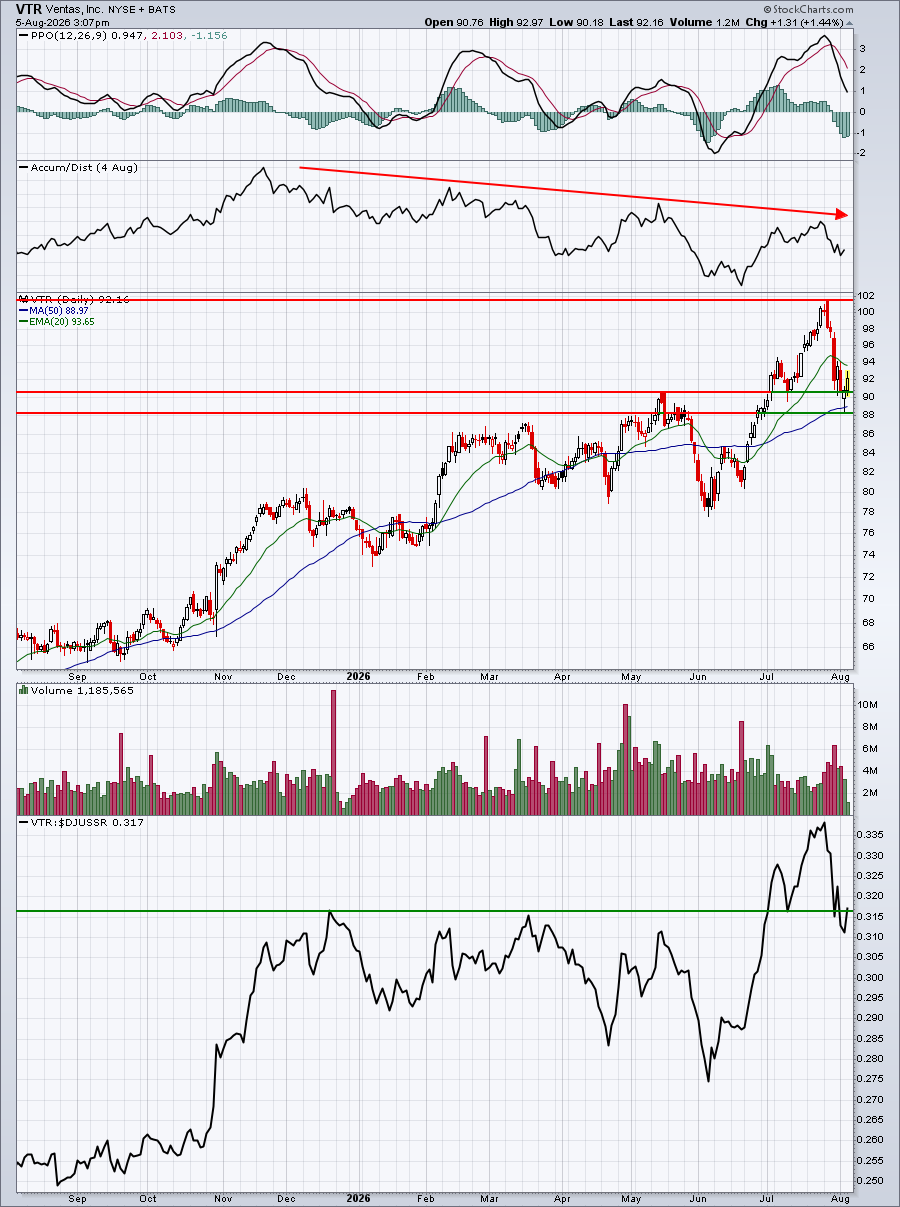
Is it perfect? No, it's hard to find those. But I do like a few things here. First, it's a real estate stock, which might not be a bad hedge as we move deeper into the summer months. Second, it's clear target is the recent high near 102. I'd want to see 88 hold as closing support. So entering into VTR from the current price down to 89-90 would make good technical sense to me. It's not sexy and it's very unlikely to jump 10 bucks in a day, but I do like the reward to risk and it's a more defensive-type trade.
The more aggressive trade, in my opinion, would be INCY, a leading biotech stock. It gapped up this morning after printing yesterday's hammer, but has retreated back and is actually down slightly from yesterday's close at this time. A close below the 20-day EMA would bother me, so I'd keep a tight stop, while looking for a return to the 130-132 area.
As you probably are aware, I love to trade earnings. I especially like a stock that beats Wall Street estimates as to both revenues and EPS, is a leading stock in its industry, and pulls back to a level where I can look for a reversal with a very tight stop. Enter LivaNova (LIVN), a medical supplies ($DJUSMS) stock. LIVN easily surpassed its EPS estimate of 1.08, posting 1.26. Revenues came in at $390.6 million, ahead of its $379.6 million estimate. LIVN also raised guidance for FY2026 from $4.15 to a range of $4.30-$4.40. Its AD line is very strong and its relative strength is much, much better than it was months ago. So what happened to LIVN? It gapped down and at one point traded down to take out a low from two weeks ago and also hit a key gap support level:
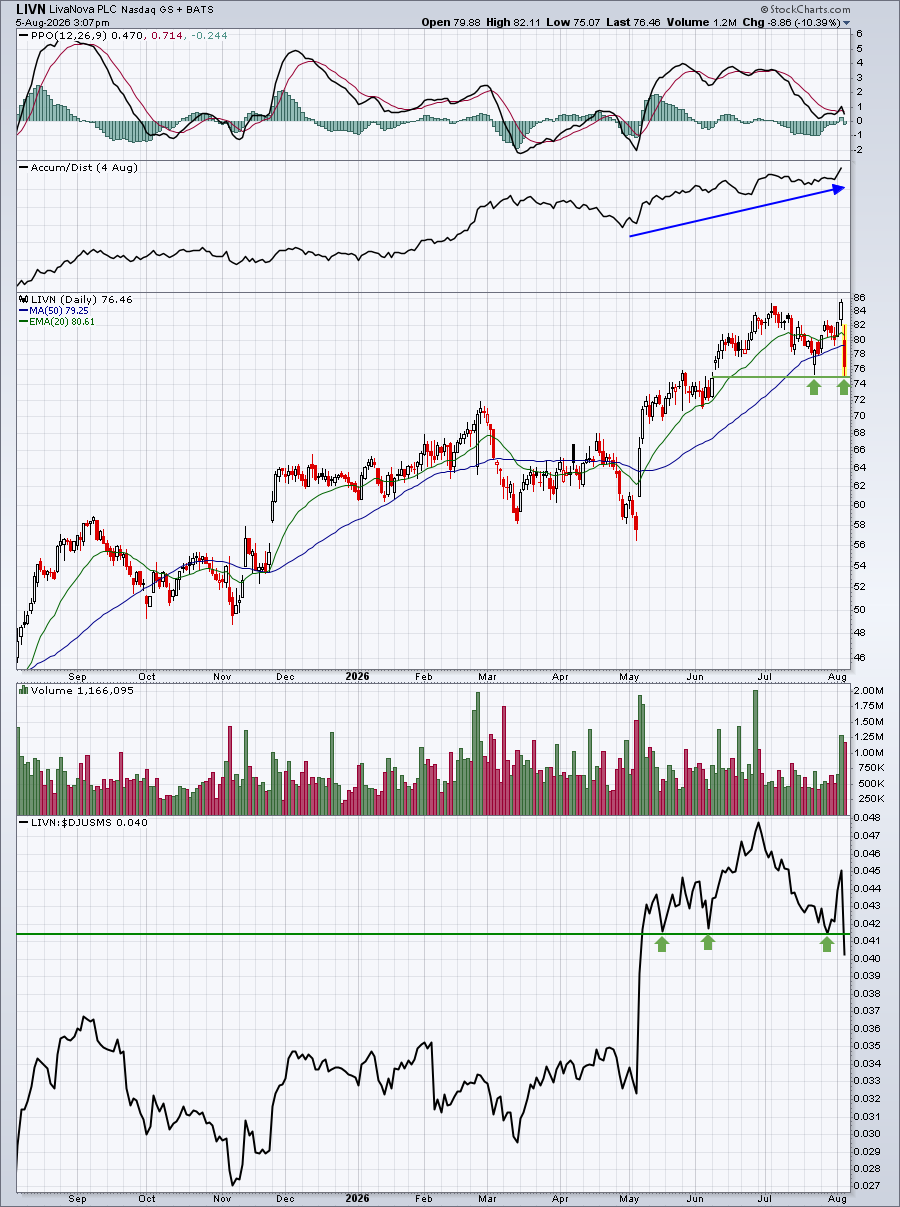
When LIVN turned higher for the 2nd time this morning, I took a position and I have an intraday stop just below today's low. My stop is VERY tight and my upside, in my opinion, is very strong. Remember, LIVN's AD line is strong, indicating that this stock tends to finish the day bullishly. That's what I'm counting on. If it doesn't, I exit with a slight scratch. If it rebounds solidly, I make some good money. It's an intraday trade for me. If it finishes reasonably well, I'll consider holding it overnight as I did MEDP yesterday. That does increase the risk, however, as the trade then becomes subject to overnight action and potential market maker manipulation.
Upcoming Earnings
Upcoming Earnings and Upcoming Earnings Relative Strength ChartLists are now available on our website and we'll continue to track upcoming earnings reports and provide them to you via ChartLists throughout Q2 earnings season.
Economic Reports
July ADP report: 44,000 (actual) vs. 75,000 (estimate)
July PMI services: 54.6% (actual) vs. 53.6% (estimate)
July ISM services: 54.1% (actual) vs. 54.5% (estimate)
Happy trading!
Tom