
EB Daily Market Report - Tuesday, August 11, 2026
Executive Summary
- Futures were mixed, but mostly higher overnight
- After a strong open, we've seen selling throughout much of the session
- 7 of 11 sectors are lower, led by consumer stocks with staples (XLP, -0.51%) leading the way
- Crude oil ($WTIC, +1.31%) is back above $83 per barrel, as energy (XLE, +1.07%) leads all sectors - more on the XLE below
- The 10-year treasury yield ($TNX) is down slightly to 4.68%, ahead of two key inflation reports later this week
- Despite overall market selling, the Volatility Index ($VIX, -0.11%) has drifted slightly lower
- Footwear ($DJUSFT, -3.00%) is nearing major support at 1000, set back in May
- Media agencies ($DJUSAV, -3.85%) is the other poorly-performing industry, failing to hold price support from February 2026
- Lumentum Holdings (LITE, +0.34%) and CoreWeave (CRWV, -0.65%) headline companies reporting quarterly results after the bell; CRWV, in particular, has been underperforming its software peers for the past 3 months, I'd fear a gap lower
Market Outlook
There's probably too much emphasis placed on retail stocks as the long-term history suggests only mild positive correlation between the direction of relative retail performance and the direction of the S&P 500. Here's the chart:
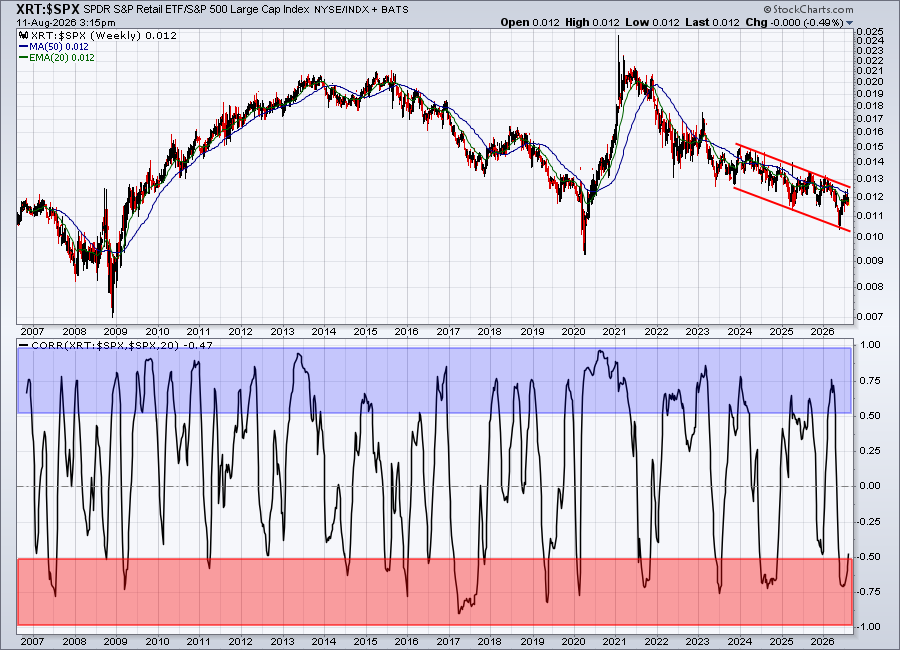
While it's not absolutely critical that retail stocks perform well to lead U.S. stocks higher, it does help. So that's why I believe the latest absolute breakout in the XRT is worth watching:
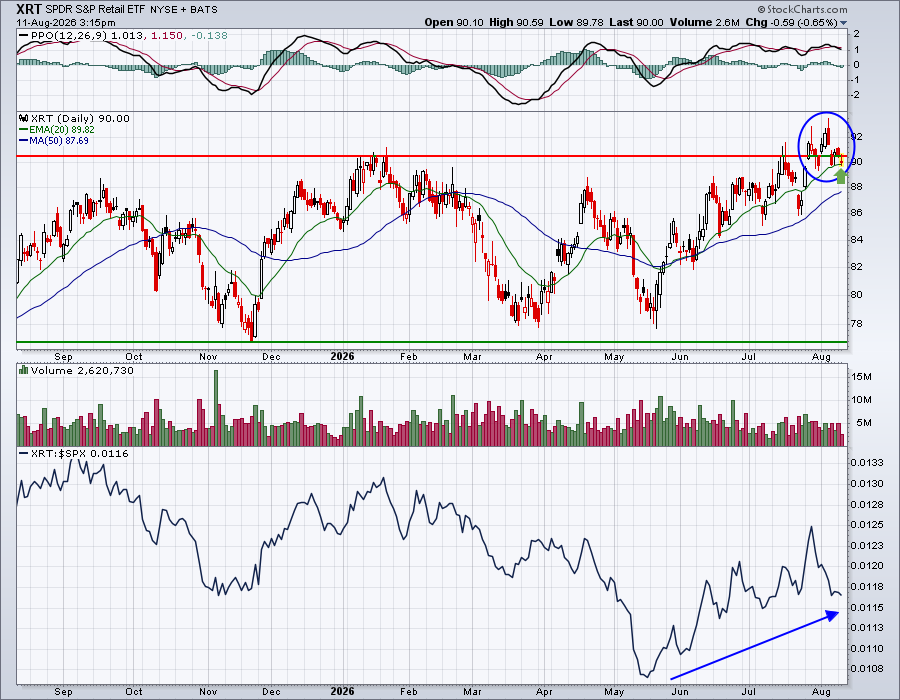
In the past, whenever I'd see a breakout, I'd want to see that prior price resistance hold as price support going forward. That's TA 101. However, I found that many times, a stock, ETF, index, etc. would fall back below price support, but then hold rising 20-day EMA. Currently, the 20-day EMA on the XRT is at 89.82. Again, I don't believe the XRT bouncing here is 100% critical, but failure to bounce would be one potentially damaging sign, especially given the fact that, over time, there is some positive correlation between the XRT:$SPX and the $SPX itself.
Sectors/Industries
Energy is one of the most volatile sectors, so breakouts and/or breakdowns can sometimes be taken with a grain of salt. It's a big reason why I don't personally like to trade energy stocks. There are too many factors that influence trading in this part of the market that we cannot control. The biggest factor, obviously, is the tension felt in the Middle East. It only takes a few choice words out of the U.S. or Iran to completely reverse the fortunes of the energy trade.
Having said all of this, it's still worth mentioning that the XLE has reached a key short-term price resistance zone:
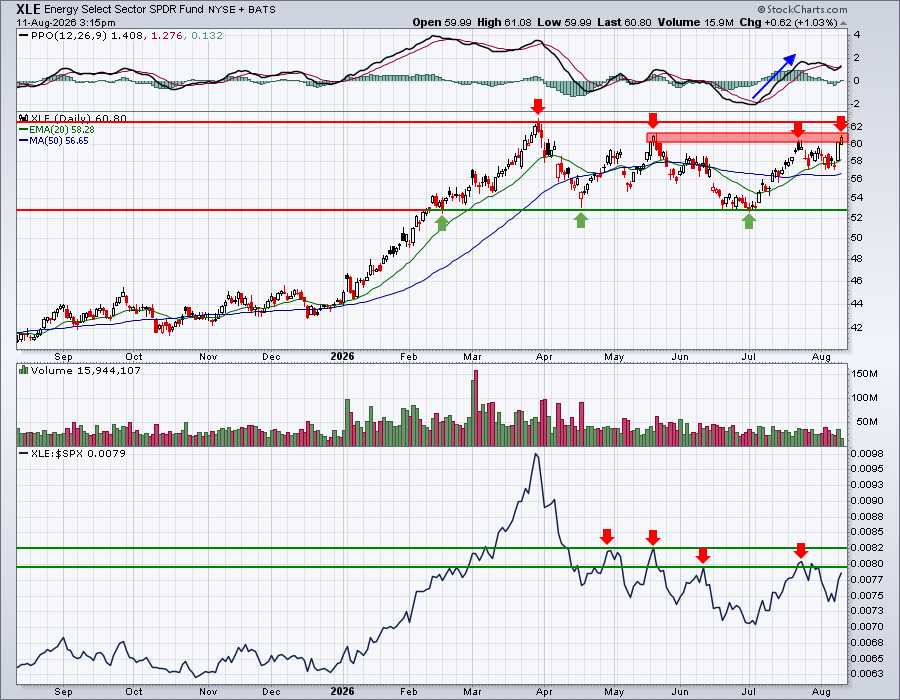
The bigger trading range is from 53 to 63, but initially the XLE must negotiate the recent double top from 60 to 61. The PPO is very solid and, on this latest pullback, the combination of price support at 57, along with the rising 20-day EMA, is providing solid support. I'd feel much more comfortable trusting the XLE's strength if its relative strength improves and clears all of the relative resistance in the bottom panel.
ChartLists and Trading Strategies
Sometimes, knowing what NOT to buy is just as important as knowing what to buy. You should all know by now that I believe we should stick with stocks showing relative strength. Those downtrending vs. their peers are much higher risk, in my view. There very well could be a reason why a stock is showing weak relative performance. Wall Street may be dumping a stock ahead of bad news, just like they tend to buy before good news.
Let me give you a recent example. Inseego (INSG) was flying high in the red-hot telecom equipment group ($DJUSCT) back in early May. Then, suddenly, everything changed. INSG began tumbling on much heavier volume, its AD line fell apart, and its relative strength went into the tank. Check out its chart:
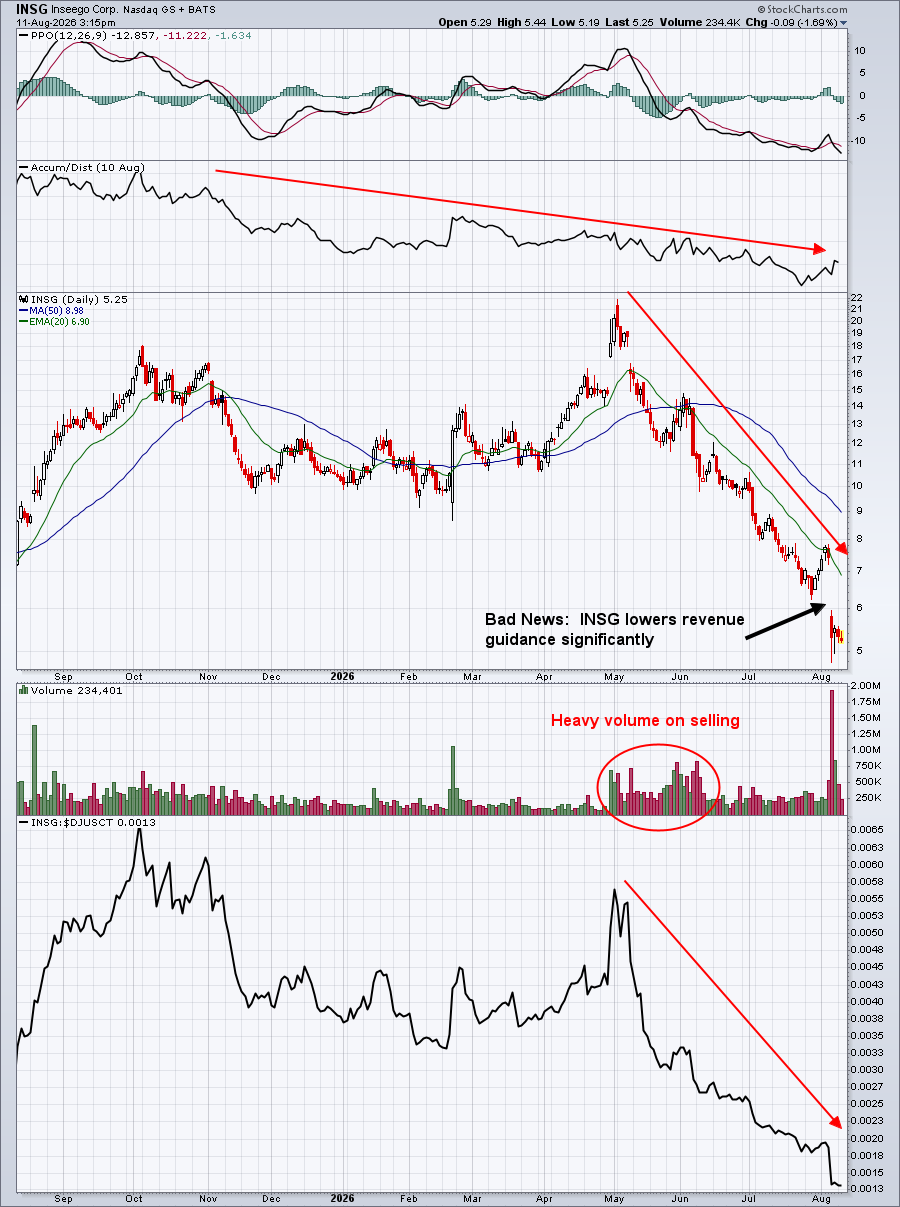
Last week, INSG warned. They significantly lowered Q3 and FY26 revenue estimates. While INSG tumbled even further after the news, the writing was absolutely on the walls. I am always afraid that a downtrending stock, especially one showing such poor volume trends and relative strength, is going to “spill the beans” and release bad news. In this case, INSG did so in the form of reduced forward guidance.
The lesson? Stay away from companies showing such abysmal relative performance.
Upcoming Earnings
Upcoming Earnings and Upcoming Earnings Relative Strength ChartLists are now available on our website and we'll continue to track upcoming earnings reports and provide them to you via ChartLists throughout Q2 earnings season.
Economic Reports
July existing home sales: 4,060,000 (actual) vs. 4,050,000 (estimate)
Happy trading!
Tom