
EB Daily Market Report - Wednesday, August 19, 2026
Portfolios Close Out Today
Our Portfolios END as of today's closing prices. We will then remain in cash through monthly options expiration Friday and one additional day - the Monday following options expiration Friday. Our next Portfolio DRAFT will take place on Monday evening, August 24th, at which time we'll announce the stocks in each of our Portfolios. We will then enter those stocks (for EB.com tracking purposes) at Tuesday's opening prices.
Recently, I received a question from a member, asking if any of the current Portfolio stocks will remain in the next quarterly Portfolios. The question was asked, because the member did not want to sell and create an income tax liability on stocks with gains if that same stock would be in the next Portfolio. I understand the question, but am not sure which stocks will be in next quarter's Portfolios as of today. Therefore, if taxes are a concern on current Portfolio stocks with gains, you can consider holding those stocks until Monday evening's DRAFT. Of course, that adds additional risk in terms of holding those stocks for a few more trading days, but perhaps that offsets the risk of unnecessarily creating an income tax burden? If the stocks are held in a retirement account, the tax issue is moot.
Several of the Portfolio stocks have losses this quarter. Of course, there would be no income tax worries on stocks with losses.
What to do is up to each individual, I just wanted to offer a possible alternative.
Executive Summary
- Futures were mixed overnight, but we did see opening gaps higher on our major indices
- Leadership today is coming from health care (XLV, +3.46%) and consumer stocks
- Discretionary (XLY, +1.85%) and staples (XLP, +1.57%) are both enjoying solid gains
- Biotechnology ($DJUSBT, +5.11%) and pharmas ($DJUSPR, +4.39%) after Moderna (MRNA, +144.80%) and Merck (MRK, +12.74%) announced a positive Stage 3 trial for a melanoma vaccine
- Meanwhile, cryptocurrencies are ripping higher; bitcoin ($BTCUSD, +5.52%) traded above 69000 for the first time since early June
- Commodities are mostly higher, including crude oil ($WTIC, +0.92%), which is near $86 per barrel
- The 10-year treasury yield ($TNX) is down 5 basis points to 4.65%, backing off after testing short-term yield resistance at 4.75% on Tuesday
- The FOMC minutes were released and indicative of a current Fed that is watching inflation developments very closely
- Estee Lauder (EL, +17.12%) trailed only MRNA on the S&P 500 leaderboard after posting strong quarterly results and raising its EPS guidance
Market Outlook
During today's Live Trading Room, I shared some proprietary research on the intraday trading behavior of consumer staples (XLP). My belief is that Wall Street rotates into defensive areas like the XLP prior to major market tops. So my research was simply to prove that point and, obviously, to develop a signal that we can use at EarningsBeats.com to alert us of approaching tops.
I used an intraday formula, ignoring gaps, to follow when money rotated heavily into the XLP over a 30-trading-day period. Not too surprisingly, some of the highest readings (most accumulation) occurred at or very near major market tops like in January 2022, February 2025, and February 2026. It's also important to note that money was rotating AWAY FROM the XLP in May/June 2022, when I had previously called a significant market bottom.
I have more work to do on this research, but I felt this was worth sharing with our entire membership. One question that came up during our Live Trading Room was.......where does this signal currently stand? It's almost squarely in neutral near zero, so there is no significant market top approaching right now - at least based on this current signal.
I'll keep everyone posted as my research and results are clearer.
Sectors/Industries
Last week, I discussed how energy (XLE) was approaching a key area of resistance. Well, that resistance has come and gone. The XLE has been on fire as many energy names push to higher and higher price levels. Check out this XLE chart from last week and how money has poured into the group to generate another key breakout:
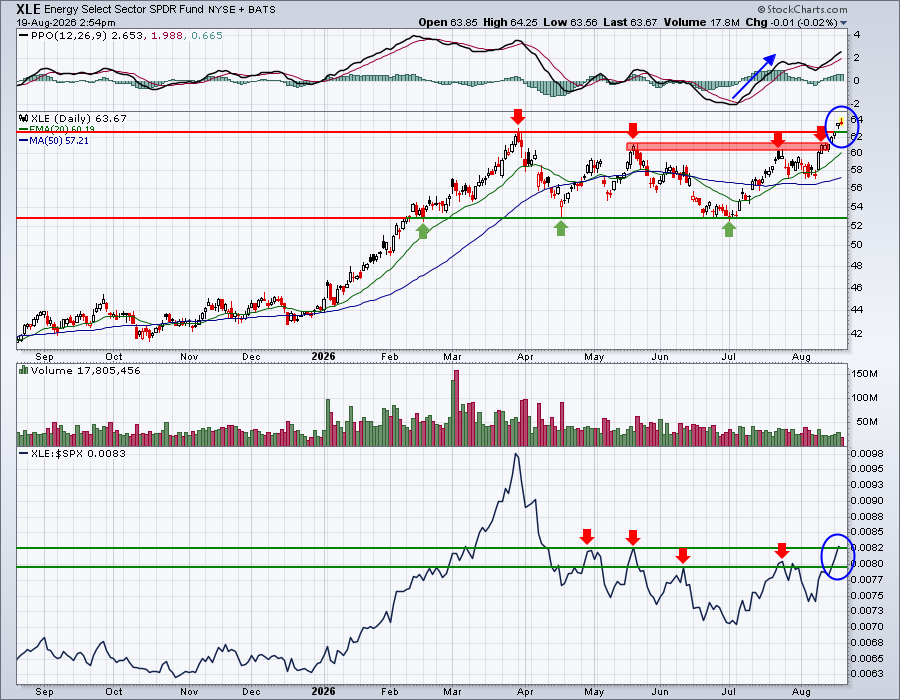
This is the same chart I showed in last week's DMR. The only thing I added were the two blue circles, highlighting the price breakout and also what appears like a potential relative strength breakout as well.
Energy stocks can be quite volatile as developments occur in the Middle East, but there's no denying the strength in the group right now.
ChartLists and Trading Strategies
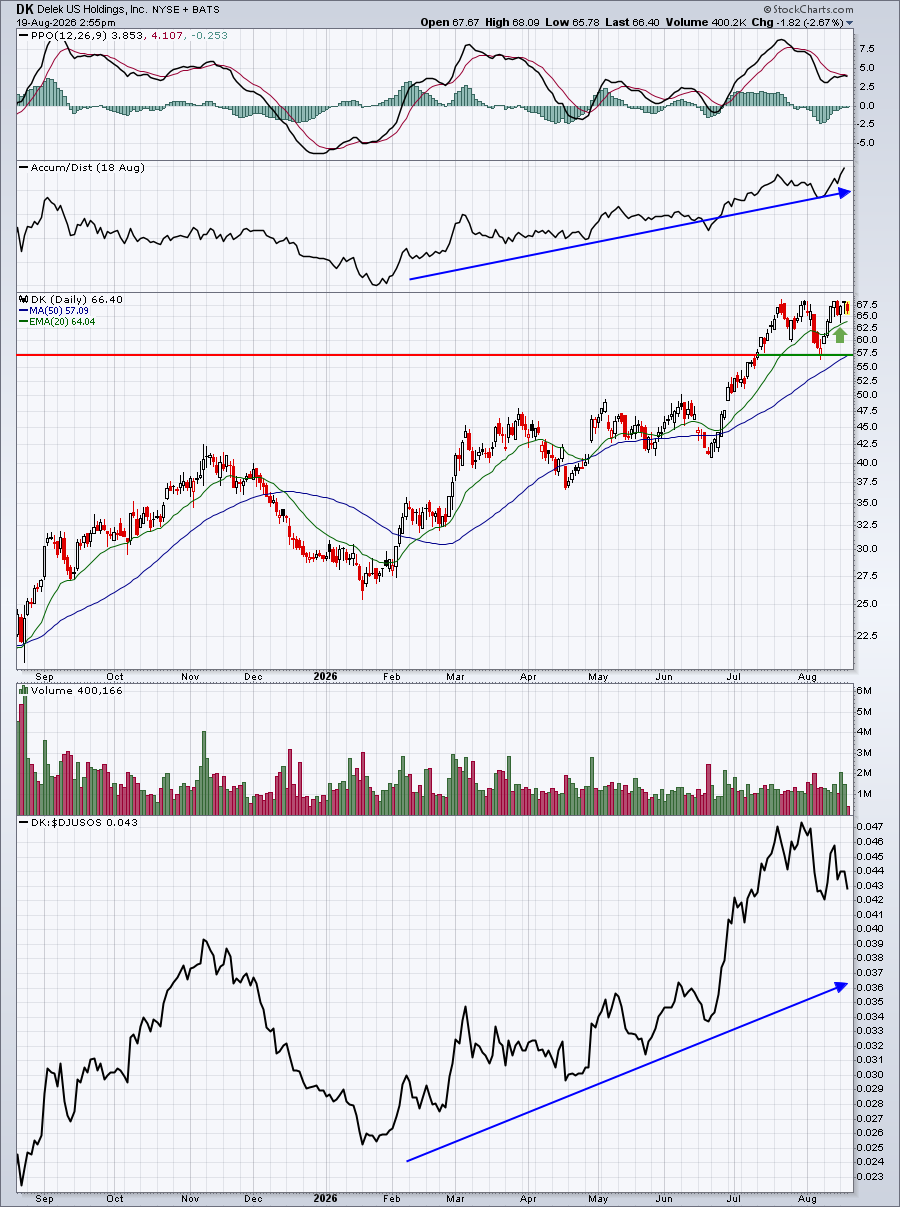
I don't worry as much about energy stocks during monthly options expiration week, because most of them aren't heavily traded on the options exchange. Rather, if I trade them, I do so based on their technical price action. Many energy stocks are breaking out and here are a few that look good to me from our ChartLists:
DK
NESR
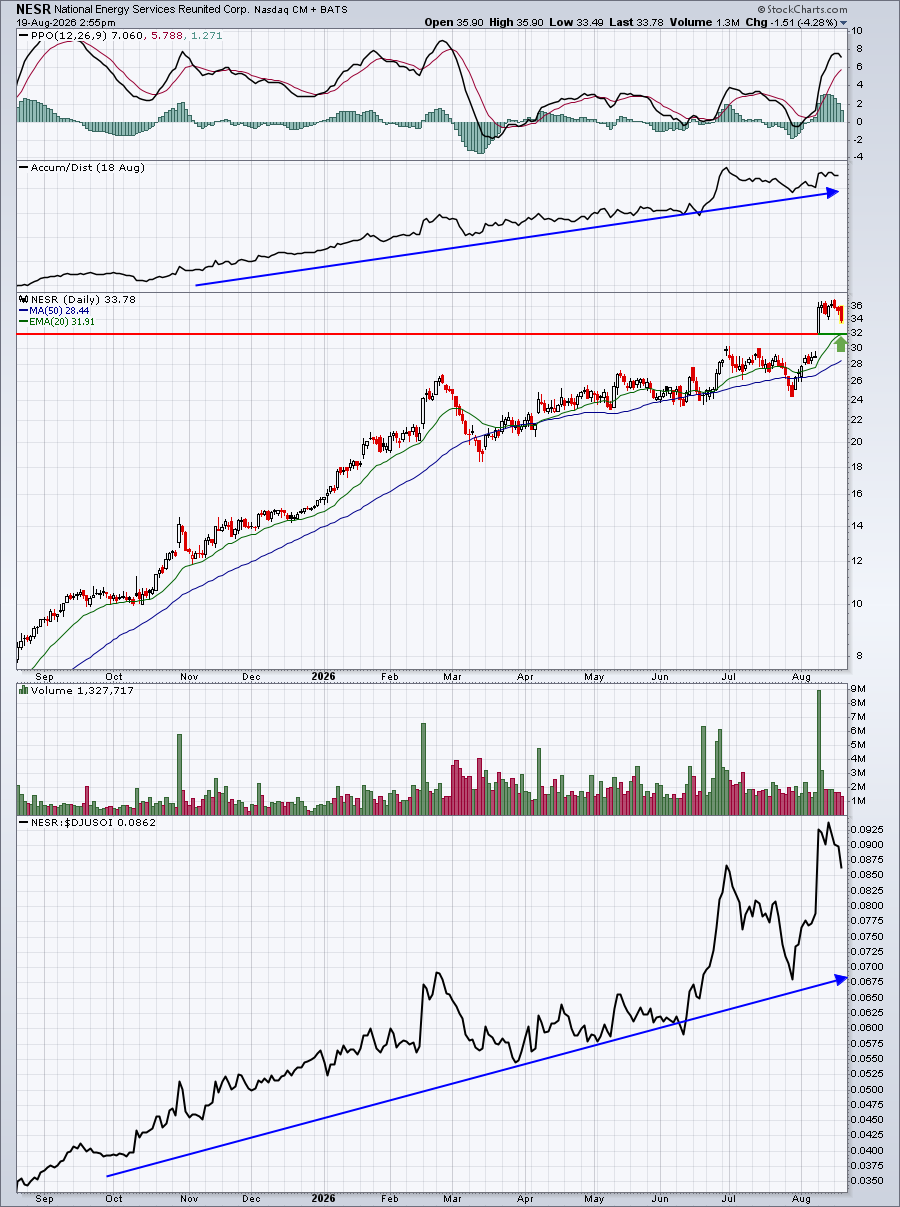
Both of these stocks come from our Strong Earnings ChartList (SECL) and both have excellent AD lines AND show strong relative strength. I like buying leading stocks after pullbacks. DK is closer to a breakout, which would be buyable if it occurs. However, my preference would be to catch it on a 20-day EMA test. NESR's 20-day EMA now coincides with the top of earnings-related gap support. That would be best entry there, in my opinion.
Upcoming Earnings
Upcoming Earnings and Upcoming Earnings Relative Strength ChartLists are now available on our website and we'll continue to track upcoming earnings reports and provide them to you via ChartLists throughout Q2 earnings season.
Economic Reports
FOMC minutes released at 2:00pm ET
Happy trading!
Tom