
EB Daily Market Report - Tuesday, August 25, 2026
Executive Summary
- Futures were higher overnight and our major indices gapped higher
- The 10-year treasury yield ($TNX) is retreating for a 2nd straight day, falling 6 basis points to 4.64%
- Crude oil ($WTIC, -3.41%) is approaching $82 per barrel as energy shares (XLE, -0.80%) lag, along with consumer staples (XLP, -1.17%)
- Meanwhile, technology (XLK, +0.67%) and communication services (XLC, +0.53%) are showing relative strength
- Aluminum ($DJUSAL, +2.23%) is today's leading industry group
- Earlier, bitcoin ($BTCUSD, -0.07%) hit 81,218, nearly testing its May high, before reversing; other cryptos are mixed
- Moderna (MRNA, +13.14%) is jumping again to 157, though its key resistance is now 174.38
- NVIDIA Corp (NVDA, +1.72%) is rising slightly ahead of its quarterly earnings report, which will be released on Wednesday after the closing bell
- There will be a number of key earnings released tomorrow including CrowdStrike (CRWD, -2.51%), Salesforce.com (CRM, -1.43%), Synopsys (SNPS, +2.55%), and Veeva Systems (VEEV, -1.32%)
Market Outlook
Last week in our Wednesday DMR, I indicated that I was researching a new market signal based on the intraday trading of consumer staples (XLP) over a 30-trading-day period. I've actually taken those 30-day values and put them in a User-Defined Index (UDI) at StockCharts.com. I use the 100 value as a "centerline" of sorts, where there's no significant intraday accumulation or distribution of the XLP. Historically, based on the data analyzed, a reading of 106 or higher becomes quite significant and suggests that caution be advised regarding the S&P 500. On the opposite end of the spectrum, a reading of 94 or lower would indicate significant distribution of the XLP and should be considered as a bullish signal. I started this analysis in November 2021, so the first 30-trading-day reading actually occurred on January 4, 2022, which is where this chart begins:
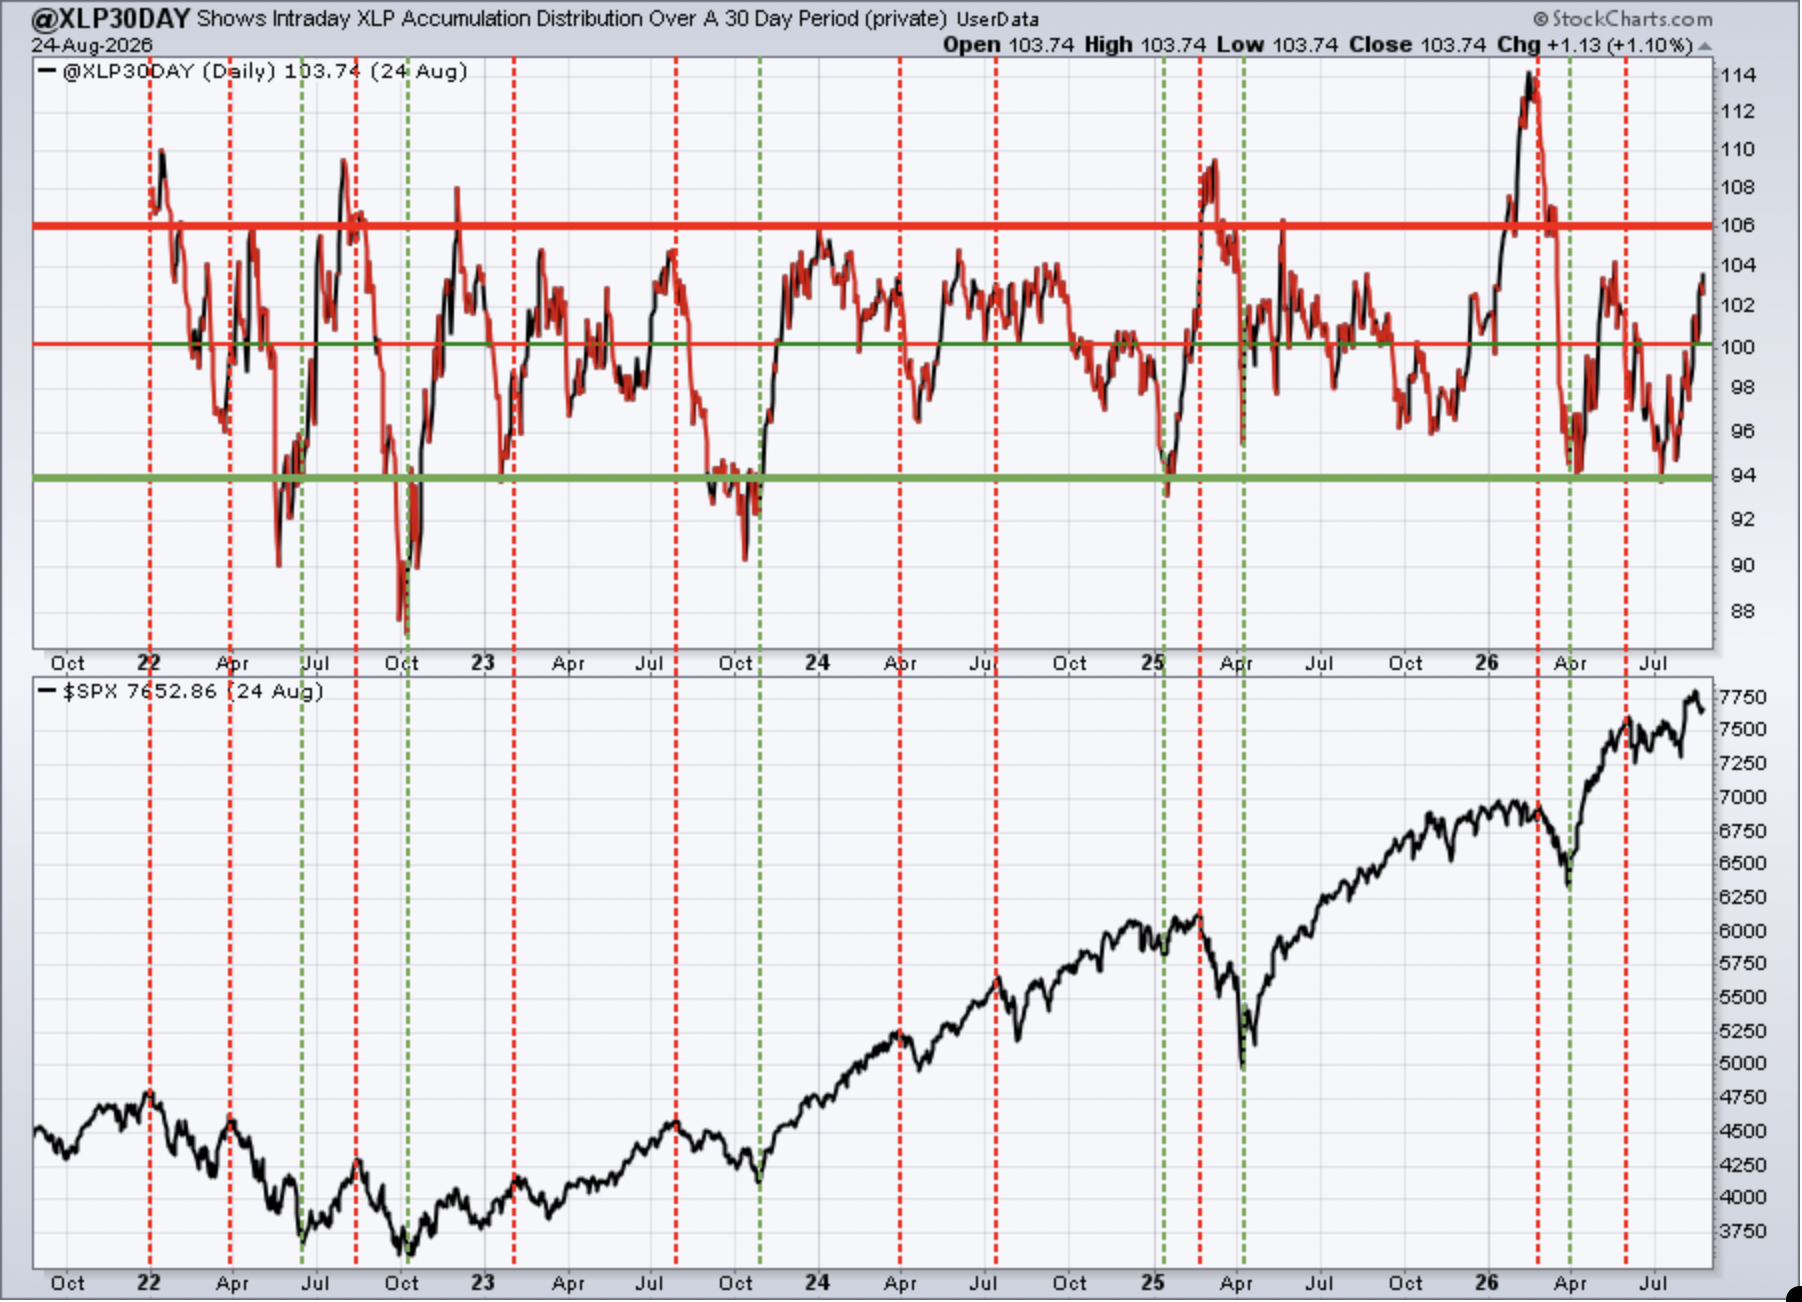
There are 10 red-dotted vertical lines that coincide with the most significant S&P 500 tops over the past 5 years. The largest ensuing drops occurred at or just after this signal moved above 106.
Meanwhile, there are 6 green-dotted vertical lines that coincide with significant bottoms in the S&P 500. EVERY one of them saw a signal reading of 94 or below. In other words, during a significant selloff, we probably don't want to consider a major market bottom until the distribution in the XLP reaches that 94 level on a 30-trading-day basis.
It's an interesting study to say the least and it's, quite honestly, what I expected to find when I began the study. I'm a firm believer that major market declines do not happen randomly. The big Wall Street firms KNOW it's about to go down and position accordingly.
Currently, this reading is on the rise and at 103.74 as of Monday's close. An upcoming reading at 106+ with September on the horizon would be an ominous sign for short-term traders. Again, I'm not bearish long-term and I believe any selling, if it does occur, will be short-term in nature and that we'll likely see new all-time highs later in the year - or at least a rally.
Sectors/Industries
Technology (XLK) is leading U.S. stocks higher today, and there's no questioning their leadership in 2026. However, if we use a bit of perspective, it wouldn't be a horrible thing for the group to pause and regroup before a possible push higher into year end. Below is a 5-year weekly chart that highlights a key support area if the group does weaken in September:
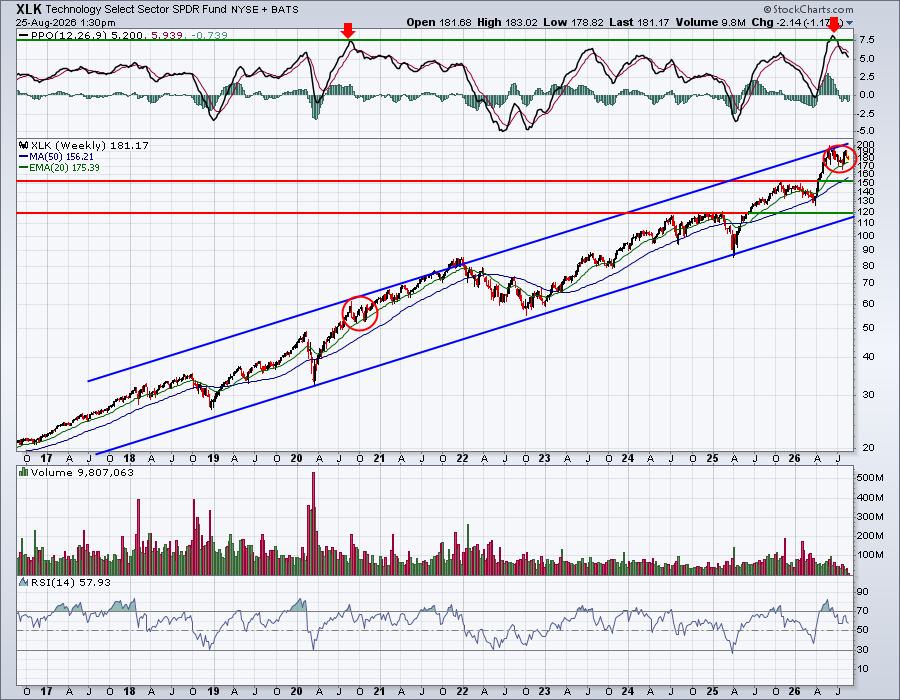
We seem to be following the pattern we saw back in 2020. We had a huge rally off of a significant March low and proceeded to struggle (red circles) after peaking in the summer months. The selling back in 2020 may not look like much, but the XLK fell from a high near 61 to a low a few weeks later just above 52. That represented a quick 14-15% decline. In 2026, the XLK topped at 198.49 in June and reached a low of 166.46 the very next month. That represented a drop of approximately 16%, similar to the 2020 decline.
Technology still represents more than 36% of the S&P 500, so how goes technology is likely how goes the S&P 500. If selling in the XLK accelerates in September, then we could see a 10% correction on the S&P 500 back to 7000. At this point, I'd say the odds do NOT favor that, but things can change, which is why we watch the signals that we watch.
ChartLists and Trading Strategies
When you pull up a ChartList at StockCharts.com in "Summary" form, you can select the columns that you want to show. One choice is RSI, so I can go to our Bullish Trifecta ChartList (BTCL), which currently has 85 companies on it, and sort them by RSI reading, lowest to highest. The BTCL is one of my favorite ChartLists to trade off of, because it combines the elements of the Strong Earnings, Raised Guidance, and Strong AD ChartLists, including only companies that appear on each of these 3 key ChartLists. So it really narrows down my focus. Here's how that BTCL looks if sorted by lowest RSI to highest:
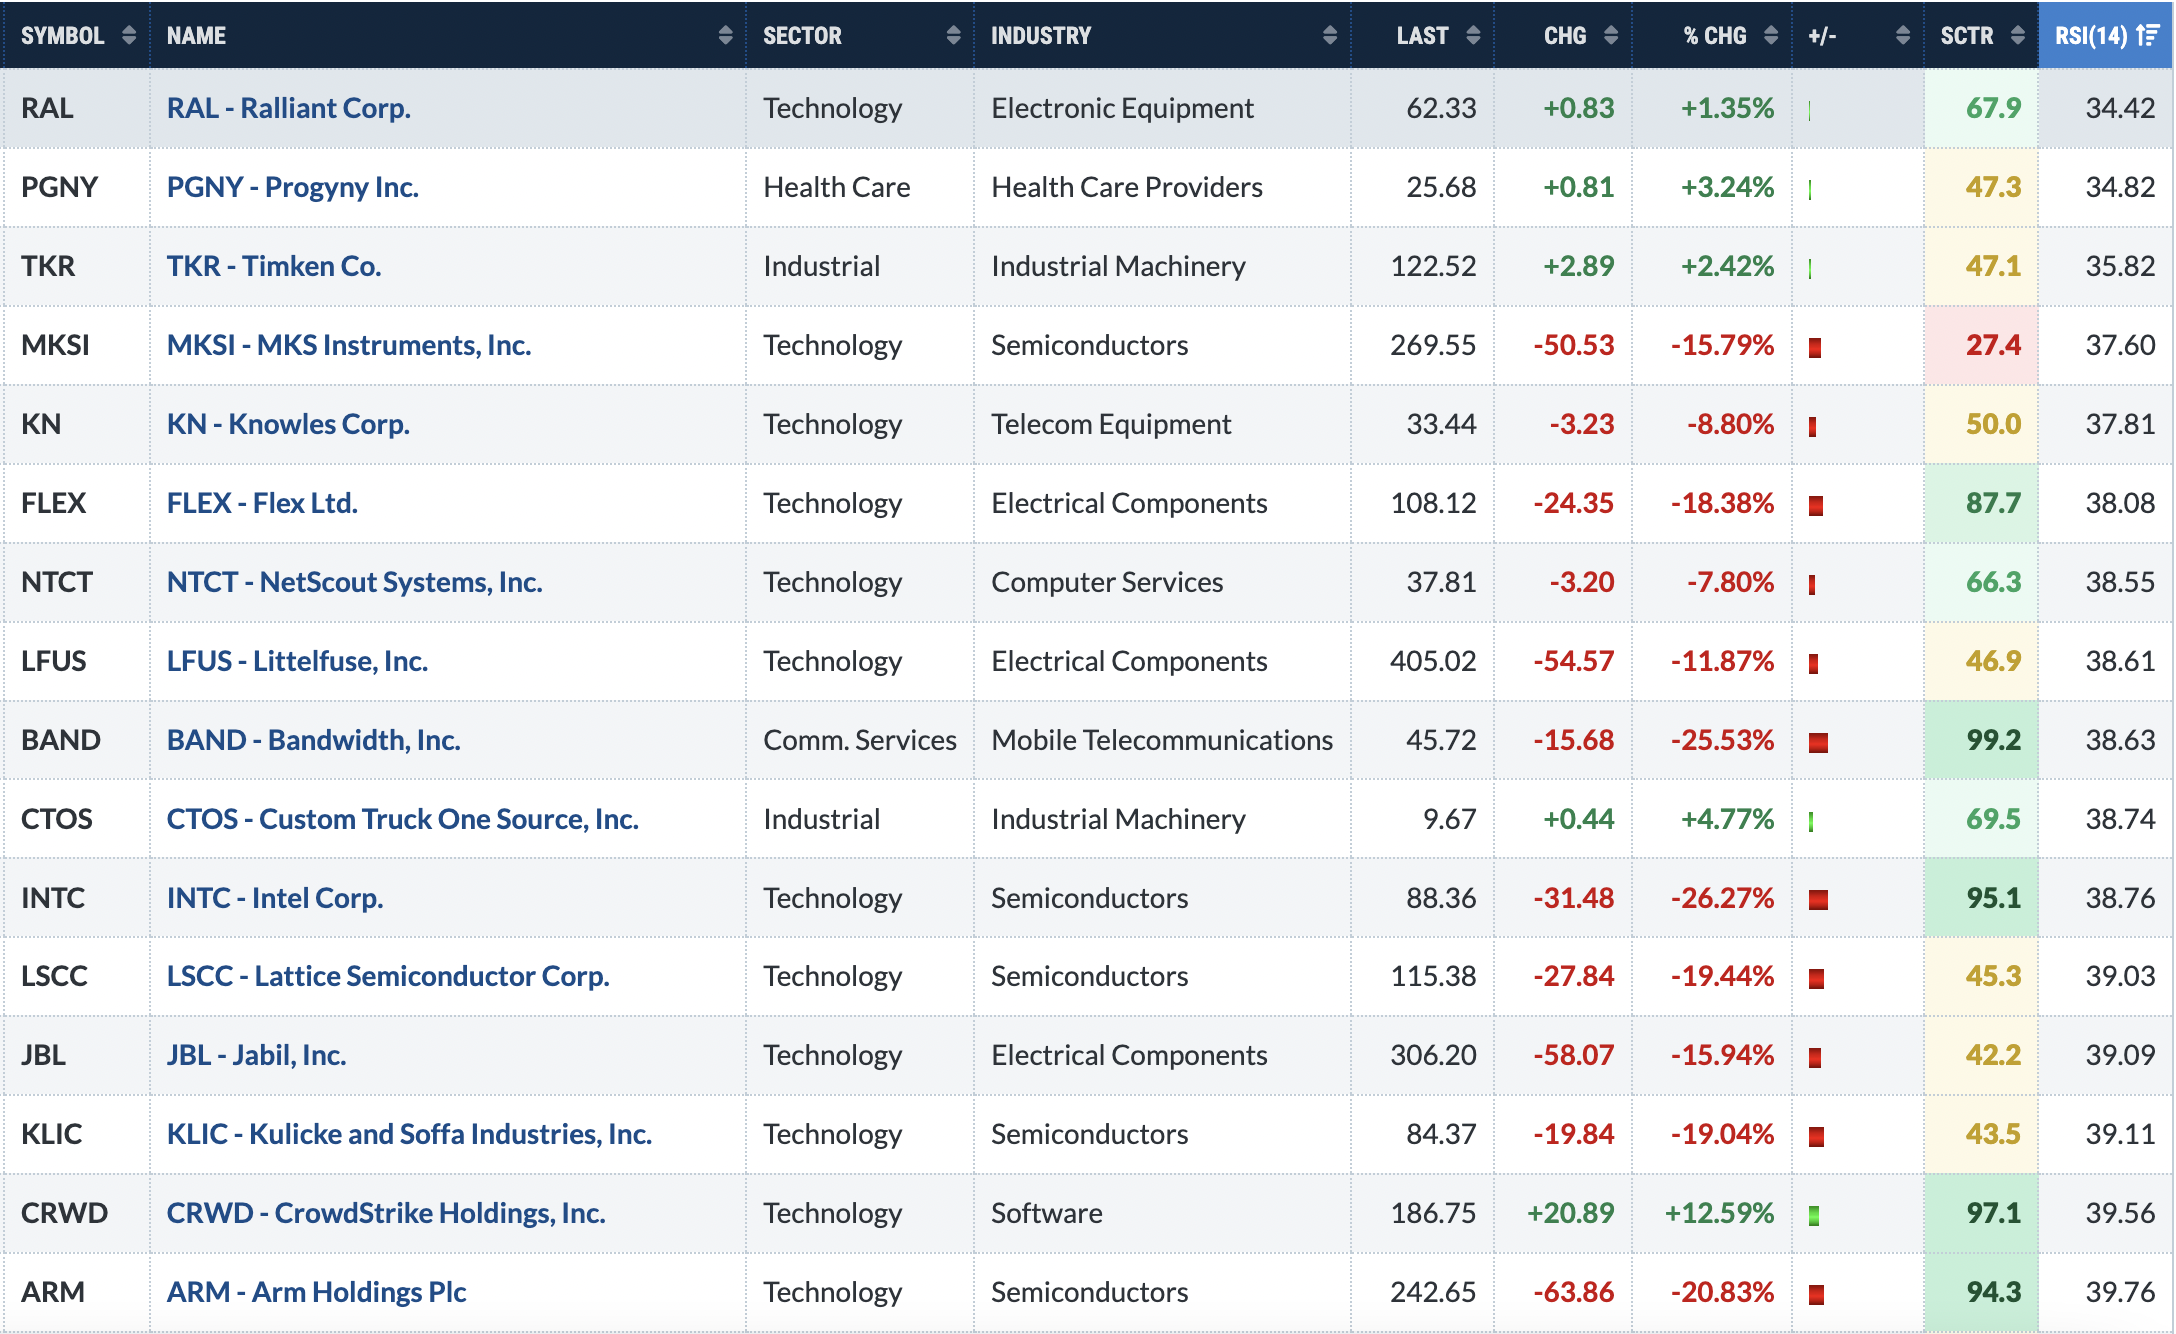
An RSI reading below 50 is typically a good time to look at charts of uptrending stocks to see if there are corroborating indicators suggesting entry. You can see there are a lot of technology stocks on this list, but there are stocks in other sectors, if you want to steer clear of technology for now.
For instance, check out Progyny, Inc. (PGNY), a health care provider ($DJUSHP) and Timken Co. (TKR), an industrial machinery company ($DJUSFE):
PGNY:
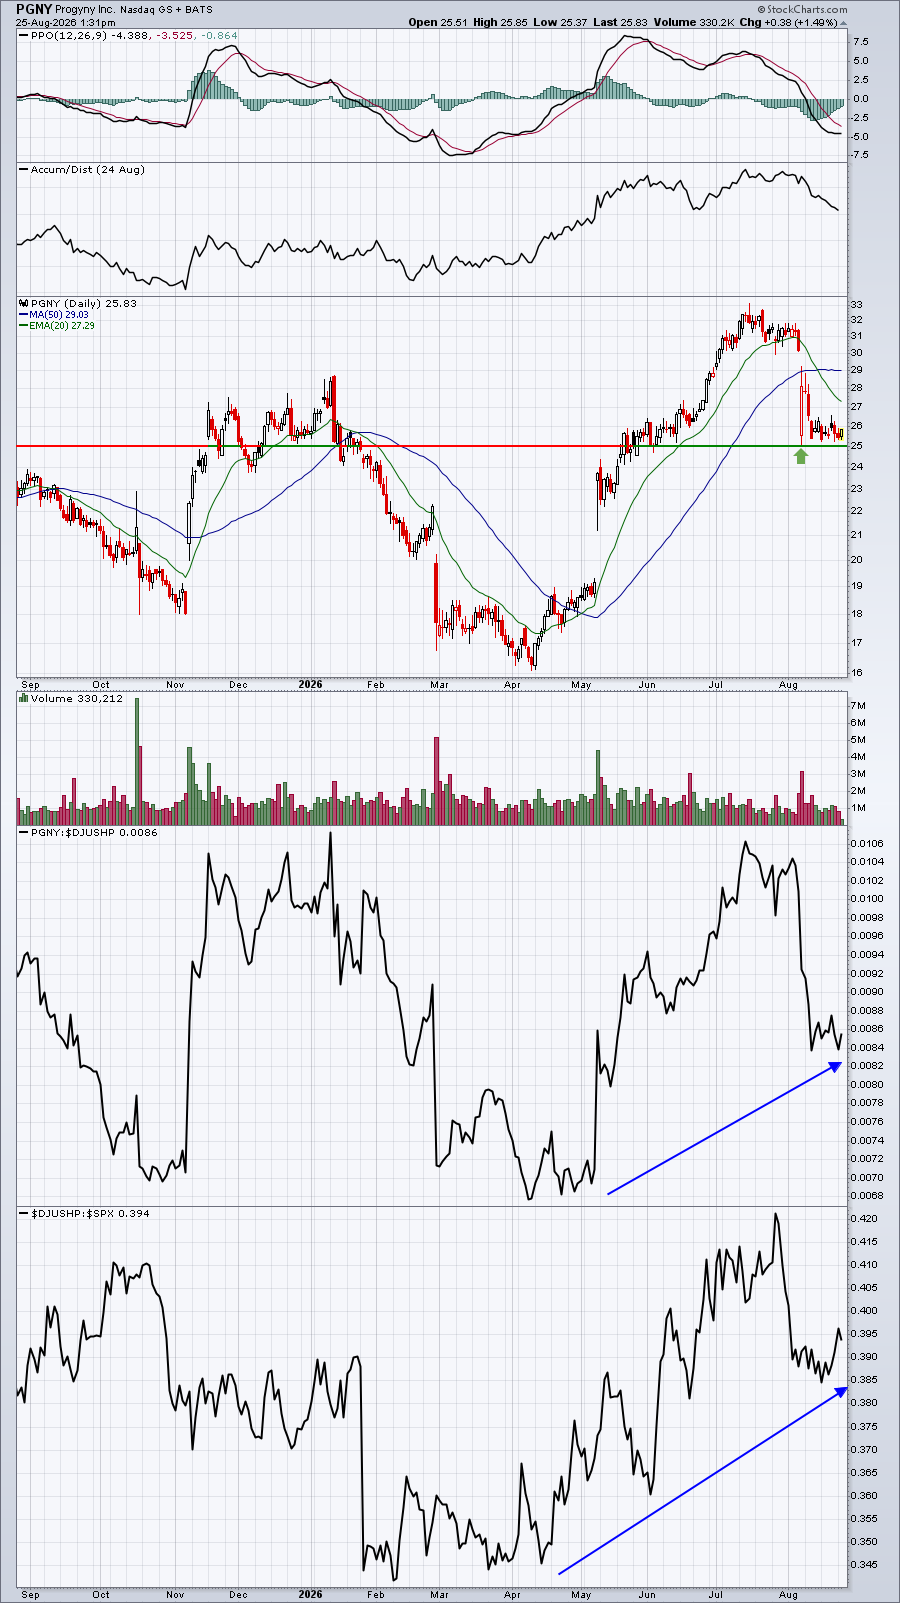
I like the relative strength of health care providers. I see that as a big positive here. Also, when PGNY gapped down with its earnings results in early August, buyers were lined up and we saw a massive hollow candle print. That indicates a lot of buying interest near the 25.00 level. I'm expecting PGNY to bounce from here and, if it doesn't, a fairly tight stop could be used. There are definitely other health care providers that are currently performing better, but given the group's strength, I believe support holds here. We'll see.
TKR:
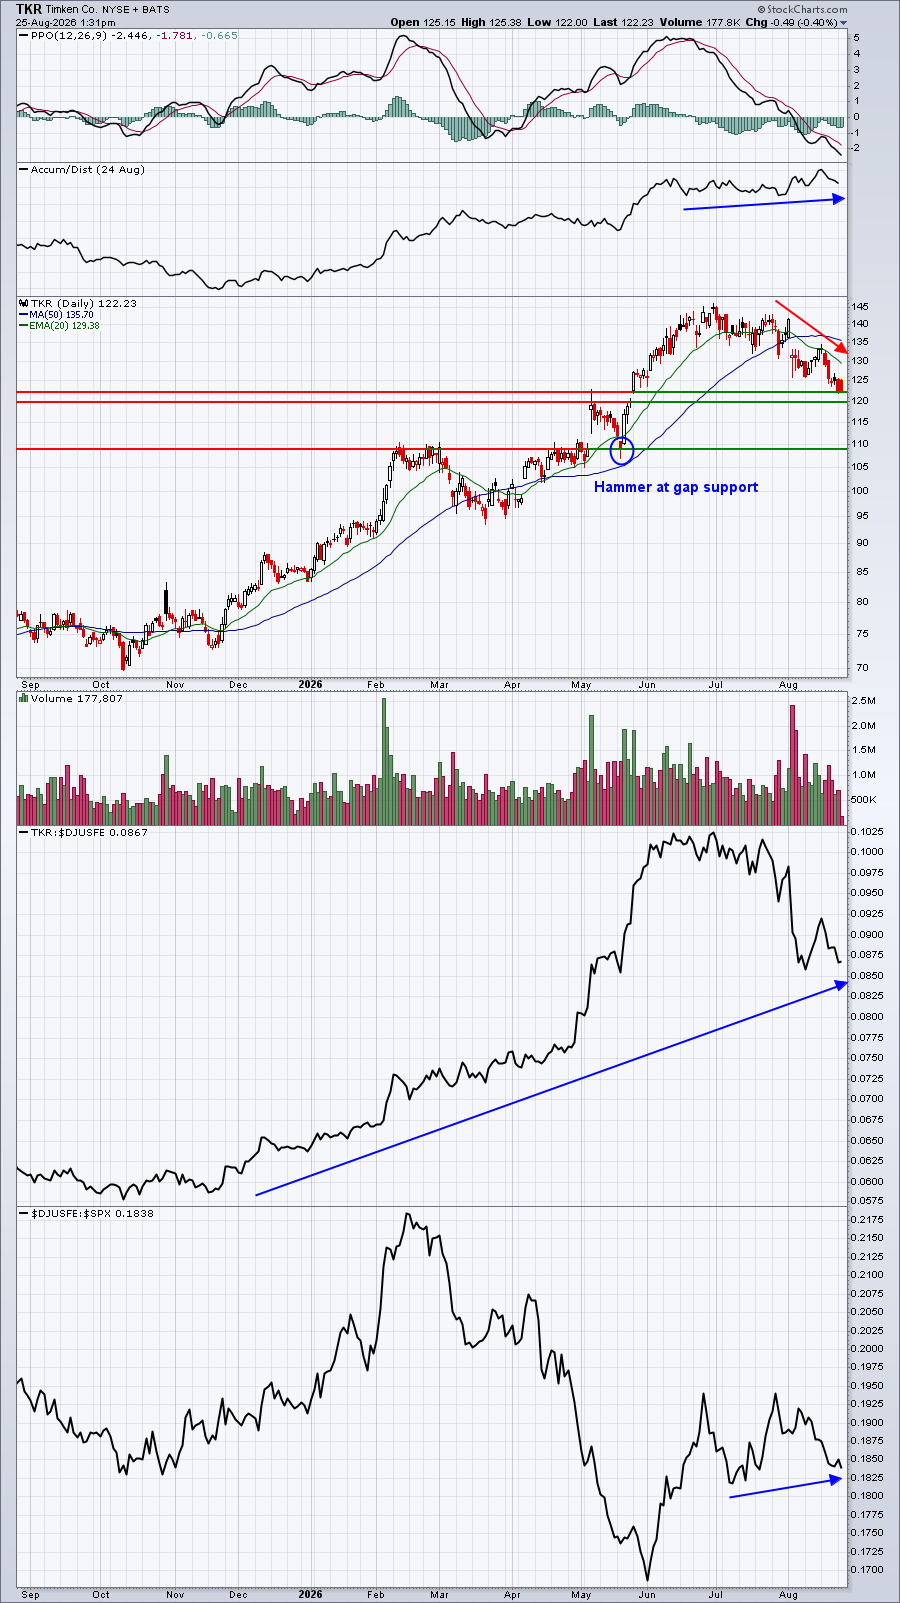
TKR is clearly downtrending and it's below its 20-day EMA, which is also below its 50-day SMA. This is not a great look and I admit that. However, TKR showed tremendous relative strength vs. its peers at its recent high and is likely going through some sort of short-term profit taking before a significant bottom is found. I like the price and gap support area around 120-122 as a potential turnaround level. Note the hammer that printed at gap support back in May. A similar reversing candle in this 120-122 range could be an argument for a trading position with a tight stop.
TKR easily surpassed both revenue and EPS estimates back on August 4th and then proceeded to raise both its revenue and EPS guidance. The fundamentals appear quite strong and now TKR has pulled back with an RSI at its lowest level in 11 months. I'm just waiting for the right set up, but I'd keep this one on your radar.
Upcoming Earnings
Upcoming Earnings and Upcoming Earnings Relative Strength ChartLists are now available on our website and we'll continue to track upcoming earnings reports and provide them to you via ChartLists throughout Q2 earnings season.
Economic Reports
June Case-Shiller home price index: +0.5% (actual) vs. +0.1% (estimate)
July new home sales: 607,000 (actual) vs. 615,000 (estimate)
Happy trading!
Tom