
EB Daily Market Report - Wednesday, August 26, 2026
Executive Summary
- Futures were mixed overnight and all of our major indices opened fairly close to the flat line
- We saw initial strength in the first half hour, but then selling kicked in
- After an afternoon rally, the majority of key indices and sectors have turned positive
- Technology (XLK, +0.84%) is back on top today with software ($DJUSSW, +0.99%) strengthening into a few key earnings reports after the bell
- Crowdstrike Holdings (CRWD, +2.99%), Salesforce.com (CRM, +0.00%), and Veeva Systems (VEEV, -0.02%) will all report after the bell
- NVIDIA Corp (NVDA, -0.97%) is the truly big report, however, and will likely have a significant impact on trading on Thursday
- Cryptocurrencies are seeing some profit taking with XRP down close to 6%
- Commodities are mostly lower with crude oil ($WTIC, -0.40%) hovering just above $82 per barrel
- The 10-year treasury yield ($TNX) gained 2 basis points to 4.66% after the Core PCE came in slightly higher than expected (+0.2% vs +0.1%)
Market Outlook
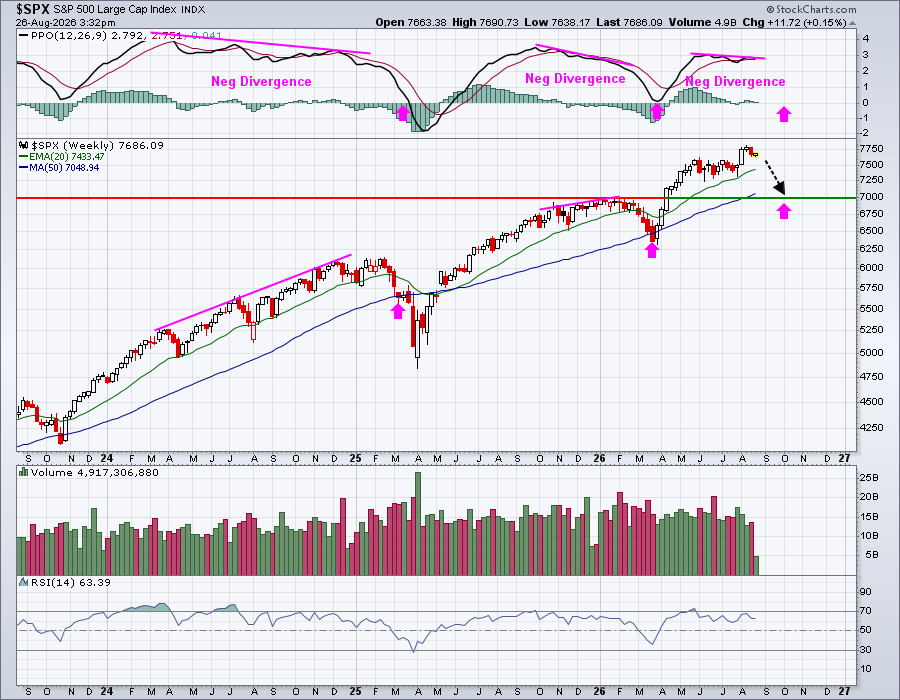
There are slight negative divergences on the weekly chart of both the S&P 500 and the small cap Russell 2000 (IWM), which argue for potential September weakness. Negative divergences, many times, will result in losses of 20-period EMA support and movement instead down towards 50-period SMA support. This is what that would like on both of these key indices:
S&P 500:
Russell 2000:
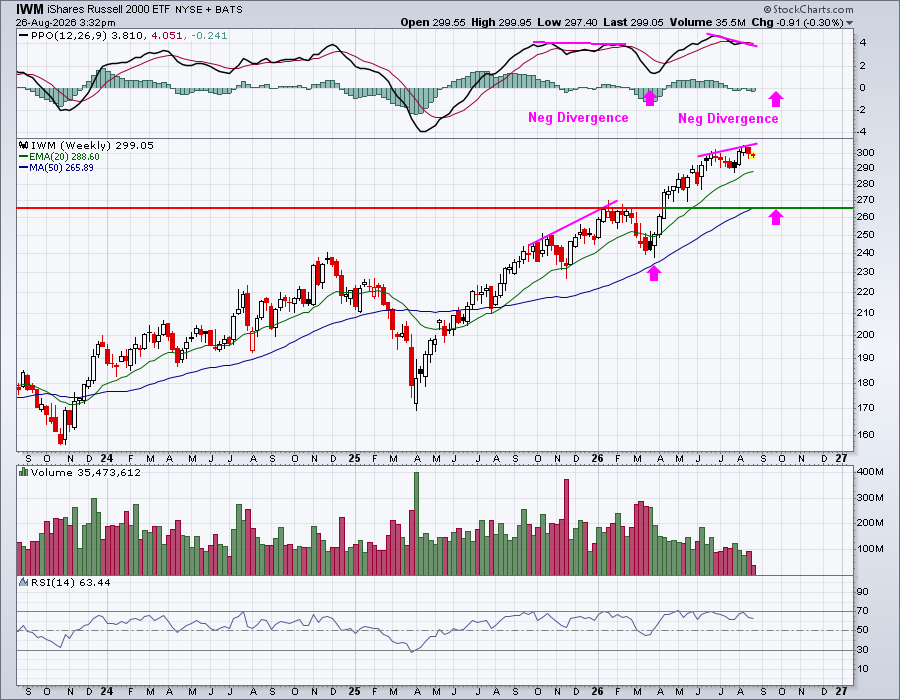
The pink arrows highlight previous PPO centerline tests and/or 50-week SMA tests. I've also provided pink arrows that show where a potential decline could end in September (or possibly October). The purpose of these charts is NOT to guarantee a market decline, but rather to lay out one possibility as we head into the historically-bearish month of September.
You can absolutely remain 100% long here, and I'd be in favor of that, especially if you're a long-term investor. I do not see enough bearish signals to move to cash from a long-term perspective. However, I would suggest considering a move to cash (or more to cash) as a short-term trader IF we begin to see technical deterioration of our major indices. Examples would include failure to hold 20-day EMAs for multiple consecutive days and/or loss of key price support like 7610 on the S&P 500.
Smaller position sizes this time of year make more sense to me as well. Also, consider trading more outside the usual technology suspects. We need to gain some clarity as to technology stocks, especially semiconductors ($DJUSSC), before becoming overly aggressive. There is plenty of strength in other sectors, particularly energy, materials, and health care.
Sectors/Industries
Consumer discretionary (XLY) has obviously been weaker than I'd like. When discretionary stocks are performing well, it's generally a very bullish signal regarding the S&P 500. Unfortunately, there are too many industry groups within this sector that just can't seem to get going.
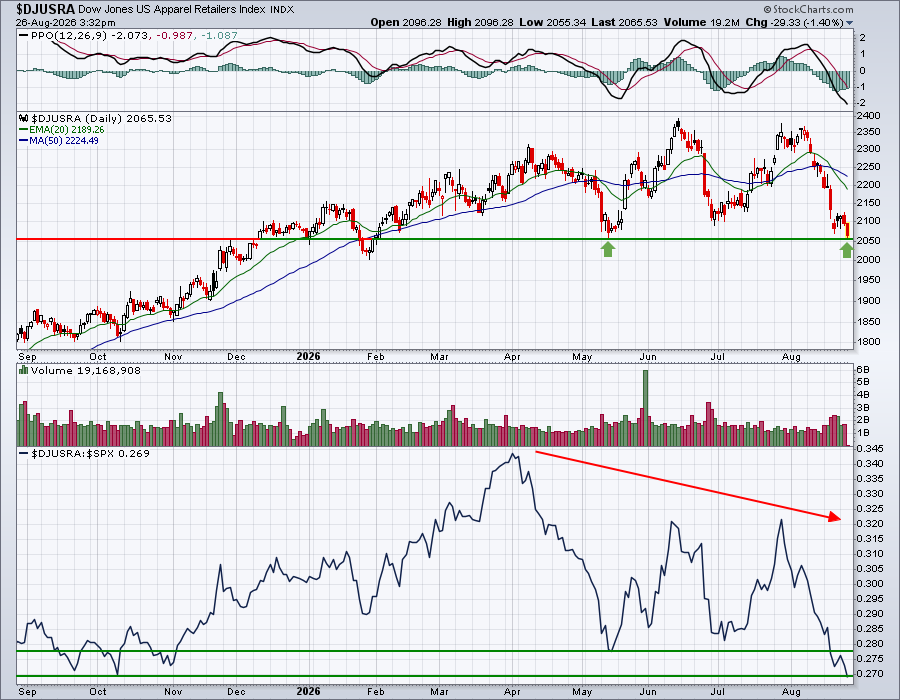
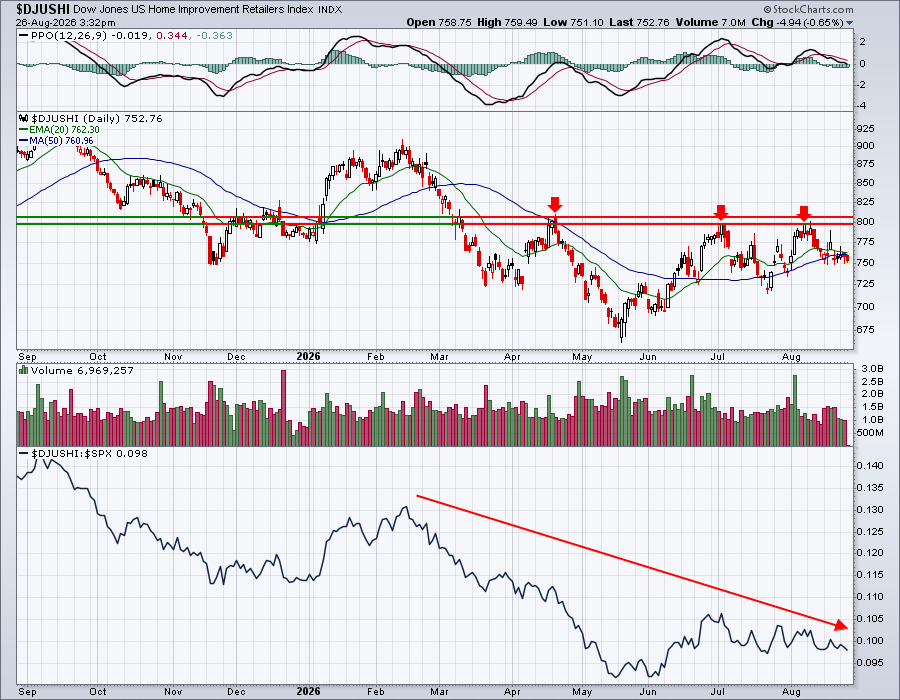
Two industries at key pivot points right now are apparel retailers ($DJUSRA) and home improvement retailers ($DJUSHI). Both are relative laggards, compared to the S&P 500, but the former is challenging key support, while the latter is closer to key resistance:
DJUSRA:
DJUSHI:
Before the XLY can begin to repair itself technically, it's going to need to see more bullishness out of more of its industry groups, on both an absolute and relative basis.
ChartLists and Trading Strategies
I like trading stocks with bullish patterns as patterns can provide us measurements and, thus, targets. From the Raised Guidance ChartList (RGCL), Hinge Health (HNGE) raised its guidance on August 5th, significantly raising its revenue guidance. The company lifted its fiscal year revenues by nearly 5% and that started the right side of a bullish cup:
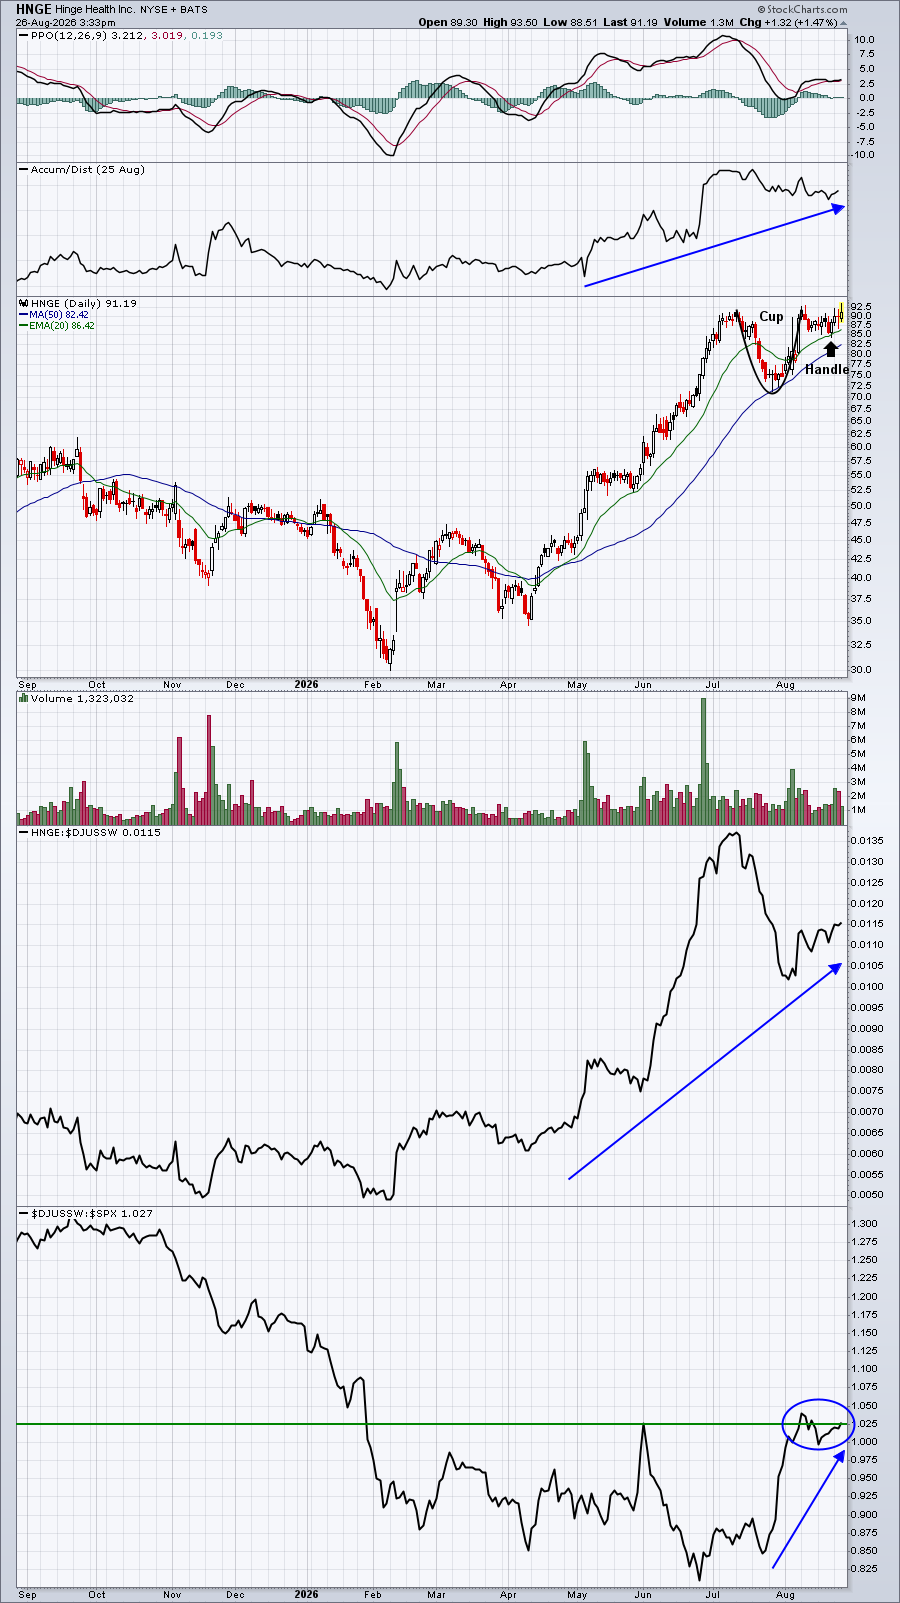
The depth of the cup (92 minus 72, or 20) is the measurement. On a breakout above 92, the measurement of 20 is added to set an initial target at 112. I can use a close beneath the 20-day EMA as a stop, risking about 6.00, while looking to make 20.00. That's more than a 3 to 1 reward-to-risk ratio. Buying HNGE on the 20-day EMA is the best strategy, minimizing the risk and increasing the potential return.
HNGE is a leading stock in the improving software industry ($DJUSSW). Another relative breakout by the DJUSSW in the bottom panel would provide me much more confidence in the trade and is one thing I'd look for.
Upcoming Earnings
Upcoming Earnings and Upcoming Earnings Relative Strength ChartLists are now available on our website and we'll continue to track upcoming earnings reports and provide them to you via ChartLists throughout Q2 earnings season.
Economic Reports
July durable goods: +1.1% (actual) vs. +0.5% (estimate)
Q2 GDP (2nd estimate): 1.5% (actual) vs. 1.5% (estimate)
July personal income: +0.4% (actual) vs. +0.2% (estimate)
July personal spending: +0.2% (actual) vs. +0.1% (estimate)
July Core PCE: +0.2% (actual) vs. +0.1% (estimate)
Happy trading!
Tom