
EB Daily Market Report - Special Report - Tuesday, September 1, 2026
I wanted to reach out to all of our EarningsBeats.com members to relay my findings after expanding my XLP research back to 1999. After recently releasing my research over the past couple years, many members asked if the solid signals provided by the cumulative 30-day XLP signal also rang true at previous market tops.
So I expanded my research back to 1999, when the sector ETFs first began trading. The results are rather amazing. In order to more clearly see previous signals and their success/failure, I've broken down the XLP cumulative chart into 6 separate periods, as follows:
June 30, 1999 - December 31, 2003
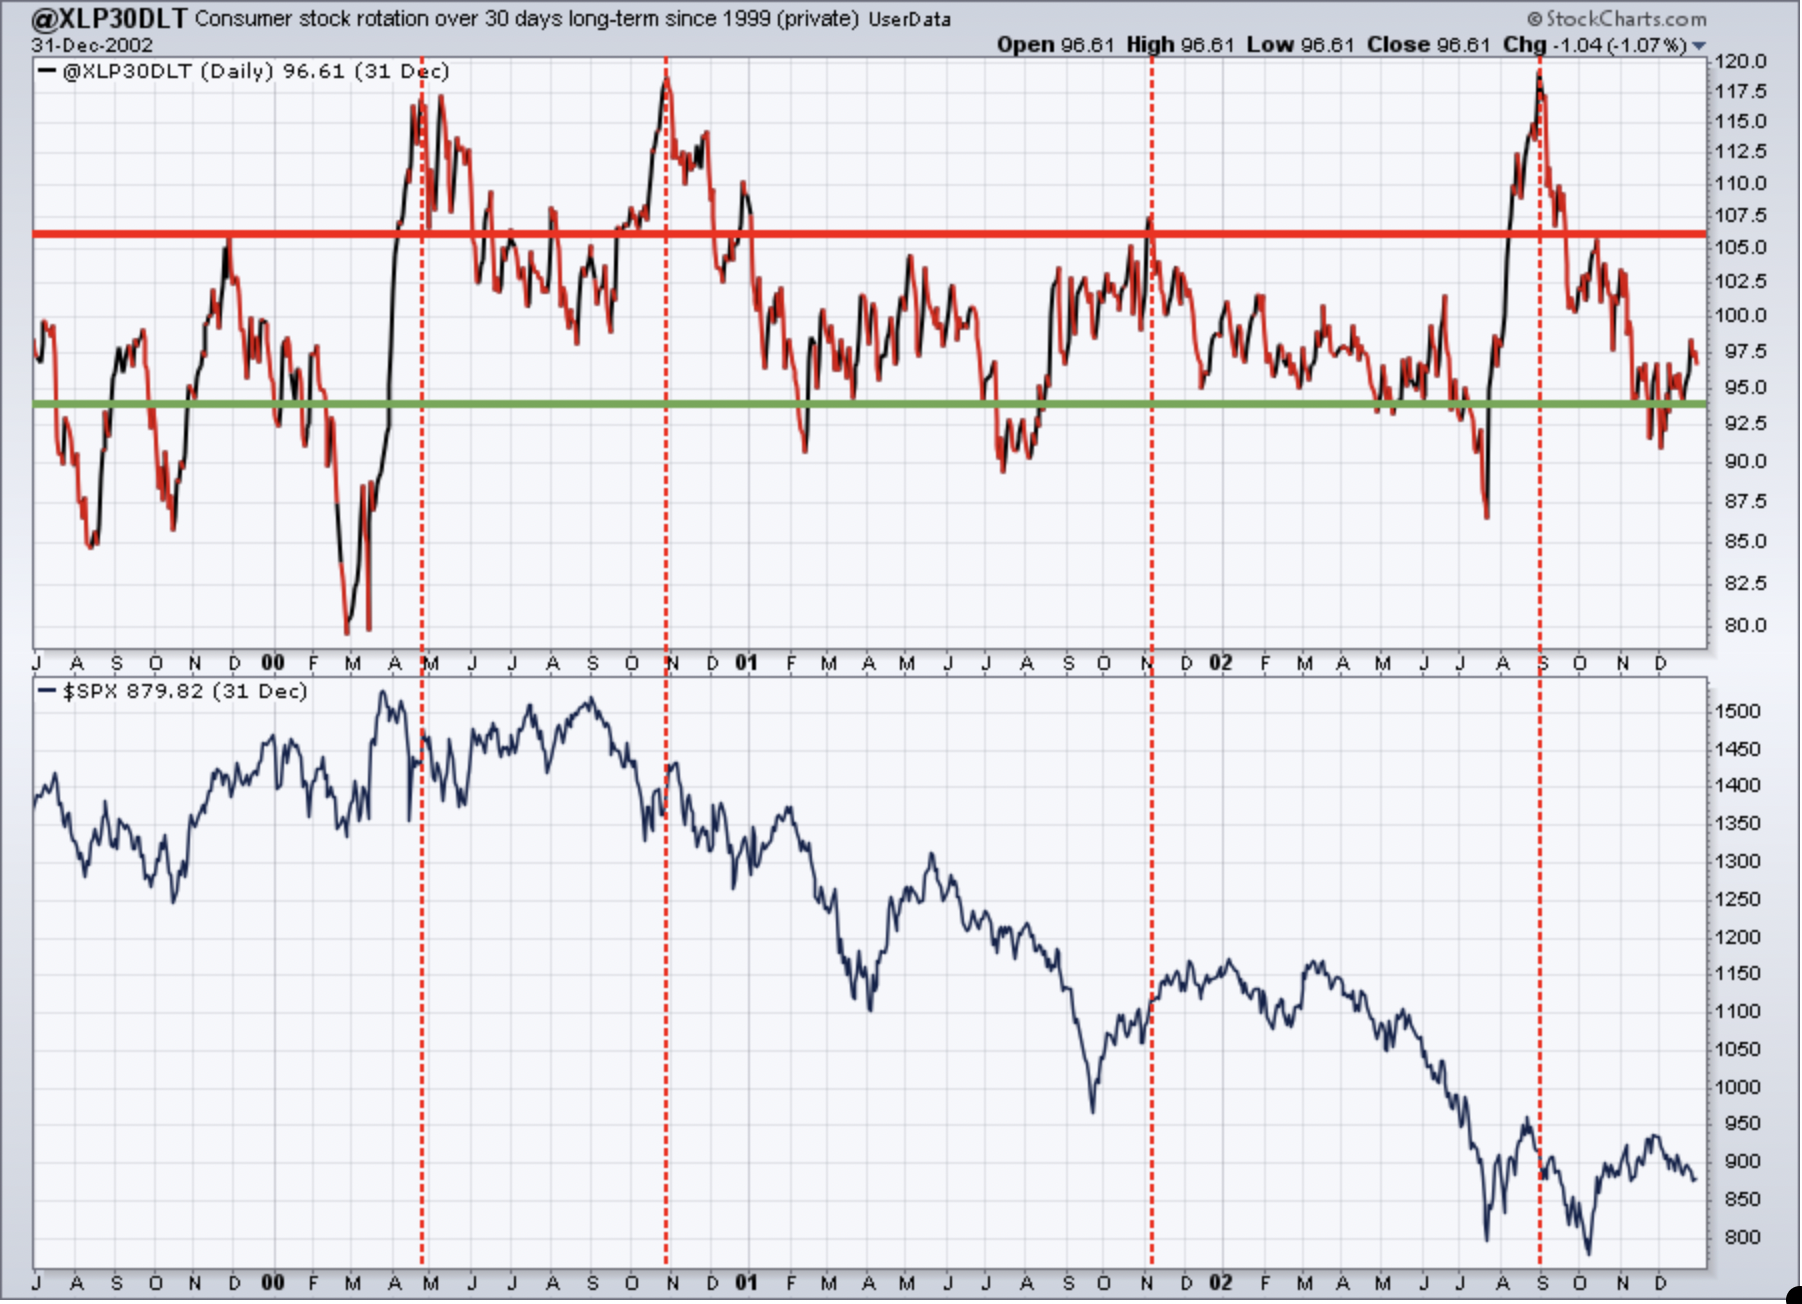
Some of the most significant accumulation in the XLP occurred during year 2000, just prior to one of the most significant market tops in U.S. history. Money poured into the XLP intraday in the 30 days leading to May and November. Wall Street "luckily" (sarcasm) got it right just before one of the biggest S&P 500 declines in my lifetime.
It's also interesting that one of the lowest readings of this period occurred in late-July 2002, coinciding with the first of two fairly-equal lows that marked the bottom of the first part of the secular bear market. Wall Street "luckily" saw the bottom forming as well as the top.
January 1, 2004 - December 31, 2008
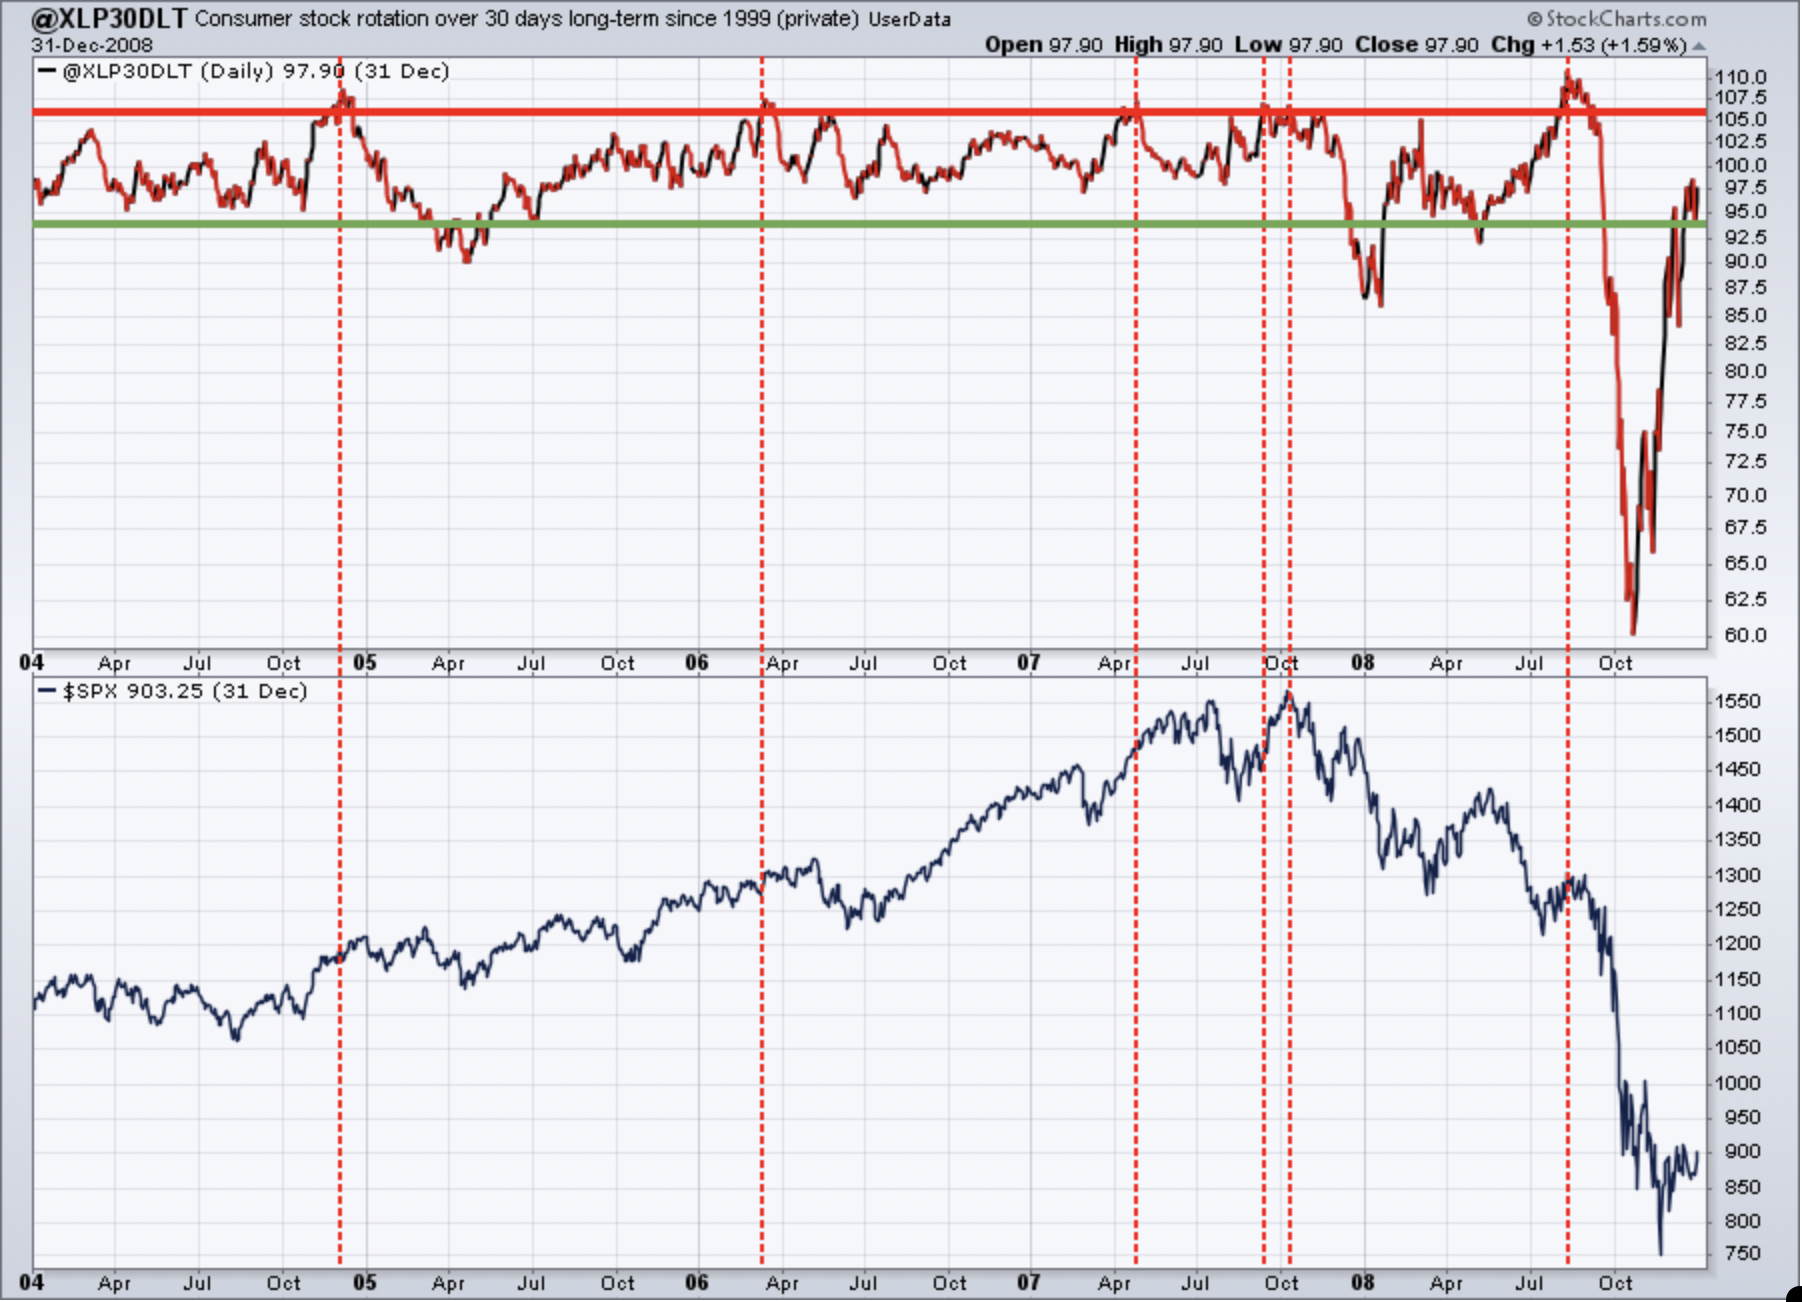
Well, we didn't see the crazy rotation into consumer staples prior to the second major selloff of the 2000-2012 secular bear market. But it was still formidable as readings topped the key 106 level on at least 3 different occasions from April through October. The major top occurred in the second week of October.
We did see a bit of rotation into staples during Q4 2024 and Q1 2006 with readings approaching 109, prior to some weakness, though I wouldn't say those signals were overly powerful. Still, the market did struggle a bit after each of these high readings.
January 1, 2009 - December 31, 2013
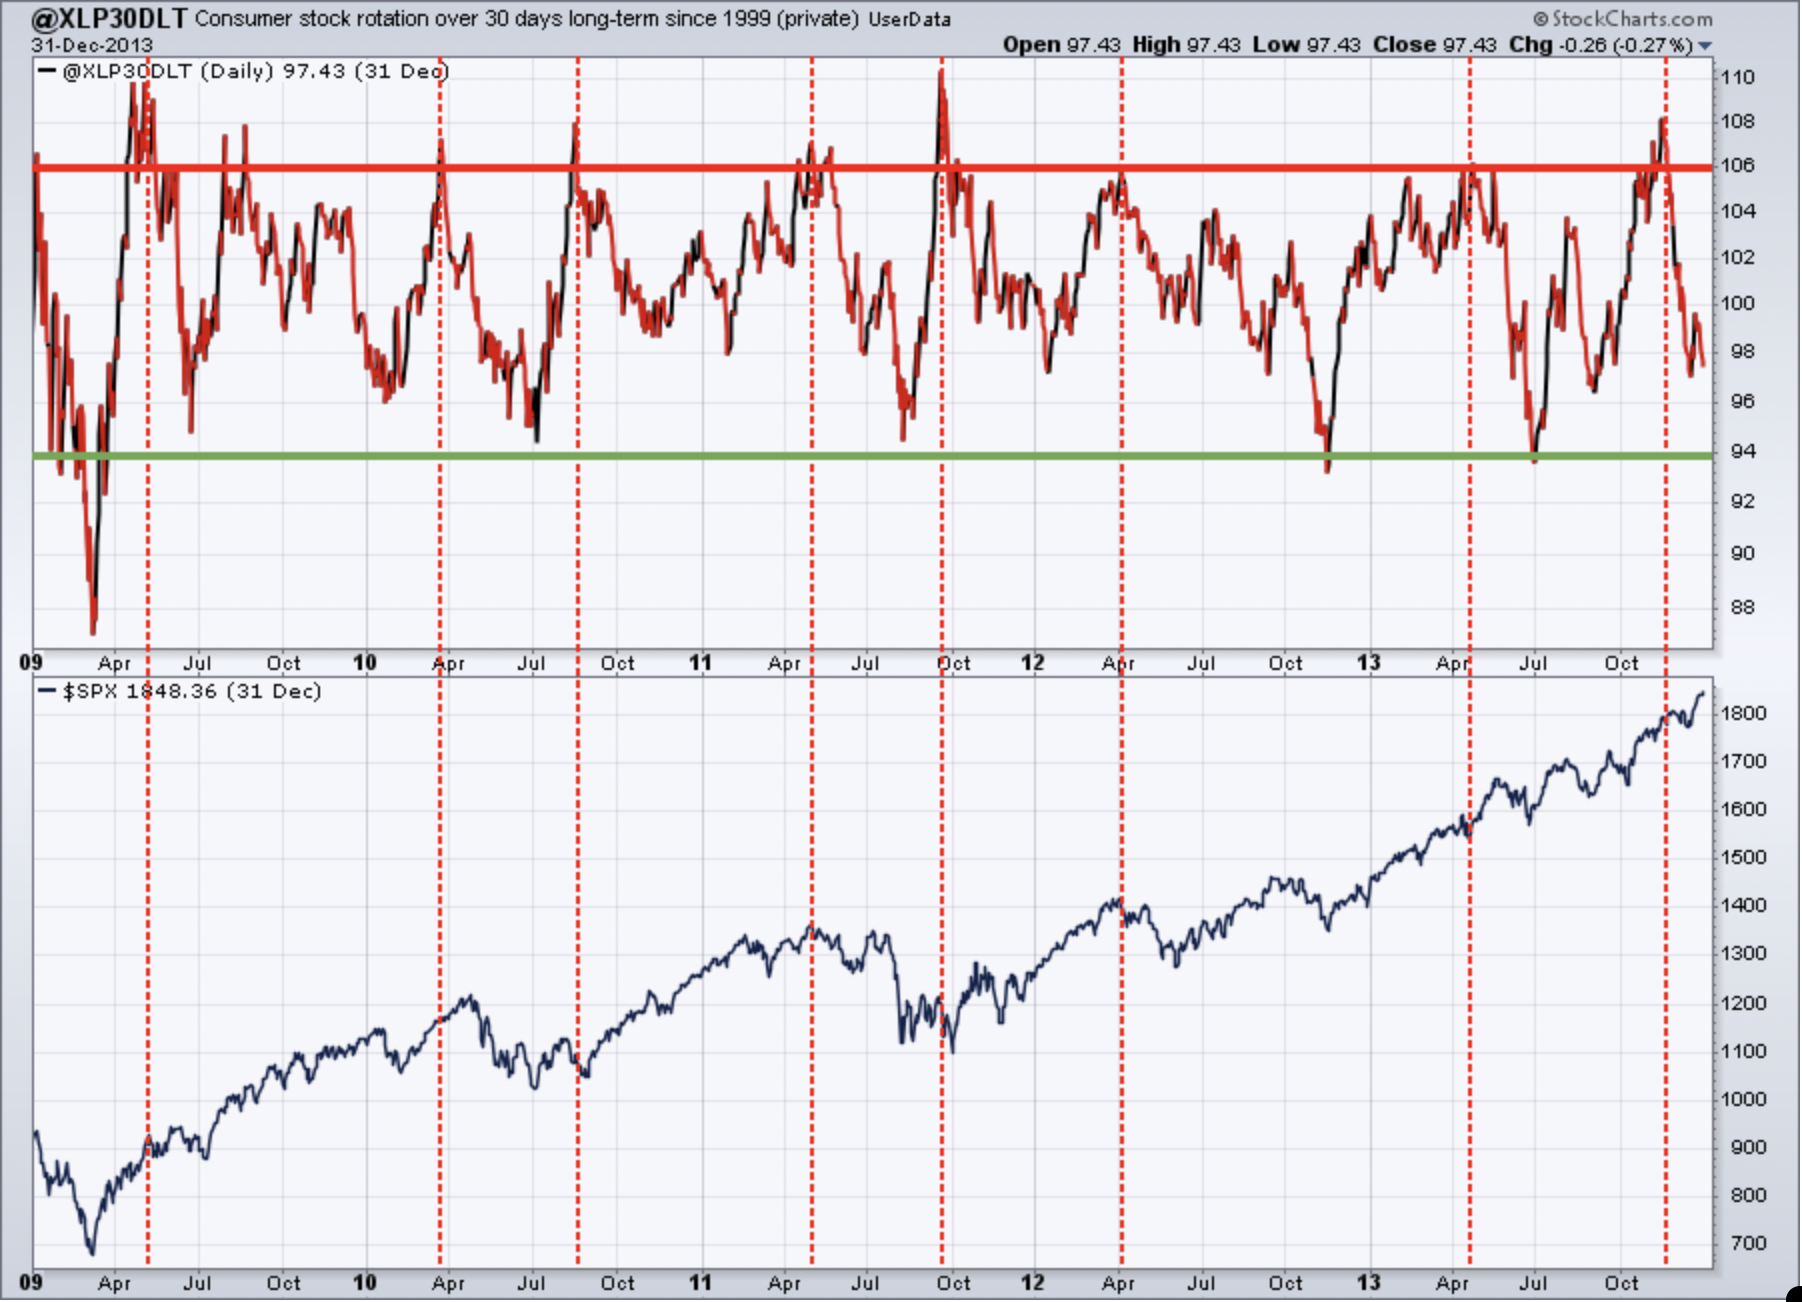
This period was characterized by rallies following a nasty secular bear market. There were plenty of false signals with our staples signal touching 106 without a lot of subsequent selling. However, signals above 106 did trigger prior to both of the two weakest periods from 2009 to 2013. In late Q1 2010, the XLP signal moved above 106 and the S&P 500 did top within a month. The signal in late April 2011 coincided with that key top. That April 2012 warning was timely as well.
One other point. Though this exercise isn't really looking for readings below 94 to market bottoms, such readings did do a great job in marking major bottoms throughout this period.
January 1, 2014 - December 31, 2017
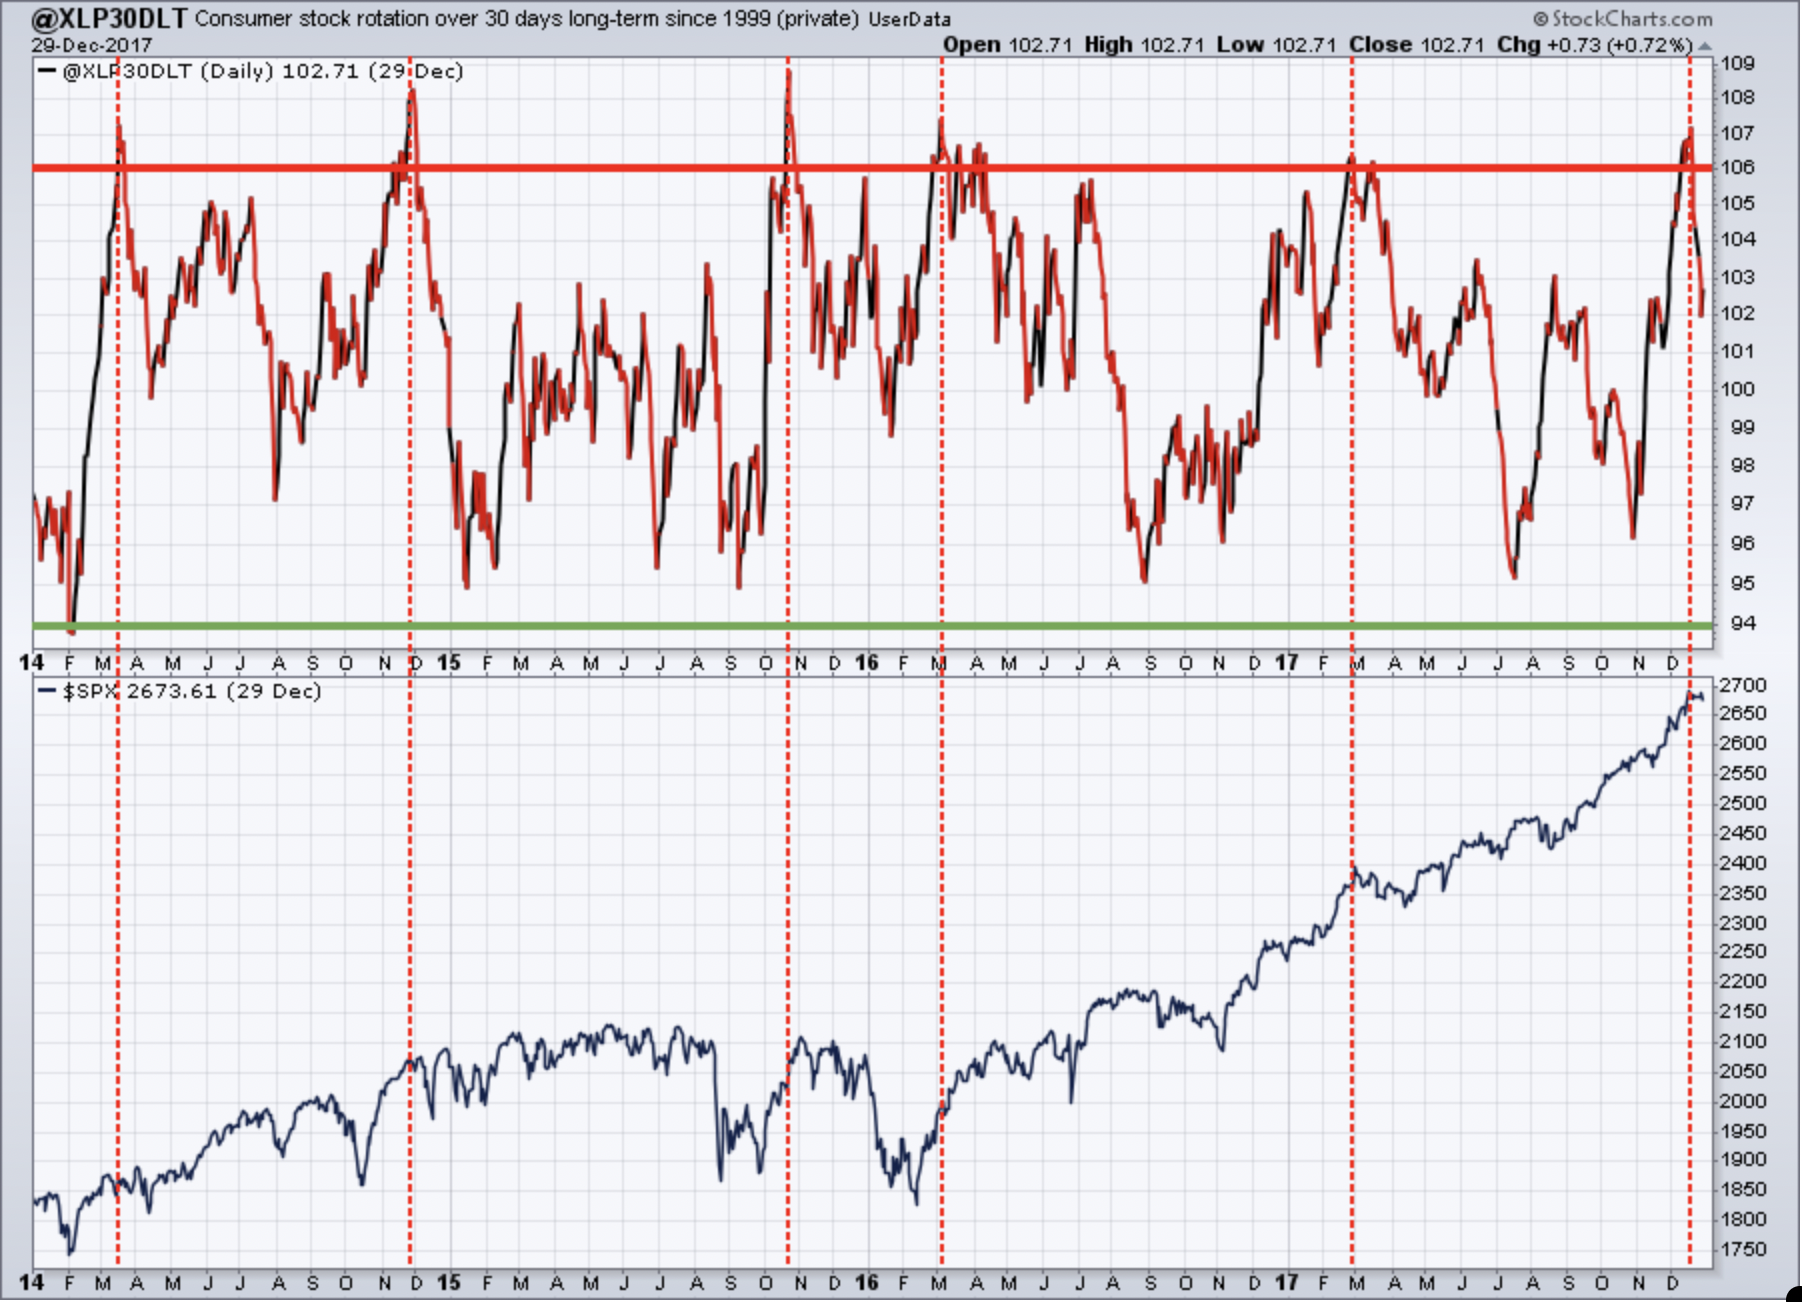
I feel like the warning signals throughout this period were mostly spot on. The reading at 109 in October 2015 came just prior to a significant drop to close out 2015 and begin 2016. The reading near 106 in July 2016 printed before a 5% late-summer dip. The November 2014 signal didn't signal any type of major top, but the S&P 500 really struggled to tack on any meaningful gains in 2015.
The one key reading of 94 in February 2014 happened to coincide with an important market low.
January 1, 2018 - December 31, 2022
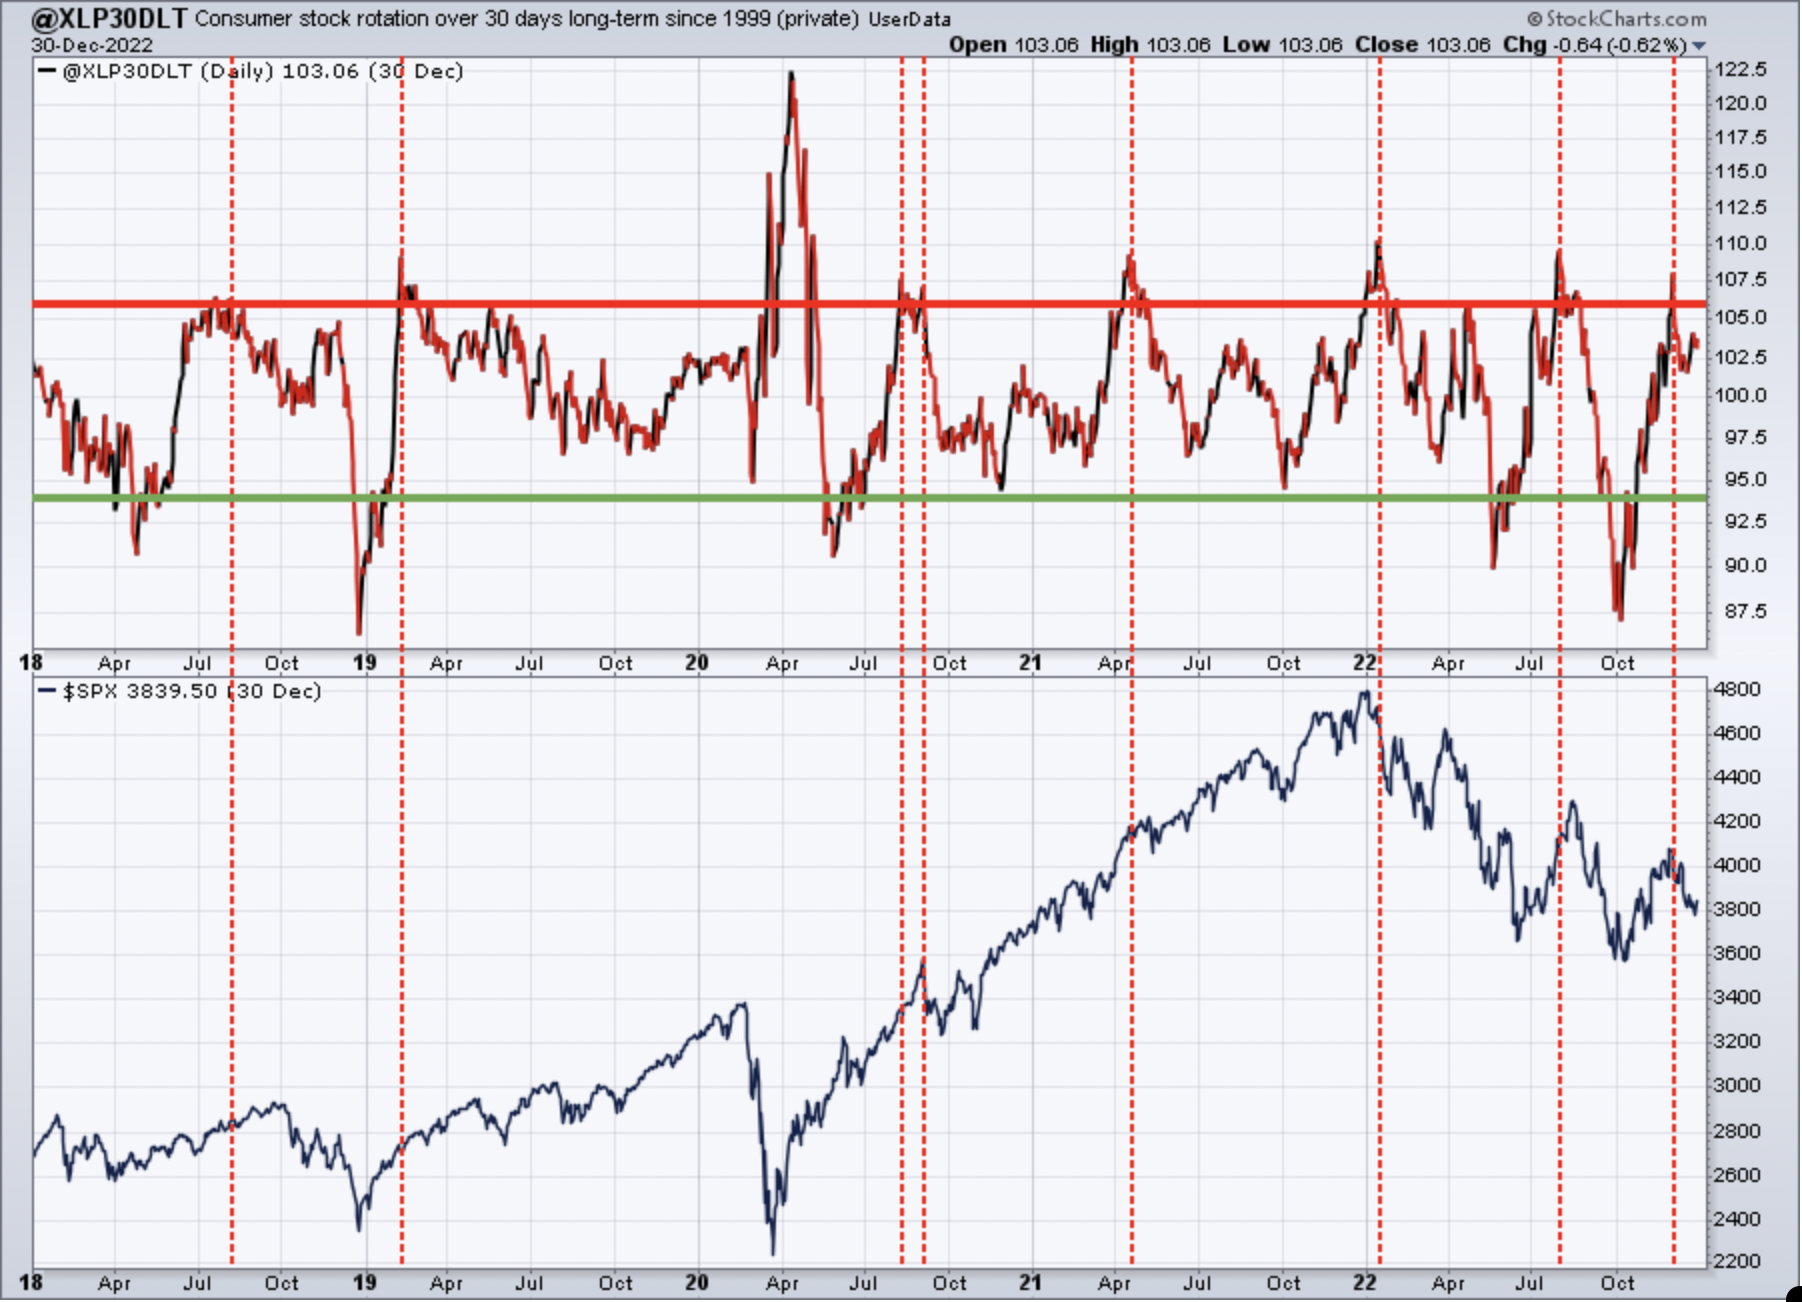
There were two significant market tops during this period. The first was the pandemic top in February 2020. This was the only major top since 1999 that we saw almost zero rotation into consumer staples leading up to it. We were slightly above 100, but not close to the key 106 level. I would not have expected major accumulation by Wall Street prior to a pandemic, however, as it would be very difficult to see the extent of the selling ahead of time.
When the S&P 500 topped at the beginning of 2022, just prior to a 20%+ cyclical bear market, this XLP signal was above 106 and it hit the 110 level in early January. Low XLP readings (94 and below) proved to be quite useful during this period.
January 1, 2023 - August 31, 2026
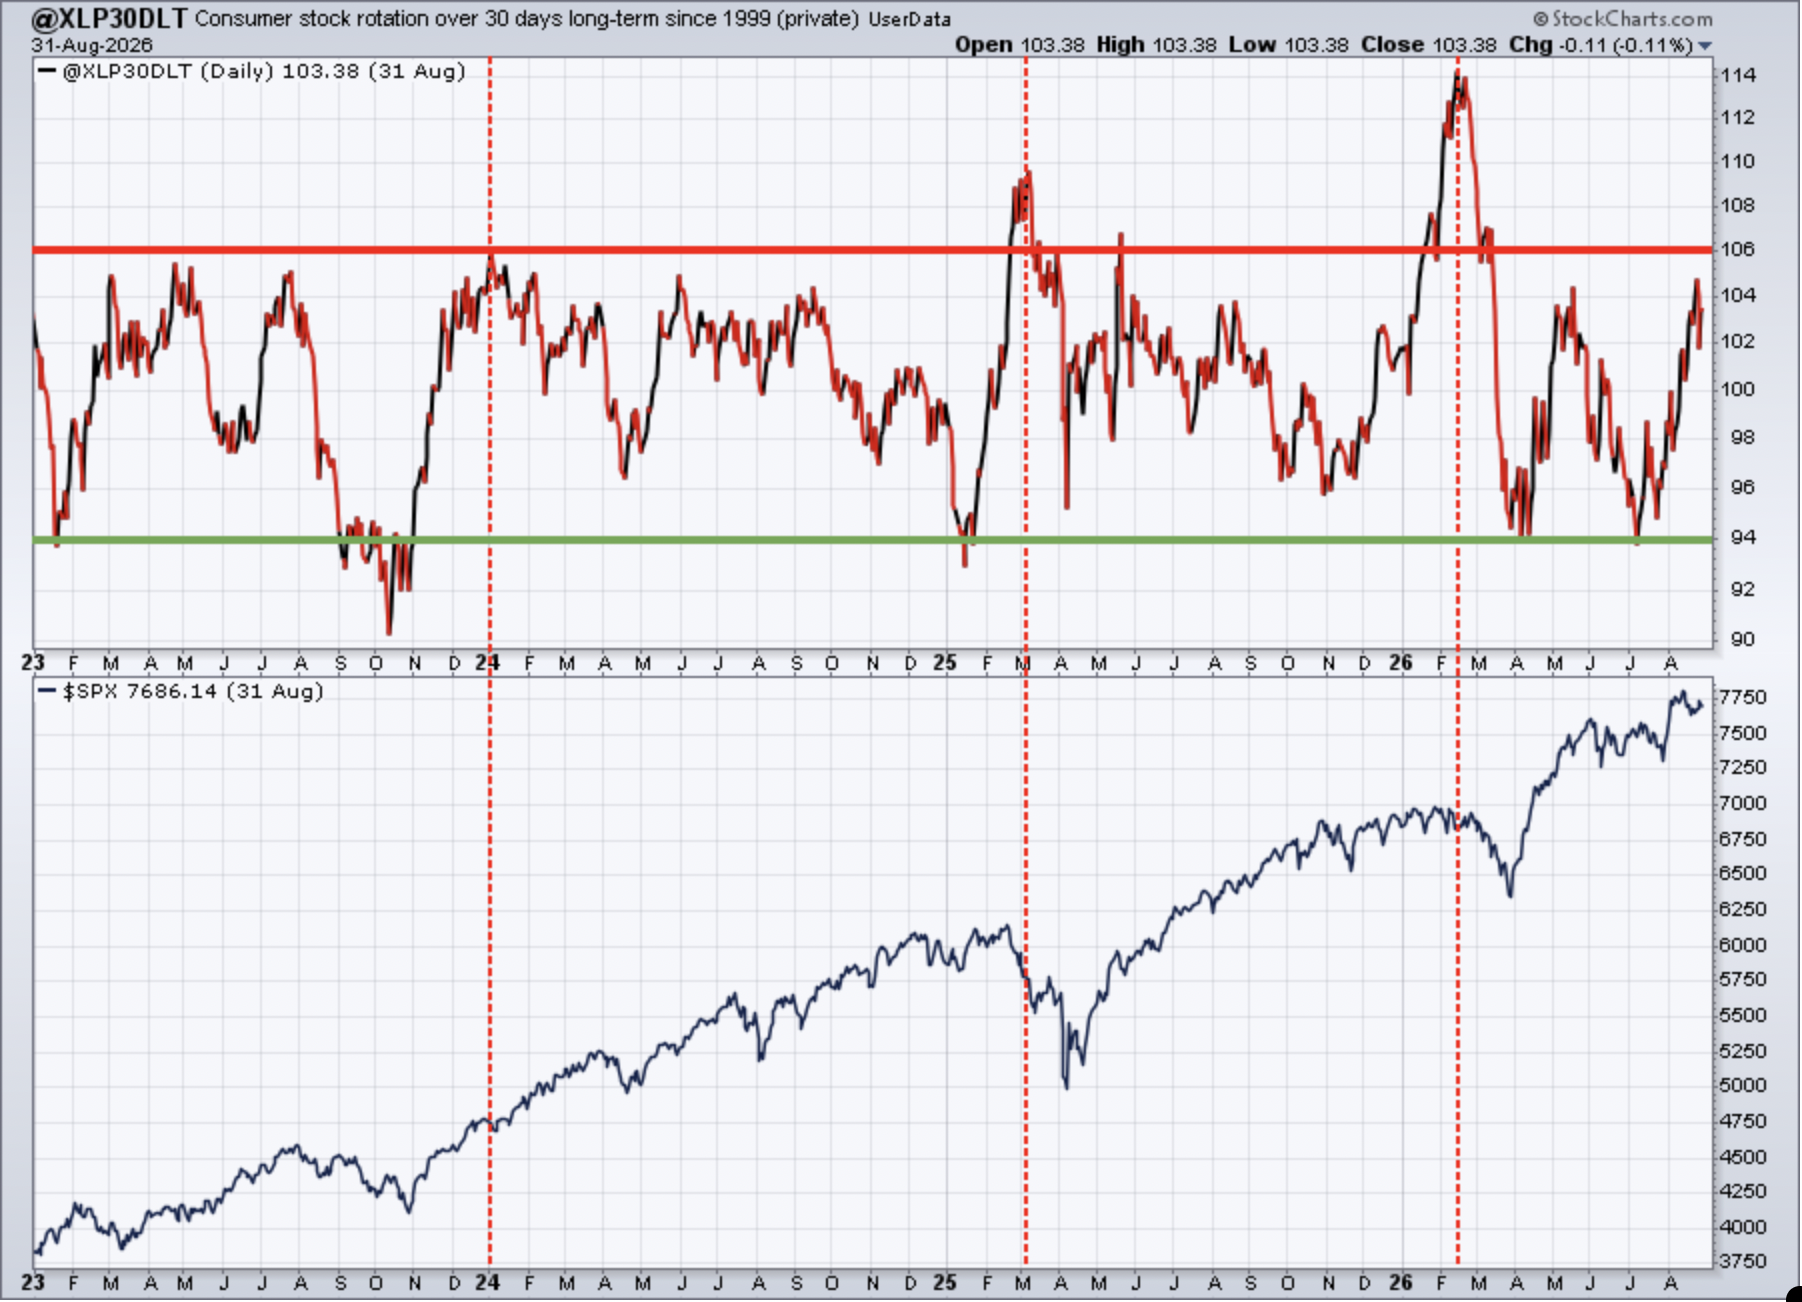
The soaring readings above 106 in early 2025 and early 2026 both provided excellent warnings ahead of S&P 500 weakness. 94 continued to mark key S&P 500 lows as well.
Conclusion
As I look back at these XLP signals over the past 27 years, I believe the readings above 106 and below 94 provide us exceptional market clues. Like every other signal that we use, the XLP signal does not provide us a guarantee. Not every reading above 106 precedes significant market weakness. Not every reading below 94 marks a bottom. BUTTTTT, every major market top since 1999 saw an XLP signal at or above 106 very close to that market top. The only exception was in 2020 and I don't believe we should have expected a high reading prior to such an unpredictable health scare.
There could be an even better timing signal if I include intraday performance of consumer discretionary stocks (XLY), and I'll keep working on that. But I intend to continue to publish this XLP signal in our Weekly Market Report for the foreseeable future.....and for good reason.
Happy trading!
Tom