
EB Daily Market Report - Wednesday, September 2, 2026
Executive Summary
- Futures were mixed overnight with most indices higher, while the NASDAQ was the exception
- The ADP employment report showed jobs slightly weaker than expected, but still positive; the more closely-watched nonfarm payrolls will be out on Friday
- After beginning the day in negative territory, the NASDAQ has turned positive, though it trails the other major indices
- The small cap Russell 2000 (IWM, +1.20%) is the best-performing index
- The 10-year treasury yield ($TNX) is flat today at 4.80%
- Materials (XLB, +1.81%) and communication services (XLC, +1.48%) lead all sectors
- Meanwhile, real estate (XLRE, -0.57%) is the lagging sector, while it's still notable that technology (XLK, -0.10%) remains weak
- Crude oil prices ($WTIC, +0.68%) are approaching $91 per barrel as energy (XLE, +0.73%) extends to yet another all-time high
- Dell Technologies, Inc (DELL, +13.95%) reported strong quarterly results and currently sits atop the S&P 500 leaderboard
Market Outlook
The S&P 500 bounced EXACTLY where it needed to on Tuesday, holding key short-term price support at 7610, which is clearly illustrated in this 3-month chart:
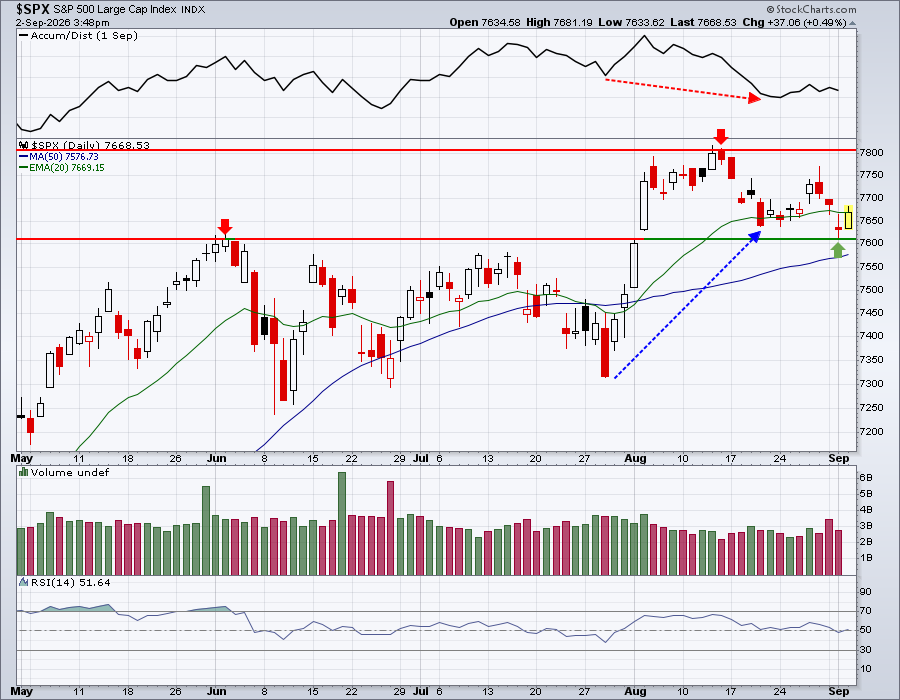
Price and volume are ALWAYS my primary indicator. So a nice rebound off of price support is BULLISH. However, check out the AD line at recent price lows. It's a crack in the bullish foundation. Then there's September, which we know isn't great for U.S. stocks historically. My sustainability ratios are not particularly strong either.
The takeaway, for me, is that the S&P 500 acted bullishly yesterday and currently trades in a 7610-7807 range. Let's see which way this breaks. IF it's to the downside, that is when those "cautious" secondary indicators become a bit more problematic and increase the odds of further short-term selling.
Sectors/Industries
Consumer finance ($DJUSSF) is an area that looks very interesting to me on a chart. Check this out:
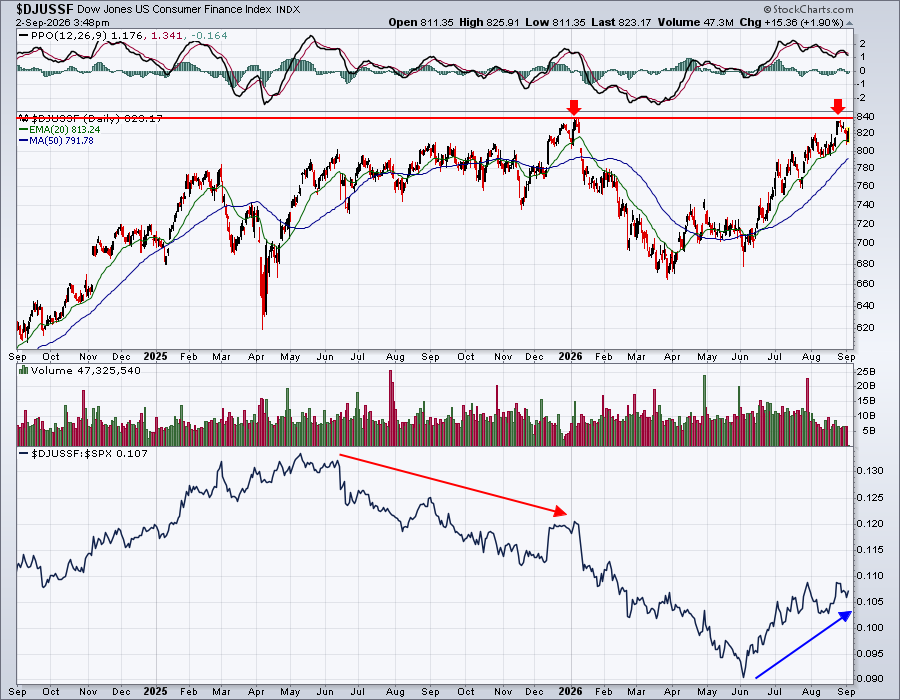
The last time that the DJUSSF reached 840, it was the start of 2026. Unfortunately, the group had been mired in a significant and lengthy relative downtrend vs. the benchmark S&P 500. This time the group looks a bit healthier on a relative basis as it approaches 840 again. A breakout would be bullish.
ChartLists and Trading Strategies
If we want to trade leading stocks on pullbacks, then here would be one to consider from the Strong Earnings ChartList (SECL):
RBRK:
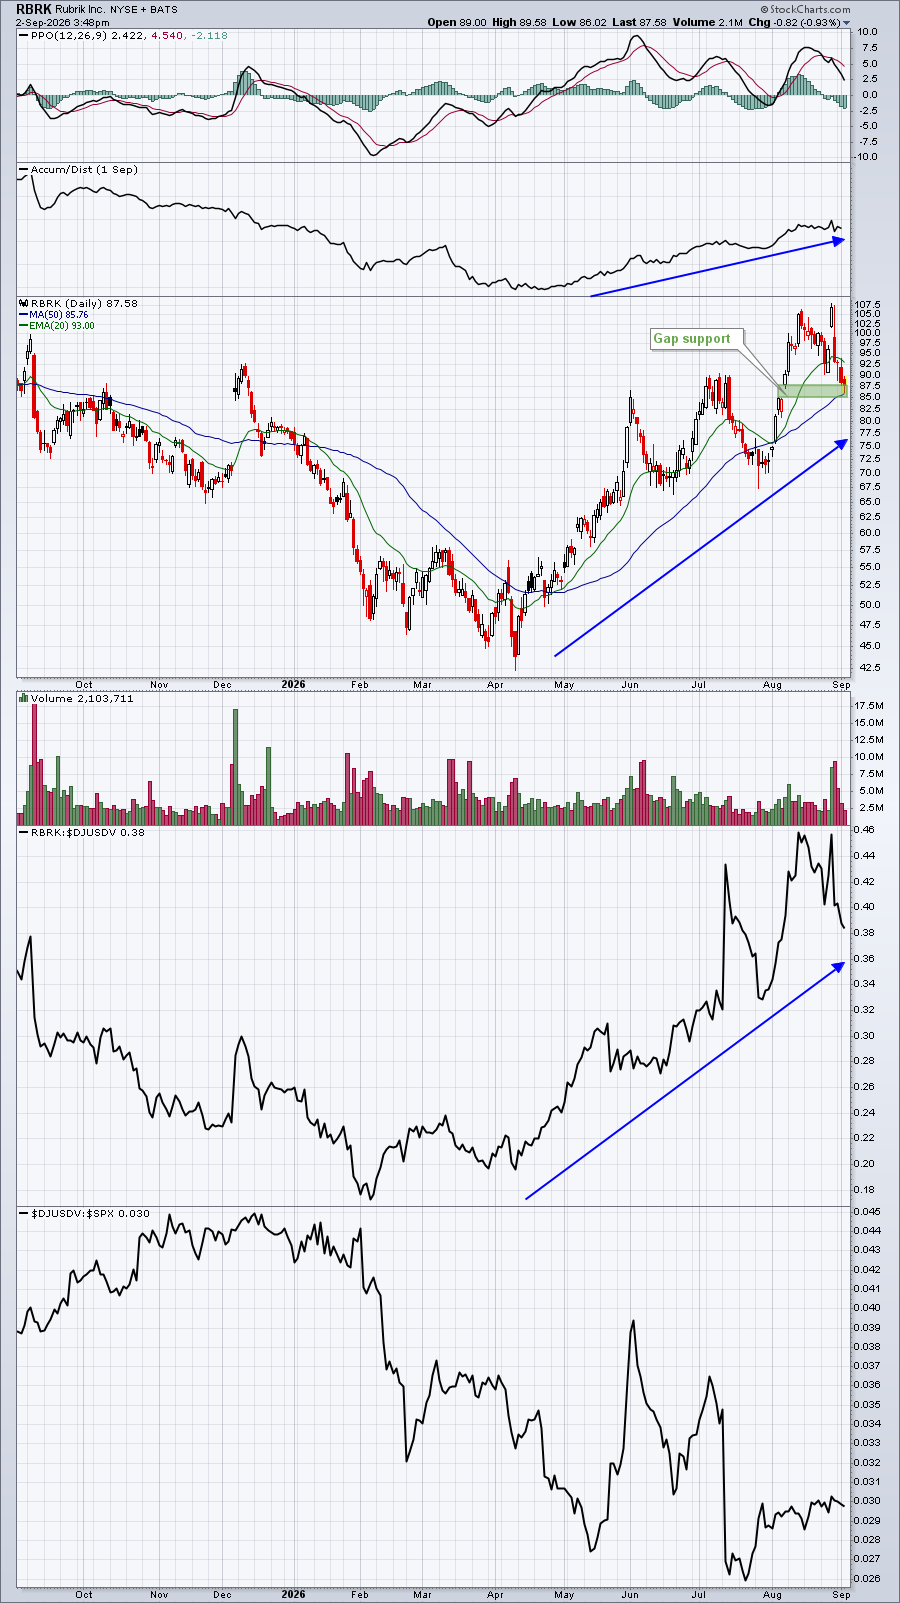
RBRK is now trading back to a key gap support zone, while simultaneously testing its 50-day SMA. Just four days ago, RBRK was above 107 and today it neared 86, roughly a 20% decline. This is a potential trade for AGGRESSIVE traders.
Upcoming Earnings
Upcoming Earnings and Upcoming Earnings Relative Strength ChartLists are now available on our website and we'll continue to track upcoming earnings reports and provide them to you via ChartLists throughout Q2 earnings season. This is the final week of Upcoming Earnings ChartLists until Q3 earnings season begins in mid-October.
Economic Reports
August ADP employment report: 38,000 (actual) vs. 47,000 (estimate)
July factory orders: +0.9% (actual) vs. +0.7% (estimate)
Beige book released at 2:00pm ET
Happy trading!
Tom