
EB Daily Market Report - Thursday, September 3, 2026
Note
The September Seasonality stocks have been selected and a ChartList will be posted on the website today, if it's not already posted. But to let you know, there were 14 stocks included as follows:
- Large cap (5) - ULTA, DELL, VST, NKE, LULU
- Mid cap (4) - NTNX, THO, FIVE, HQY
- Small cap (5) - AEO, INSW, QDEL, SIG, HCC
September is not a strong month, so there aren't a lot of stocks that have established a solid track record in September. I'd be interested in the above stocks if they show other bullish characteristics. I typically DO NOT buy any stock based solely on historical tendencies.
Executive Summary
- Futures were mixed overnight, but did improve this morning
- Our major indices opened higher and they've continued trending up throughout today's session thus far
- Small caps (IWM, +0.33%) and mid caps (MDY, +0.70%) are lagging a bit, as both the Dow Jones ($INDU, +1.10%) and NASDAQ 100 ($NDX, +1.01%) gain more than 1%
- 9 of 11 sectors are higher, so we're seeing fairly wide-spread participation
- Consumer discretionary (XLY, +1.68%) and financials (XLF, +1.26%) lead the way
- Automobiles ($DJUSAU, +6.28%) are having a big day as Tesla (TSLA, +6.97%) has jumped nearly 7%
- Among financials, investment services ($DJUSSB, +3.30%) is attempting to break to a new all-time high
- Cryptocurrencies are flying as bitcoin ($BTCUSD, +4.97%) surges back above 81,000; dogecoin ($DOGEUSD, +9.69%) gains nearly 10%
- Commodities are jumping too with crude oil ($WTIC, +1.10%) reaching $92 per barrel
- The 10-year treasury yield ($TNX) has fallen 4 basis points to 4.76%, thus far failing at key overhead yield resistance - more on this below
- Snowflake (SNOW, +20.68%) posted excellent quarterly results, and the stock has now more than tripled since mid April
- The August nonfarm payrolls will be released tomorrow morning in pre-market
Market Outlook
The 10-year treasury yield's ($TNX) drop back beneath 4.80% is likely providing U.S. stocks a bit of relief today. Whether it lasts may be another story. One of my biggest short-term fears is a continuing uptrend in the TNX to threaten 5.00%, which is the highest level that we've seen in the past two decades. There's a big FOMC meeting in 2 1/2 weeks that could shape the S&P 500's short-term direction. And I believe the stock market could take its cue from the bond market and the TNX. Here's where the TNX currently stands:
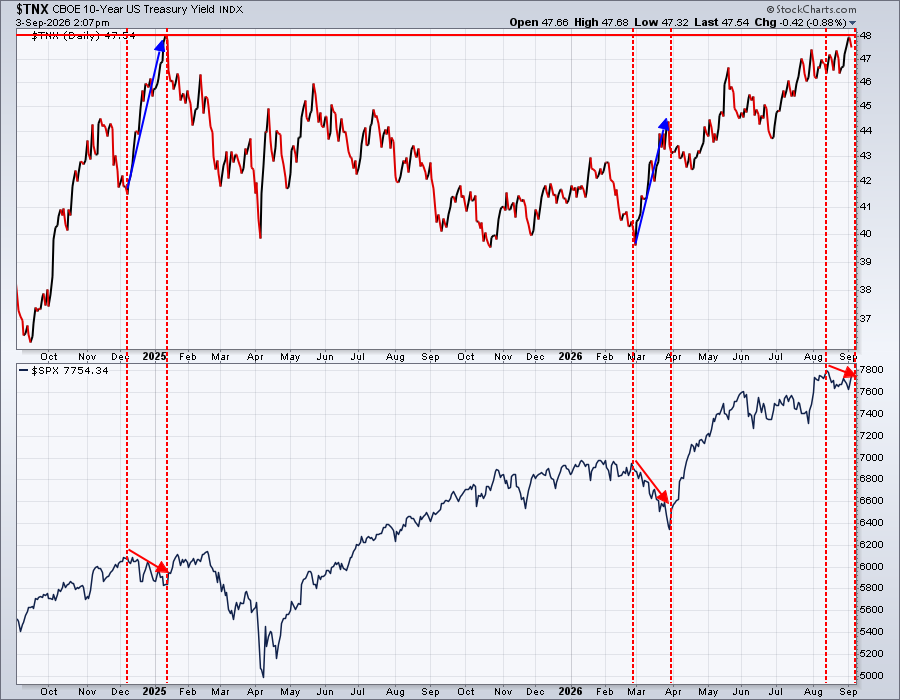
I don't want to try to paint a picture that the S&P 500 will do opposite of whatever the TNX does. You can look at different periods above and see that that is not the case. However, there is some precedence that when the TNX shoots up quickly, it can have a detrimental short-term impact on stocks. If the TNX can stay below 4.80%, then I think any short-term stock weakness will be relatively contained. A move in the TNX above 4.80% and I believe the odds are greater of a bigger Sept/Oct selloff.
Sectors/Industries
Yesterday, in our Live Trading Room, I discussed software and one of its more heavily traded ETFs (IGV). Software had been sold off hard in the past few sessions and IGV retreated back to test its 20-day EMA:
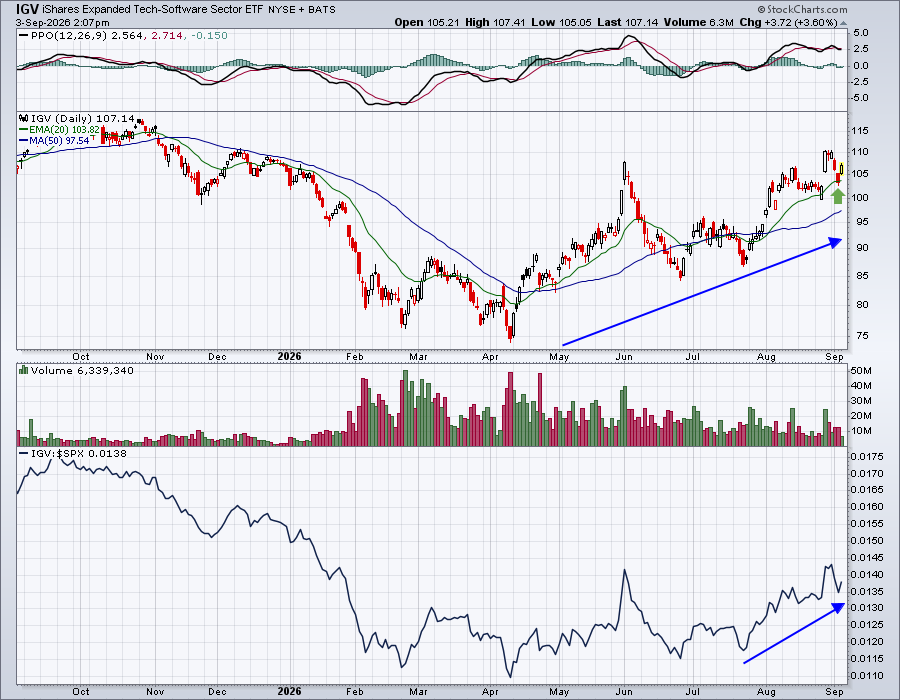
The bounce today is nice, timely, and encouraging for software bulls. Another area of the market that has just tested key support is transportation stocks. A popular ETF to track this group is the IYT. After breaking above its 82.50-83.00 resistance level, the IYT moved up to 90, but printed a negative divergence (lower PPO with higher price). That led to ensuing weakness and I realize the PPO centerline breakdown and price action below its key moving averages (red circles) look somewhat bearish, but keep one thing in mind. NOTHING is more important than price support and I believe the biggest price support on the IYT chart is at that 182.50-183.00 level.
ChartLists and Trading Strategies
Personally, I like trading strong stocks that have pulled back, particularly those that appear to have experienced a false breakdown. That's a tactic used by market makers to accumulate shares. After all, if a stock is breaking below price support, what trader is going to buy the stock? Just about every successful trader I know will sell a stock when it breaks below support. So intraday breakdowns beneath support create supply for market makers to accumulate shares for their institutional clients. Breakdowns generally create more volume, because traders using risk management strategies want to minimize potential losses. A temporary, intraday breakdown is a great way for market makers to accumulate a larger inventory.
Having said all of this, I look for leading stocks on our ChartLists that display this characteristic. One stock today that looks like it MIGHT have seen a temporary, intraday breakdown is Arista Networks (ANET). Check this out:
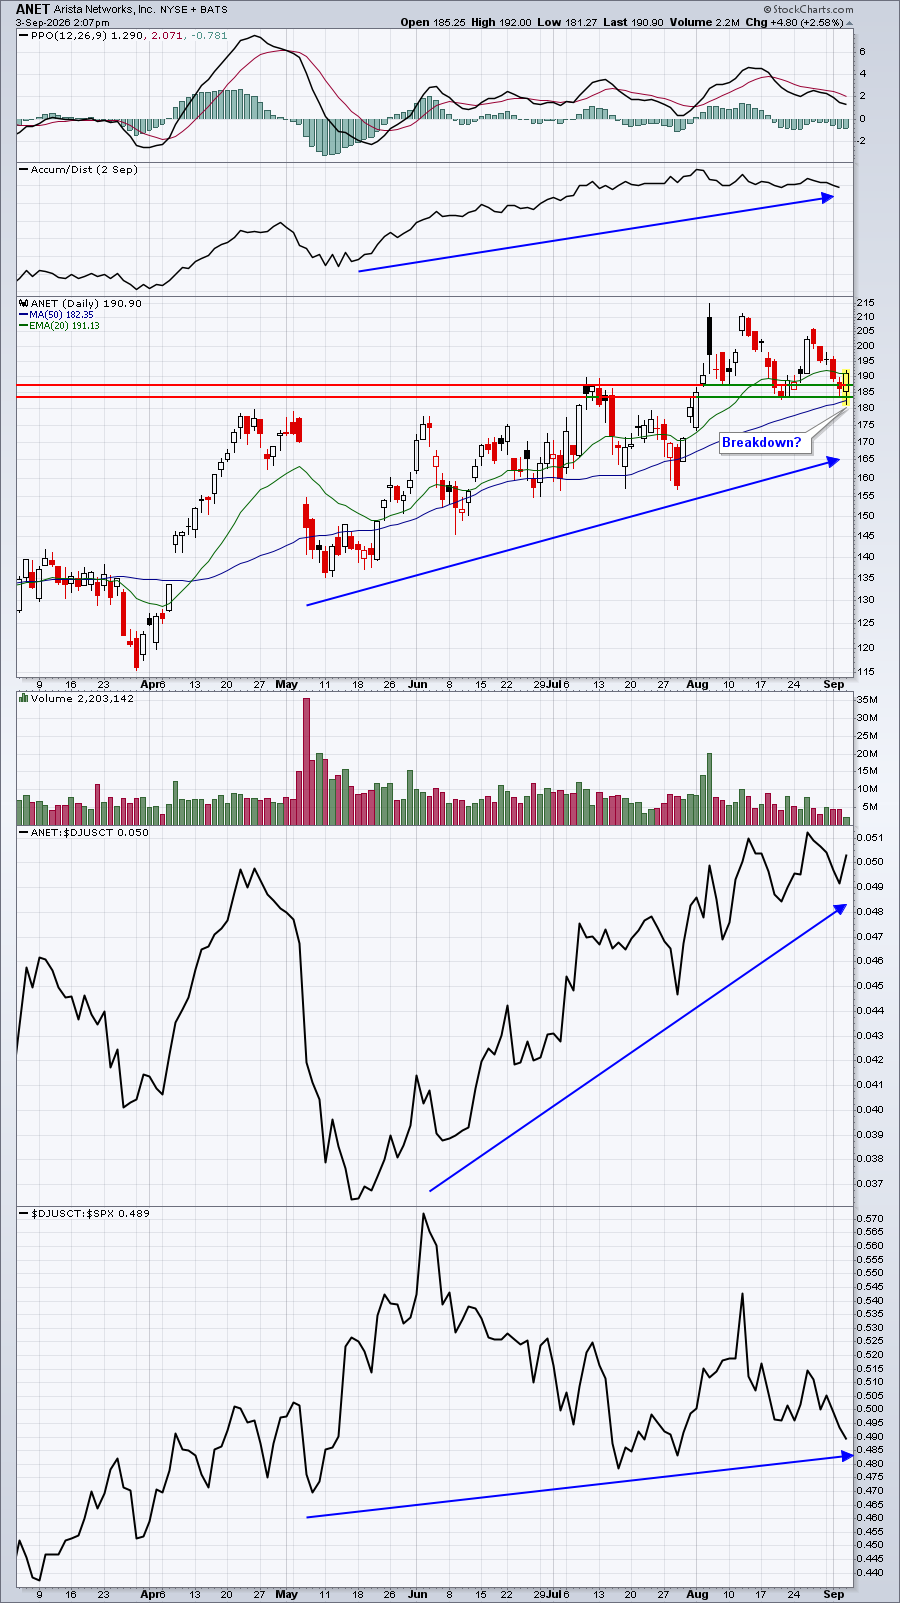
If you've been burned countless times chasing stocks after huge rallies, buying those same strong stocks after false breakdowns might be a strategy to incorporate. ANET appeared to lose recent price support AND its 50-day SMA early in today's session, before rallying strongly off the low. This very well may turn out to be a very important low on ANET's chart.
Upcoming Earnings
Upcoming Earnings and Upcoming Earnings Relative Strength ChartLists are now available on our website and we'll continue to track upcoming earnings reports and provide them to you via ChartLists throughout Q2 earnings season. This is the final week of Upcoming Earnings ChartLists until Q3 earnings season begins in mid-October.
Economic Reports
Initial jobless claims: 206,000 (actual) vs. 205,000 (estimate)
August PMI services: 56.5 (actual) vs. 56.2 (estimate)
Happy trading!
Tom