
EB Daily Market Report - Thursday, September 10, 2026
Executive Summary
- Futures were weak overnight and all of our major indices gapped lower at the open
- The S&P 500 is down 0.62% and may lose key price support at 7609.78, while the small cap Russell 2000 (IWM, -1.13%) is trading at a 3-month low
- 9 of 11 sectors are down today, with technology (XLK, -1.36%) among the hardest hit
- Communication services (XLC, +0.50%) and consumer staples (XLP, +0.18%) are the only two sectors gaining ground on the session thus far
- The 10-year treasury yield ($TNX) has surged 11 basis points to 4.95%, threatening a two-decade high of 5.00%
- The surging yield comes despite better-than-expected August PPI data earlier
- Bitcoin ($BTCUSD, -1.62%) is testing its rising 20-day EMA for the first time since it spiked higher in mid August
- Crude oil ($WTIC, +6.32%) has jumped back above $102 per barrel, adding inflationary pressures and potentially raising the likelihood of a Fed rate hike
- Most other commodities are lower today, including gold ($GOLD, -1.55%), which is a bit surprising if you're anticipating inflationary pressures
Market Outlook
The August PPI was released this morning and the headline number came in as expected, with a rise of +0.4%. If we strip out food & energy, the Core PPI was +0.2%, slightly better than the +0.3% forecast. That didn't seem to matter to the bond market folks, however, as bonds were sold, resulting in a spike in treasury yields. The 10-year treasury yield ($TNX) has surged to 4.93%, up 9 basis points today, despite the better-than-expected PPI data. This is telling me that the bond market may have already made up its collective mind that the Fed is going to raise the fed funds rate by a quarter point.
So why would the Fed want to raise rates if the August PPI isn't any hotter than expected? In fact, the core PPI number actually was weaker than expected, so what's the deal? Well, I think it all comes back to the mandate of THIS Fed. Fed Chief Warsh has said on numerous occasions that THIS Fed will not tolerate inflation. Period. They want to squash inflation. I believe the Fed is watching crude oil prices ($WTIC) accelerate back above $102 per barrel today and is realizing that they do not want to wait for stubbornly-high inflation to embed itself in our economy. I believe they're going to act to hike rates. To a large extent, I believe it's built into prices. That's good news as this is nothing that will catch Wall Street by surprise. The odds of a rate hike have now jumped above 70%, despite the better-than-expected inflation numbers. I found that quite telling.
Listen, the August CPI, due out tomorrow morning, still could sway the Fed. The Fed doesn't want to raise rates unnecessarily. There's no benefit in doing that. Given the rise in crude oil prices, however, I see a rate hike coming, unless the August Core CPI comes in below, perhaps way below, consensus estimates. Currently, the expectation is for a +0.2% increase in the Core CPI. A flat reading might sway the Fed to hold rates steady until the next meeting, but any positive reading may not convince the majority to hold rates steady.
I believe a rate hike is coming and the 10-year treasury yield is pricing it in. We've moved very close to 5.00% and there's still a good chance that this treasury yield spike could weigh on U.S. equities, even if it's just a near-term issue. First, let's look at the latest on the TNX:
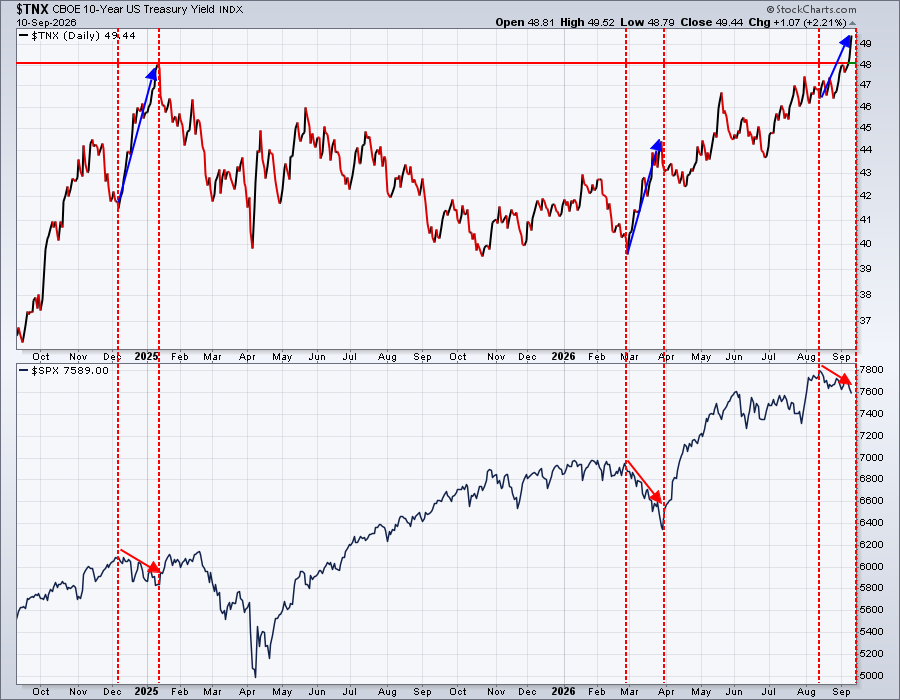
This scenario is playing out almost EXACTLY as I've discussed in recent weeks. A spiking TNX is my biggest near-term concern. Losing key price support on the S&P 500 at 7609.78 is the technical price breakdown that COULD trigger further selling. It's September and we know what that means from a seasonal perspective. Here's the current look at the S&P 500:
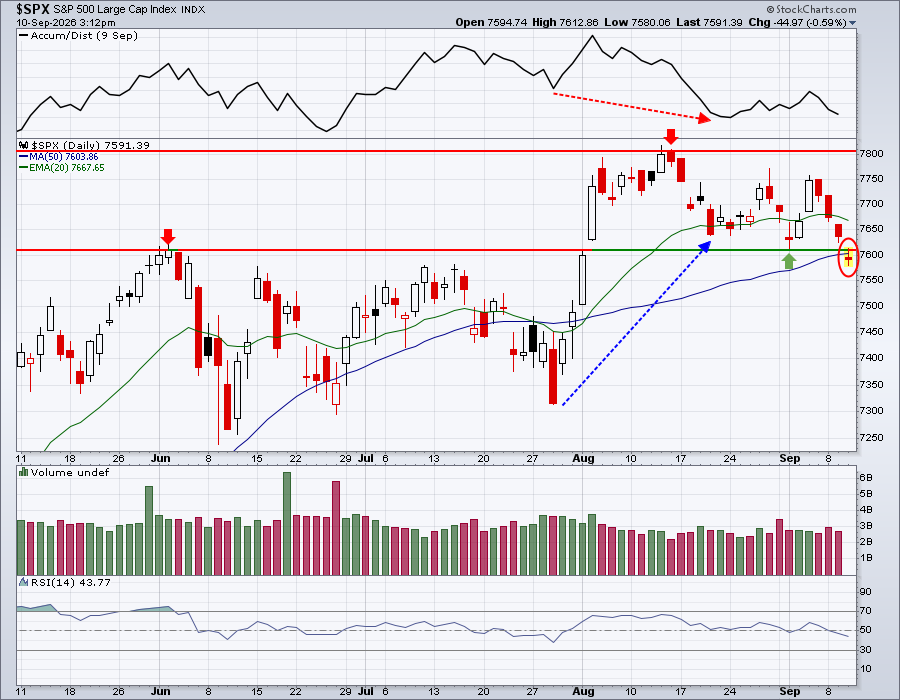
The good news, if there is any on a potential price breakdown, is that the selling occurred mostly at the opening bell. A big selloff this afternoon would add to the short-term bearishness, especially if that August Core CPI number on Friday morning shakes traders/investors.
Now is a very good time to be cautious as a short-term trader. None of this bothers me from a long-term perspective. I still see fresh, new all-time highs coming in Q4 and/or 2027.
Sectors/Industries
As I've mentioned recently, the 10-year treasury yield can move higher for one of two reasons. The first is simply a strengthening economy, which results in higher S&P 500 profits and expanding PE multiples, lifting U.S. stocks. The alternative, however, is higher inflation or the possibility of higher inflation. In this case, a higher TNX would normally translate into a S&P 500 selloff with growth stocks being hit particularly hard.
If inflation persists and market participants believe that we're in for a lengthy inflationary battle, then inflation hedges like gold ($GOLD) and real estate (XLRE) should see TONS of rotation into these asset classes. Yet, as I look at the following chart, I'm just not seeing that:
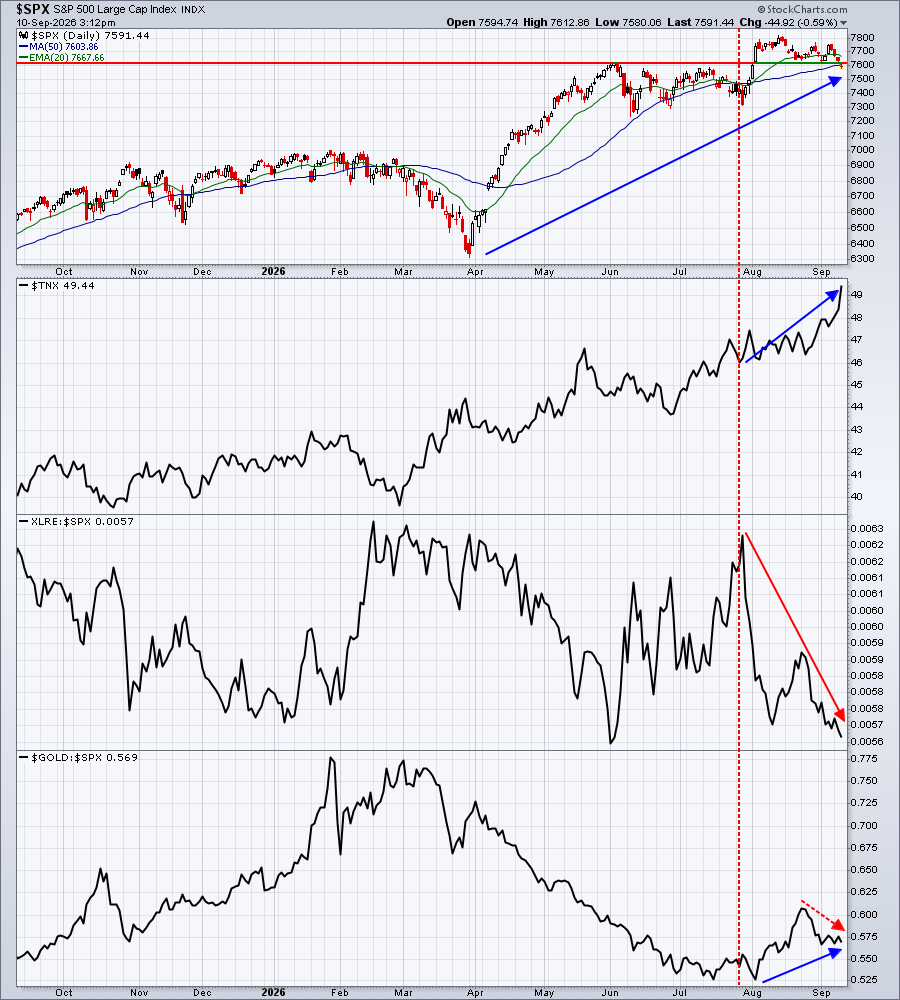
I think if we look at this chart from an unbiased perspective, we see a rising TNX that's accompanied by a rapidly-weakening real estate group (rotation AWAY from this more defensive and value-oriented group) and very little relative strength in gold. In fact, we're seeing money rotate AWAY from gold over the past couple weeks as discussions have intensified about inflation and higher interest rates. None of this makes any sense if Wall Street truly had long-term concerns about inflation. Therefore, and in my opinion, this interest rate spike has more to do with the likelihood that a strengthening economy could be awaiting us in 2027.
Now let me also say that cyclical areas of the market that should be performing well during a strengthening economy, or a widely-expected strengthening of the economy ahead, like many consumer discretionary areas and transports ($TRAN) are not strong either. So this isn't a slam dunk analysis.
I will be watching the next significant advance in the stock market to see the makeup of such an advance. I believe that's where the truth will lie.
ChartLists and Trading Strategies
The S&P 500 is currently trading beneath its initial key price support level of 7609.78 and beneath its 50-day SMA for the first time in 6 weeks. Personally, I don't believe this is a good time to be taking on more risk. As a trader, I have significantly lightened my risk in this current market environment.
Upcoming Earnings
Upcoming Earnings and Upcoming Earnings Relative Strength ChartLists are now available on our website and we'll continue to track upcoming earnings reports and provide them to you via ChartLists throughout Q2 earnings season. We will no longer produce Upcoming Earnings ChartLists on a weekly basis until Q3 earnings season begins in mid-October.
Economic Reports
Initial jobless claims: 206,000 (actual) vs. 205,000 (estimate)
August PPI: +0.4% (actual) vs. +0.4% (estimate)
August Core PPI: +0.2% (actual) vs. +0.3% (estimate)
August existing home sales: 4,000,000 (actual) vs. 4,000,000 (estimate)
Happy trading!
Tom