
EB Daily Market Report - Thursday, September 17, 2026
Executive Summary
- Futures were very strong overnight and saw gap ups across our major indices
- Initial jobless claims fell back below 200,000, supporting the Fed's view that the U.S. economy is strong enough to handle higher rates
- 10 of 11 sectors are higher on the session, led by technology (XLK, +2.21%)
- Consumer discretionary (XLY, +1.33%) is also quite strong, while communication services (XLC, -0.51%) is the clear laggard
- A strong semiconductor group ($DJUSSC, +3.30%) is lifting the NASDAQ 100 ($NDX, +1.65%) to outsized gains vs. the other major indices
- The 10-year treasury yield ($TNX) is down 6 basis points to 4.95%, despite the bullish initial jobless claims data out this morning
- Crude oil prices ($WTIC, -0.62%) are down slightly and just below $102 per barrel
- Other commodities are mostly higher, including silver ($SILVER, +1.47%)
- Cryptocurrencies, a "risk on" asset class, is rebounding today, with bitcoin ($BTCUSD, +0.96%) rising after hitting a 4-week low on Wednesday
Market Outlook
The short-term market action is playing out similar to how I described it might on Tuesday. Here were my remarks then:
"Max pain was beneath the price action on our major indices as we closed out last week, but the weakness this week has eliminated the downside risk. In fact, if stock prices drop as a result of the FOMC decision tomorrow afternoon, don't be surprised to see a quick counter rally as max pain would then favor the longs."
We saw an immediate drop in stock prices after the FOMC announcement, but we began recovering in the final 30-60 minutes and this morning's strength, for the most part, wiped out the afternoon selling on Wednesday after the rate hike:
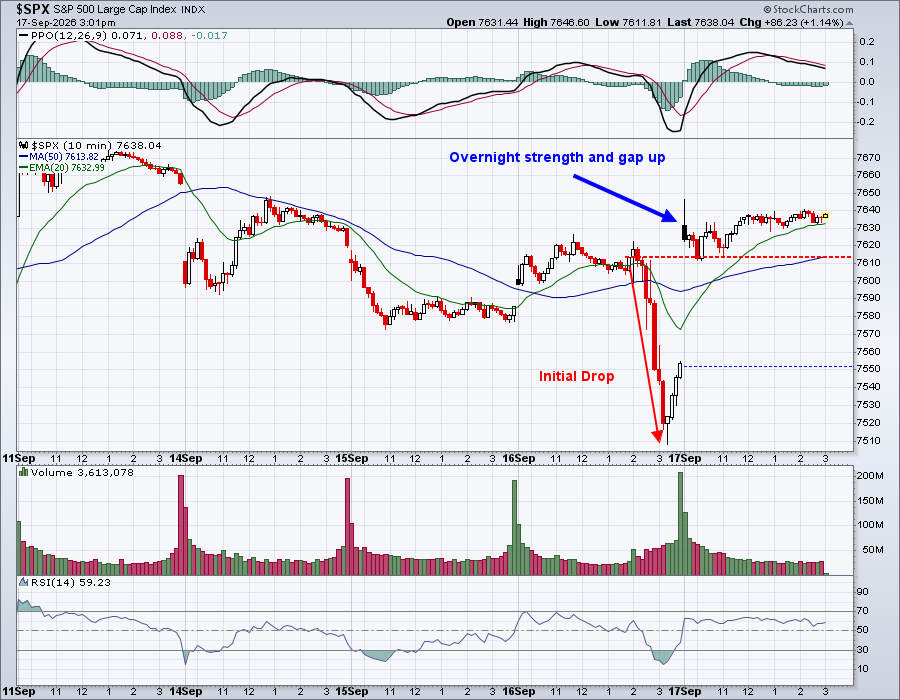
Thus far, it's a net ZERO. The S&P 500 is up about 0.3% from where it was when the 25-basis point hike was announced.
In the bigger picture, nothing has really changed on the S&P 500:
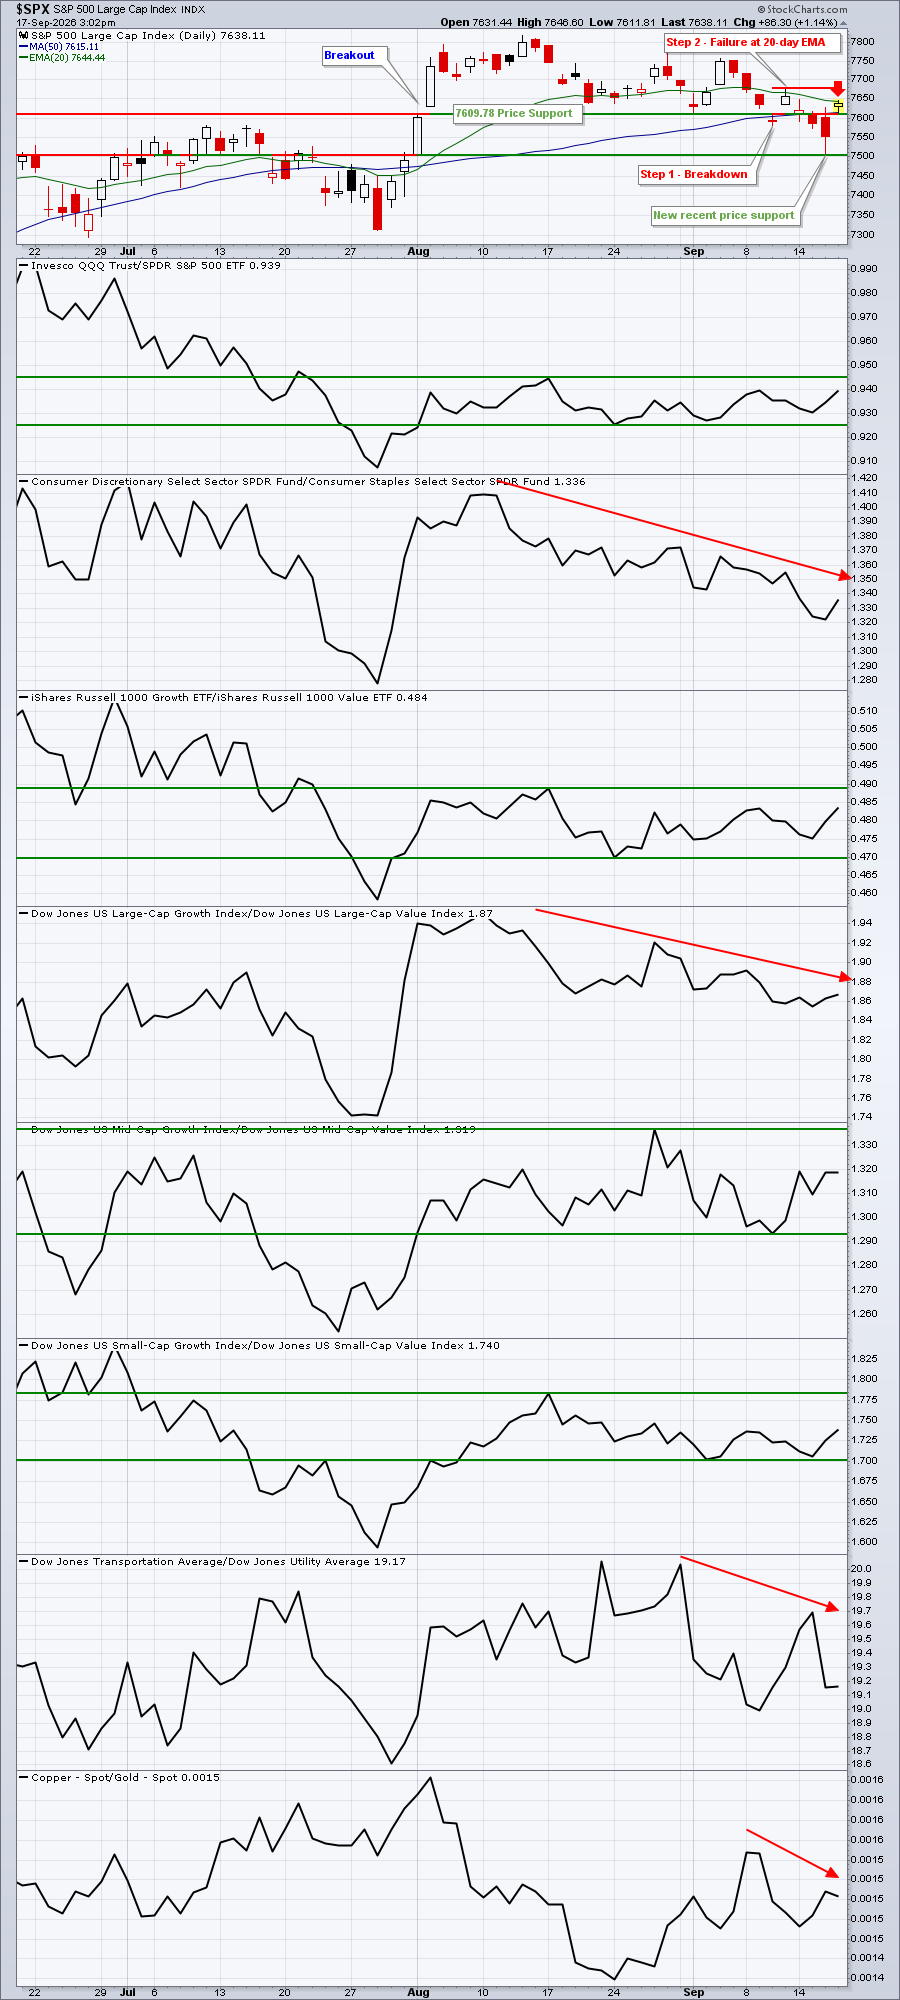
I still see the S&P 500 in a short-term downtrend that doesn't change unless it's able to rise and clear the recent reaction high at 7677.02 on September 11th. Meanwhile, a new recent post-rate-hike low was established at 7507.77 and is a level I'd now view as short-term price support.
Sectors/Industries
I provided a look at our 9 aggressive and defensive sectors in yesterday's DMR. I find it interesting that while our major indices are having a strong session, we've not seen ANY of our sustainability ratios (S&P 500 3-Month chart shown above) clear key resistance and not ANY of our defensive sectors lose recent price support.
In other words, offense is not winning right now.
Let me also add that, according to a Yahoo Finance article today, the S&P 500 has seen an average 4% drop over the 6 weeks following the start of a new rate-hiking campaign by the Fed. First, I want to point out that I have not verified this information, so I'm literally just passing along what I read. Second, if it is true, the 6-week period would end on October 28th, which is THE DAY that our most bullish seasonal period of the year begins. Coincidence? Maybe.
By the way, a 4% decline from the S&P 500 level at 2pm yesterday (7613.32) would be 7308.79. The key July low was 7313.92. It's certainly possible. I think it's important to remain open-minded in the near-term, with thoughts of higher prices after that. At least that's how I'm viewing it at the moment.
ChartLists and Trading Strategies
This the first day of trading after the Fed initiated a fresh rate hiking campaign. The Fed has indicated that it's likely there'll be one more 25-basis point increase in the fed funds rate in 2026. I believe we need to give U.S. stocks a bit of time to fully process the likely impact of this more hawkish Fed view. There's nothing wrong with trading stocks in the near-term, but I do expect the level of whipsaw action to increase, perhaps stopping out a higher percentage of trades.
Upcoming Earnings
Upcoming Earnings and Upcoming Earnings Relative Strength ChartLists are produced for EB.com members to track upcoming earnings reports and provide them to you via ChartLists throughout earnings season. We will begin producing Upcoming Earnings ChartLists again on a weekly basis when Q3 earnings season begins in mid-October.
Economic Reports
Initial jobless claims: 196,000 (actual) vs. 207,000 (estimate)
August housing starts: 1,300,000 (actual) vs. 1,300,000 (estimate)
August Philadelphia Fed Business Outlook Survey: 37.8 (actual) vs. 34.0 (estimate)
August pending home sales: +0.3% (actual) vs. +0.5% (estimate)
Happy trading!
Tom