
EB Daily Market Report - Wednesday, September 30, 2026
Executive Summary
- Futures were higher overnight and our major indices gapped up
- After early morning strength, we've seen prices retreat a bit, especially on the Dow Jones, which has turned negative
- The NASDAQ 100 ($NDX, +0.77%) is showing relative strength, ahead of a key earnings report from Micron Technology (MU, +0.66%)
- The ADP employment report showed jobs a bit ahead of expectations
- The 10-year treasury yield ($TNX) is up 4 basis points to 5.29%, setting a new post-2007 yield high of 5.31% during the day
- Commodities are mostly higher, with crude oil ($WTIC, +1.34%) moving back above $90 per barrel
- Technology (XLK, +1.21%) once again is showing strength and holding up our key indices
- Energy (XLE, +0.47%) is also higher, benefiting from the rising crude prices
- Meanwhile, consumer staples (XLP, -1.16%) are adding to their recent weakness
- Food products ($DJUSFP, -2.08%), in particular, are weak on the session
- The nonfarm payrolls report for September will be out on Friday morning and has the potential to move the needle on U.S. equities
Market Outlook
Despite the higher treasury yields, our major indices continue to show resiliency and impress. Both the S&P 500 and NASDAQ 100 remain quite close to all-time highs just as we wrap up the historically-cautious Q3. Since 1950, here are the annualized returns that the S&P 500 has produced in each "half quarter" since 1950:
- First half Q1 (Jan 1 - Feb 15): +12.96%
- Second half Q1 (Feb 16 - Mar 31): +3.60%
- First half Q2 (Apr 1 - May 15): +14.71%
- Second half Q2 (May 16 - Jun 30): +2.82%
- First half Q3 (Jul 1 - Aug 15): +10.43%
- Second half Q3 (Aug 16 - Sep 30): -4.28%
- First half Q4 (Oct 1 - Nov 15): +16.40%
- Second half Q4 (Nov 16 - Dec 31): +17.11%
Since 1950, the ONLY half quarter to produce negative annualized returns has been the one that ends today - Second half Q3 from Aug 16 through Sep 30. And the two best half quarters have been the next two. History does not provide us a guarantee, but it certainly helps us with a roadmap.
Sectors/Industries
I generally spend time looking for areas of the market that are strong, areas that we should be considering as momentum traders. But just as important as looking for strong areas is avoiding weak areas. Right now, those include many industry groups within the consumer discretionary sector (XLY). These groups will become leaders again, perhaps as soon as Q4, but we need to see uptrends form. Here are a few key industry groups and potential areas where we could see a significant reversal:
Restaurants & Bars ($DJUSRU)
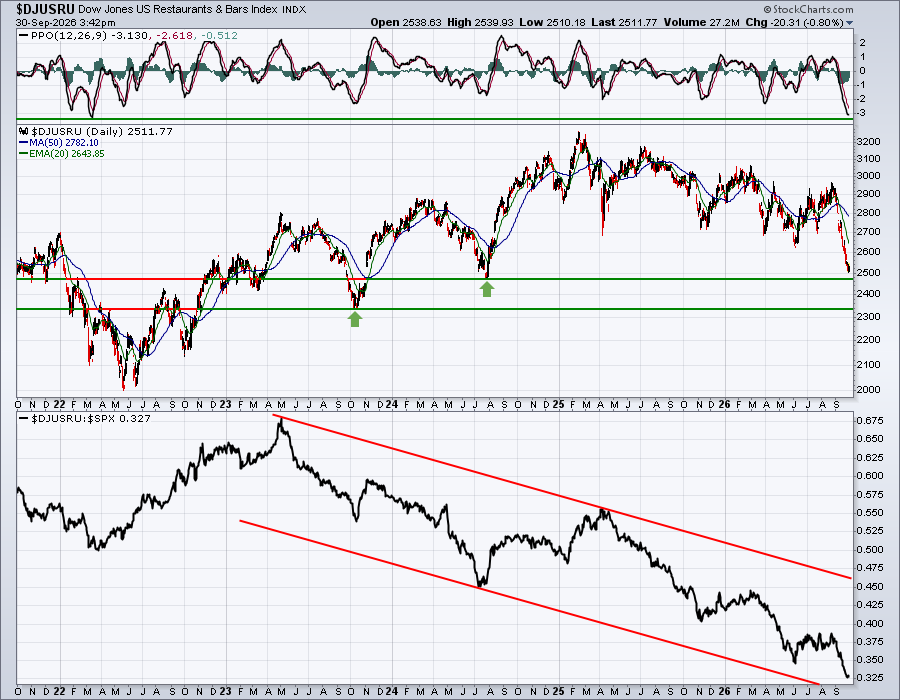
This is about as weak as this group has been at any point over the past 5 years. The daily PPO is very stretched and approaching the extreme PPO reading from the cyclical bear market in 2022.
Home Improvement Retailers ($DJUSHI)
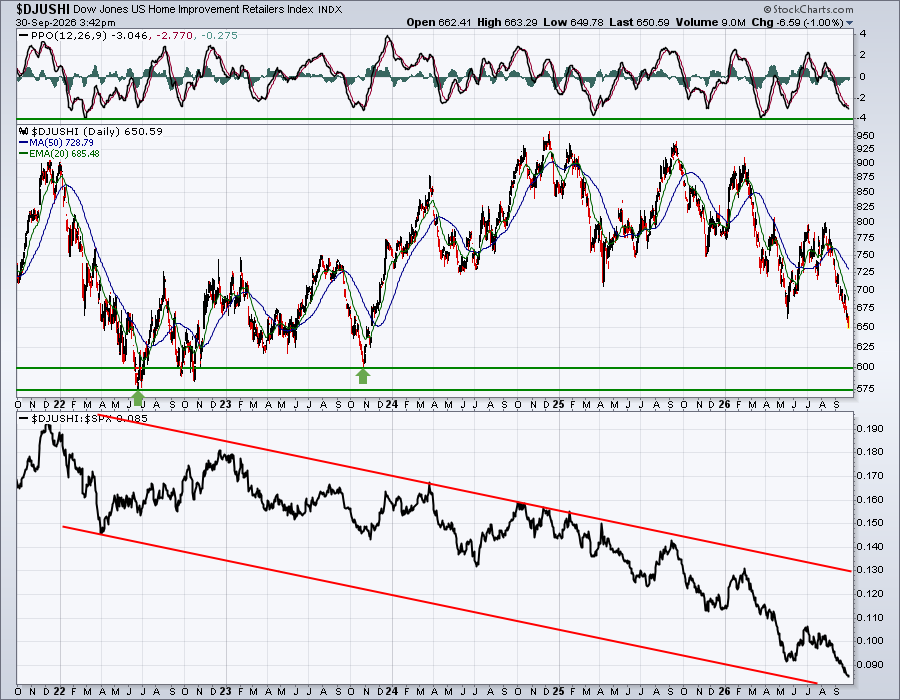
Here's another industry group in freefall. Looking back over the past 5 years and into that 2022 bear market, I'd expect the 575-600 support range to hold. But we could still see another 10% or so drop before reaching that area.
Specialty Retailers ($DJUSRS)
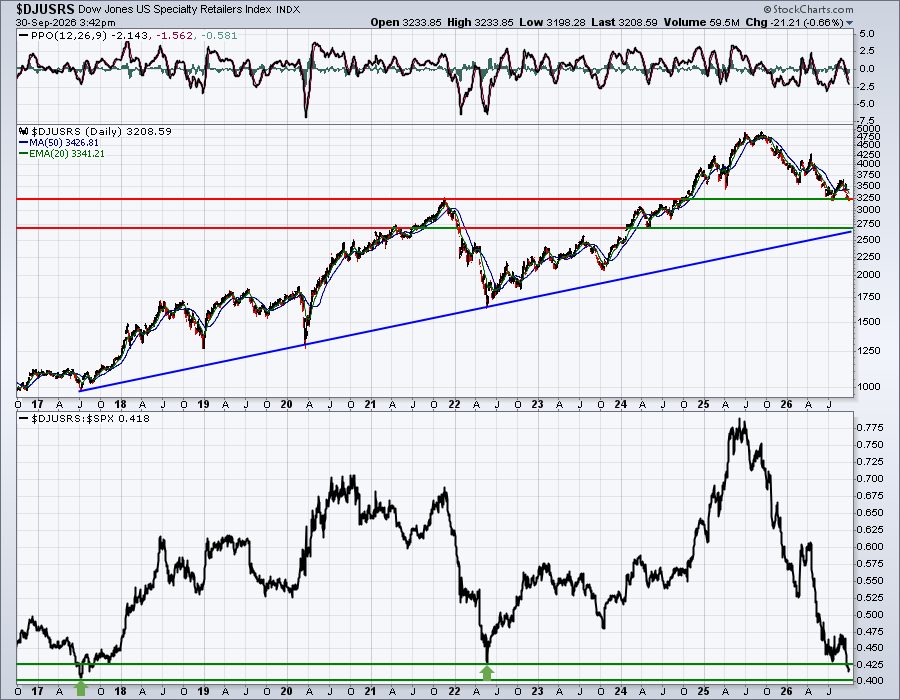
I did a 10-year look-back period on the DJUSRS to establish where the key uptrend line would intersect on the chart. Keep in mind that this group has already fallen from 4800 to 3200, or roughly one-third. There are likely some excellent long-term buys among the group right now, but mostly for value investors, not momentum traders.
ChartLists and Trading Strategies
I'm going to look at two different strategies.
First, from a long-term income-oriented perspective, let's look at Tractor Supply Co. (TSCO), a specialty retailer. From the DJUSRS chart above, we know that this entire industry group is being shunned right now. The good news for a long-term investor is that if you're willing to hold the stock for awhile, you'll likely end up unlocking a lot of value in the stock as it returns to historical norms over the next few years. In the meantime, TSCO's dividend yield of over 3% is very attractive. The key here is that you must have patience and realize that you might not be catching the exact bottom. The group IS out of favor and could see further selling before a floor is found. TSCO was the most recent addition to our Long-Term Trade Setups list on our Weekly Market Report and currently looks like this:
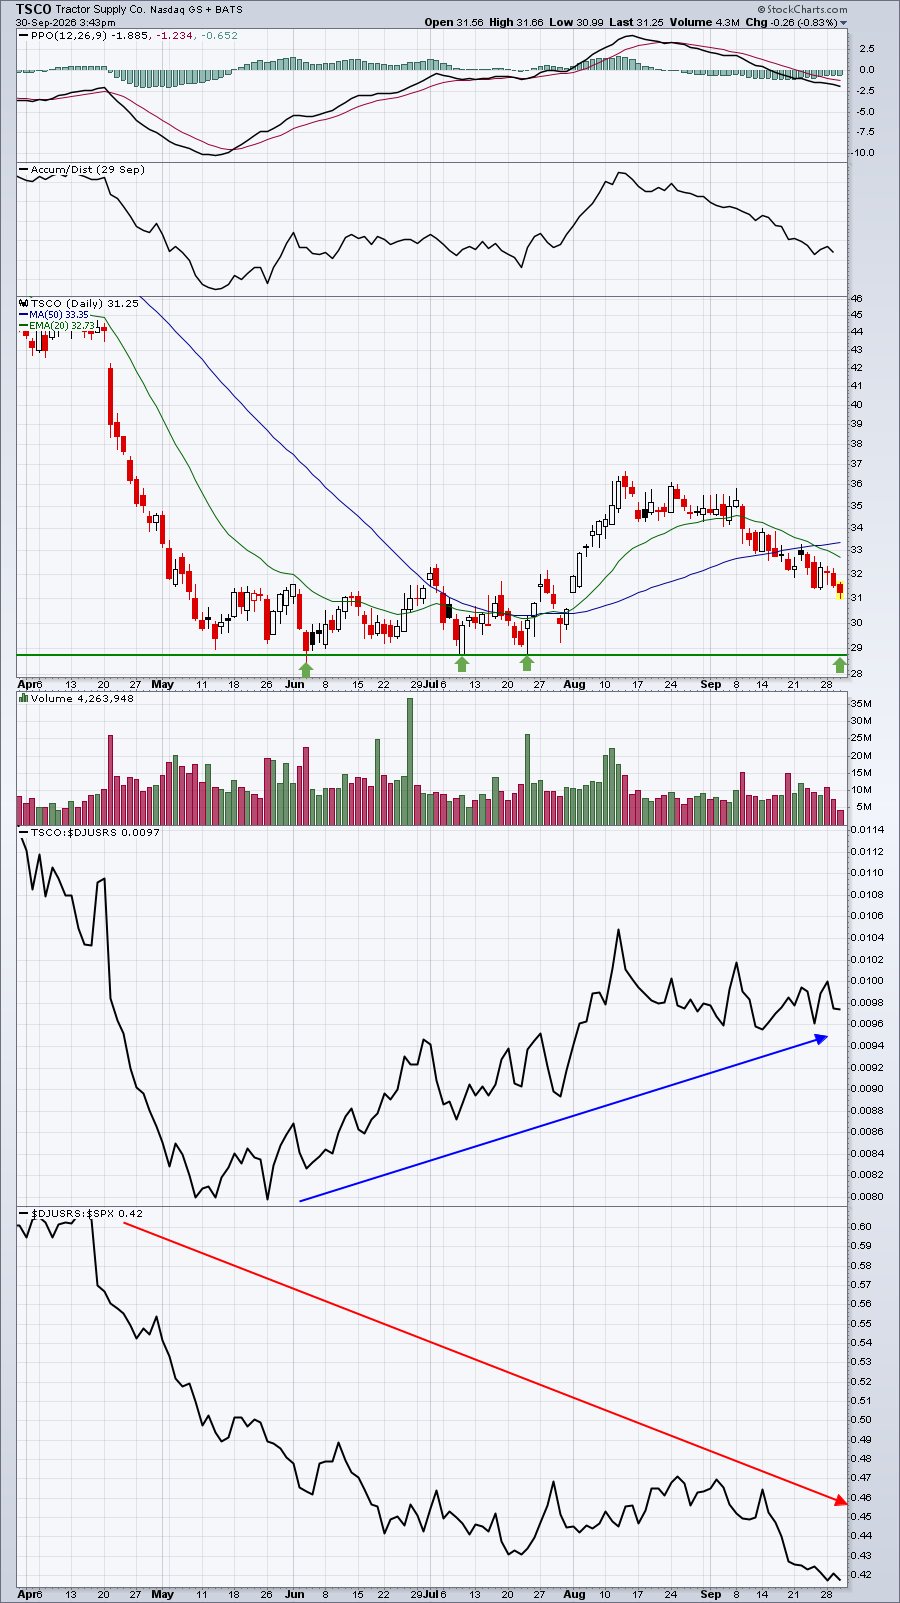
TSCO has begun to show some relative strength among its specialty retail peers, but I would expect to see at least a double bottom form, with TSCO falling back to 29 or just below. Whether it holds that support level likely depends on how weak its peer group trades in the foreseeable future.
The second trade to consider is one that truly needs to work now. During this morning's Live Trading Room, I looked at stocks performing well on several of our ChartLists. One stock that looked particularly interesting was ImmunityBio, Inc. (IBRX), a biotech stock ($DJUSBT). IBRX is on our Short Squeeze ChartList (SSCL). You should consider ANY stock from this ChartList to be extremely aggressive and volatile. To combat that, either don't trade these stocks or consider trading fewer-than-normal shares. Position sizing becomes very important on more aggressive trades.
In order to see a true "short squeeze" stock, we need, at a minimum, much, much heavier volume than normal and a breakout to a multi-month high, which guarantees potentially-panicked short sellers. Without both of those ingredients, I'd question whether a short squeeze is truly underway. IBRX has both of these characteristics, in addition to a strong AD line, and is a member of a very strong industry group. All of these suggest to me that IBRX is a solid candidate for further upside as panicked short sellers are forced to buy higher. I set my chart up differently for short squeeze stocks to highlight volume and to ensure that it's well above average volume. Check IBRX out:
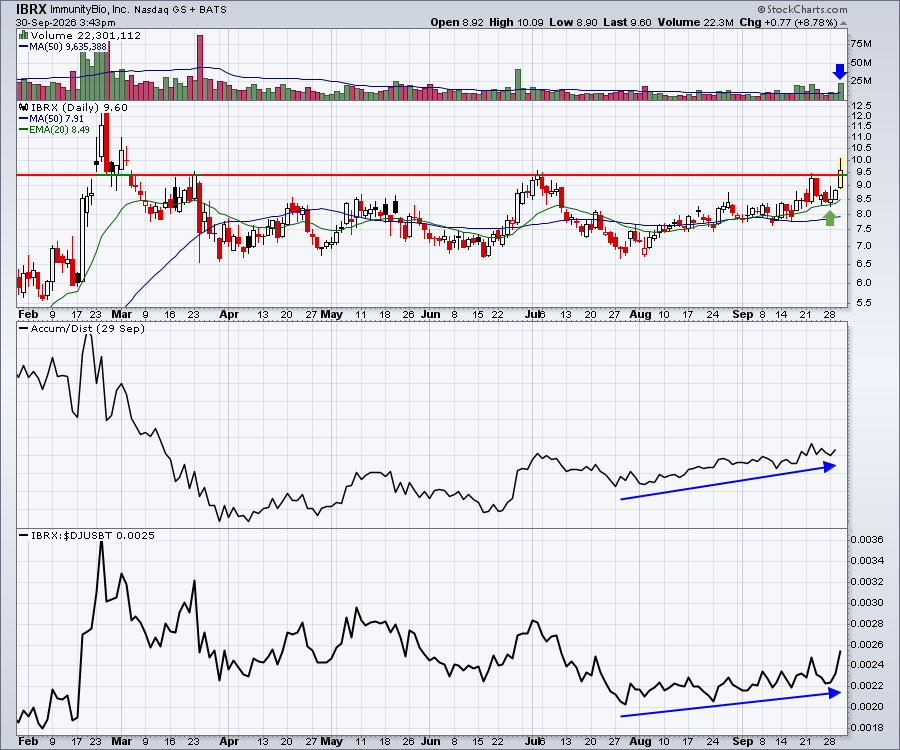
IBRX moved above 10 earlier today, but has settled back just above the key breakout level of 9.44 with an hour left in the trading session. In my opinion, a strong finish into the close would be a more bullish signal than finishing weak and closing at 9.44 or below. You can see that volume is more than double the 50-day SMA and will go higher into the close. Recently, IBRX has experienced higher trading volumes to accompany an uptrend. The rising 20-day EMA has been providing excellent support.
Upcoming Earnings
Upcoming Earnings and Upcoming Earnings Relative Strength ChartLists are produced for EB.com members to track upcoming earnings reports and provide them to you via ChartLists throughout earnings season. We will begin producing Upcoming Earnings ChartLists again on a weekly basis when Q3 earnings season begins in mid-October.
Economic Reports
September ADP employment report: 90,000 (actual) vs. 68,000 (estimate)
Q2 GDP (final estimate): 2.2% (actual) vs. 1.5% (estimate)
August personal income: +0.2% (actual) vs. +0.4% (estimate)
August personal spending: +0.9% (actual) vs. +0.8% (estimate)
August PCE index: +0.3% (actual) vs. +0.3% (estimate)
Happy trading!
Tom