
EB Daily Market Report - Brief Update - October 7, 2026
First, I want to apologize for having to cancel our Live Trading Room this morning. We were having issues with our streaming provider, StreamYard. They indicated they were having problems "streaming to On-Air". Unfortunately, it was totally out of our control. I did have two trades that I was in the process of explaining when we realized a very large number of members were having problems with the stream.
So let me start first with the two trades that I made this morning. The first is one that I wrote about in yesterday's DMR - Sterling Infrastructure (STRL). I indicated yesterday that I liked both PWR and STRL at their rising 20-day EMAs. Here's the chart on STRL:
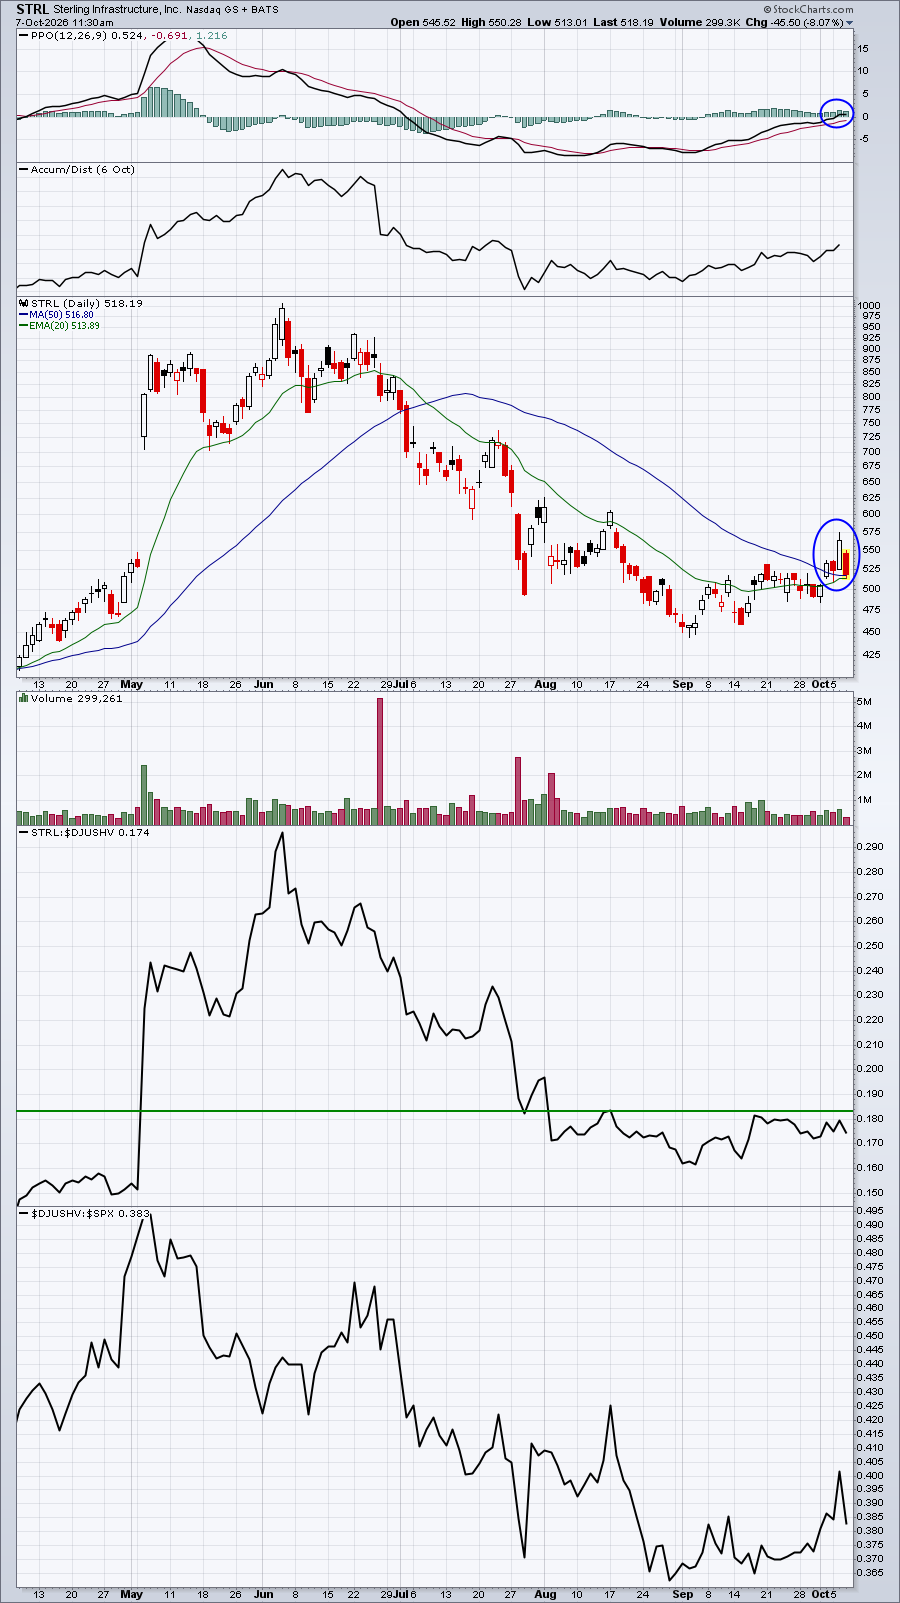
This is the same chart that I highlighted yesterday. I'm expecting STRL to hold the 20-day EMA after finally breaking back above that key moving average over the past week. My strategy was to place two trades, one at 525 and the second at 515, averaging in at 520. I want to see a reversal today on STRL and a close back above the 20-day EMA. If that doesn't happen, I'll exit.
The other trade I placed was on NVIDIA Corp. (NVDA). NVDA finally made a breakout above its May 14th top and high close of 235.20, yesterday hitting an intraday high of 243.37. Today, NVDA has weakened and hit a low of 237 a bit ago. I bought a 1/3 position in NVDA, will buy a 2nd 1/3 at 235 and a final 1/3 on any upcoming 20-day EMA test. Here's what the NVDA chart looks like now:
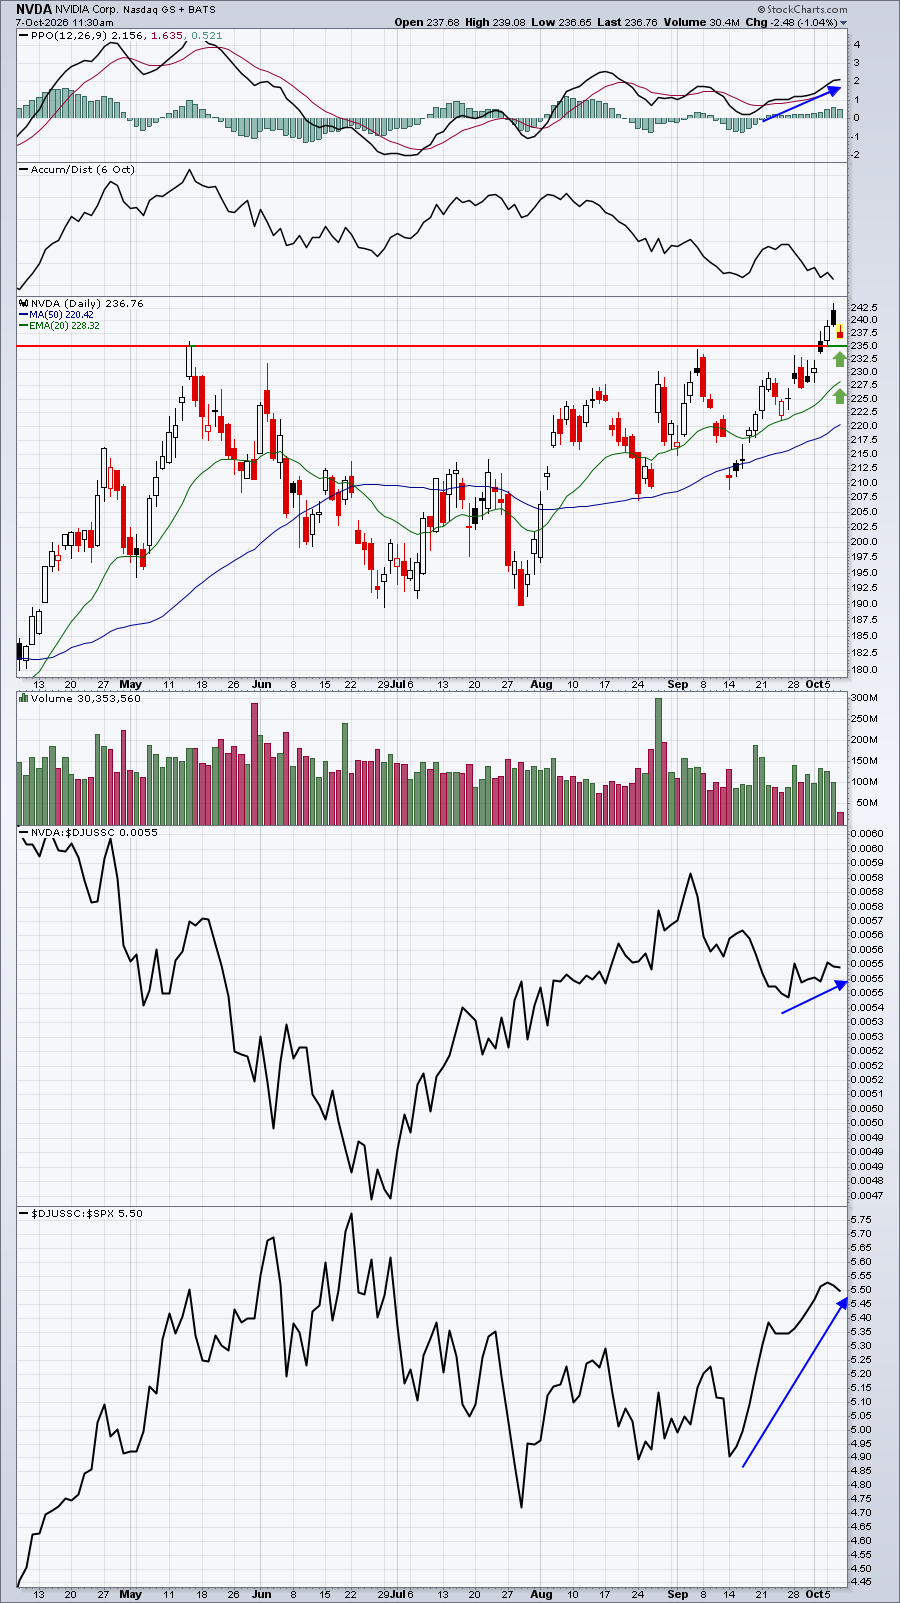
I would prefer a stronger AD line, but NVDA is starting to resume relative strength vs. the semiconductor group ($DJUSSC) and we've seen money rotating recently towards the Mag 7 stocks, which NVDA is a part of.
On to today's market action....
I'm a bit worried about a potential short-term top in the S&P 500 with this morning's gap down below its prior breakout level. This is a classic island reversal. This topping pattern appears by first gapping higher after an extended uptrend. It's followed by a gap lower the next day to leave the topping candle on an "island". Here's what it looks like:
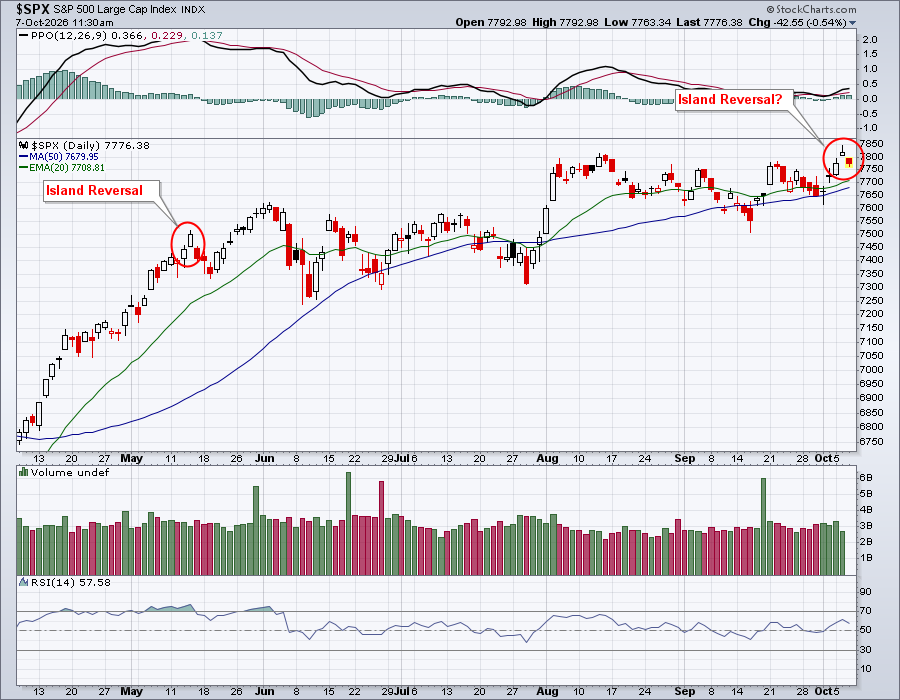
Don't be overly alarmed. First, this pattern hasn't confirmed. A reversal back to the upside later today, with the S&P 500 trading and/or closing inside yesterday's candle would negate the pattern. Also, it's a very short-term signal. You can see the signal provided back in mid-May. Selling lasted for a total of 3 days and there was no technical breakdown. The S&P 500 simply needed a brief rest and it got it.
The 10-year treasury yield ($TNX) moved above 5.36% for the first time since reaching a high of 5.46% in early April 2002, surpassing the 5.32% high from June 13, 2007. It has reversed and is at 5.30% at last check. That hasn't stopped spooking small caps (IWM), however, which is getting hit the hardest once again today, down 1.4% at last check.
Interest-rate-sensitive areas are mostly under pressure again today, with homebuilders (XHB, -3.15%) and regional banks (KRE, -1.92%) lagging considerably.
Meanwhile, health care (XLV, +1.46%) is strong with money rotating into pharmaceuticals ($DJUSPR, +2.00%) and biotechs ($DJUSBT, +1.51%).
The FOMC minutes will be out at 2:00pm ET today and surely will be scrutinized, so watching to see how those interest-rate-sensitive areas react after 2pm is high on my list of stock market "To Do's".
Happy trading!
Tom