
EB Daily Market Report - Tuesday, October 20, 2026
Executive Summary
- Futures were a tad lower this morning, but we saw significant strength after the market opened
- Much of that strength was concentrated in small caps (IWM, +1.57%), which is trying to rebound off 269-270 price support
- The 10-year treasury yield ($TNX) fell 6 basis points earlier to 5.07%, but has since rebounded to 5.12%
- Relative weakness continues to be felt in the tech-laden NASDAQ 100 ($NDX, +0.23%)
- Leadership is in defensive areas today, with health care (XLV, +2.30%) and real estate (XLRE, +1.66%) on top of the sector leaderboard
- Meanwhile, energy (XLE, -0.51%) is lower as crude oil prices ($WTIC, -0.93%) fall back below $103 per barrel
- Pharmaceuticals ($DJUSPR, +3.50%) are nearing a 52-week high, aiding the health care sector
- Airlines ($DJUSAR, +3.08%), which typically love Q4, are rebounding after a very rough first half of October
- General Motors (GM, -7.23%) reported Q1 results this morning and beat estimates and announced a MASSIVE $20 billion buyback; nonetheless, it's the biggest loser on the S&P 500 today
Market Outlook
Sometimes, the stock market acts absolutely CRAZY during October. This morning was a prime example, in my opinion. General Motors (GM) reported excellent quarterly results, though it did acknowledge that prices were pressuring margins. But the announcement of a $20 billion buyback is one of the largest I've ever seen. The market cap of GM is only $67 billion, so this buyback represents 30% of the value of the company. I typically view a "10% of market cap" buyback as a large buyback, so 30% is absurdly high. That shows tremendous confidence in the company on the part of management. GM, however, is the worst-performing stock on the S&P 500 today.
Keep in mind that today's announcement provides GM the authorization to buy back shares. It's not a promise to do so. Still, providing management the opportunity to buy back 30% of its outstanding shares is very meaningful to me. It's a statement that GM believes their shares are undervalued and that, if left undervalued, they plan to pour money into the company to boost shareholder value. GM, in the recent past, has bought back an unusually high number of shares and this strategy has boosted EPS.
Despite GM's weakness, automobiles ($DJUSAU, +0.81%) are higher on the session with Tesla (TSLA, +1.56%) gaining ground, while Ford (F, -1.11%) falls in sympathy.
Sectors/Industries
I want to discuss leveraged ETFs a bit. I like to trade 3x leveraged ETFs frequently, but I usually only do so when I can keep a fairly tight stop to manage my risk somewhat effectively. There are many who like to buy and hold these leveraged ETFs over long periods of time. You have to be extremely careful and understand the risks of doing so.
The first risk of holding leveraged ETFs is that they erode over time. Let me show you what I mean. Let's say you bought the IWM back at its double bottom and test of support when it hit 270:
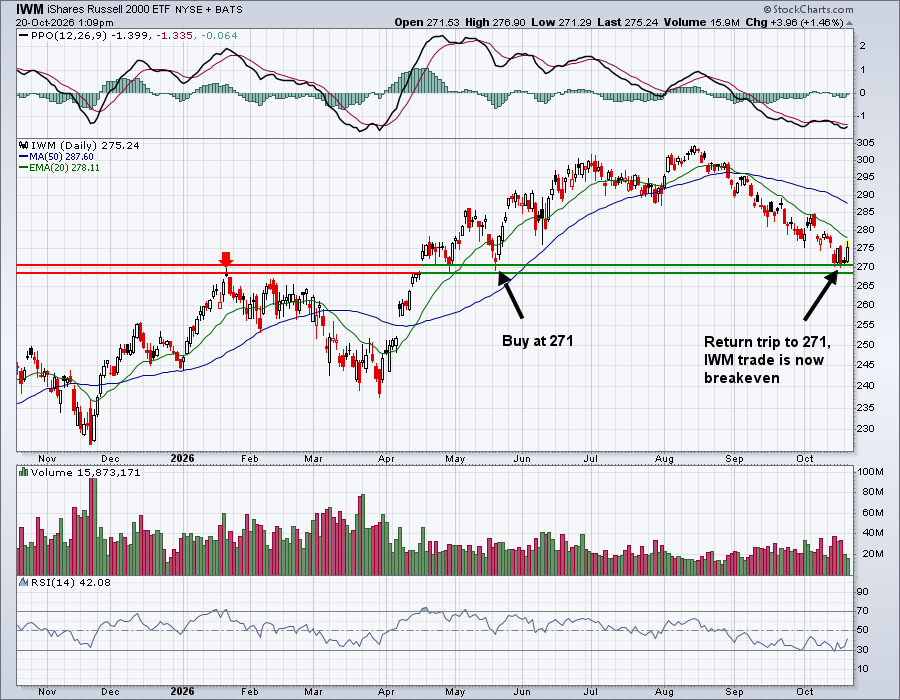
After 5 months, IWM has moved up, then down, and now is right back at 271. That's breakeven, not losing any money.
Now I want you to check out what would've happened had you bought the 3x leveraged ETF (TNA) that's designed to track the IWM at a 3 to 1 clip:
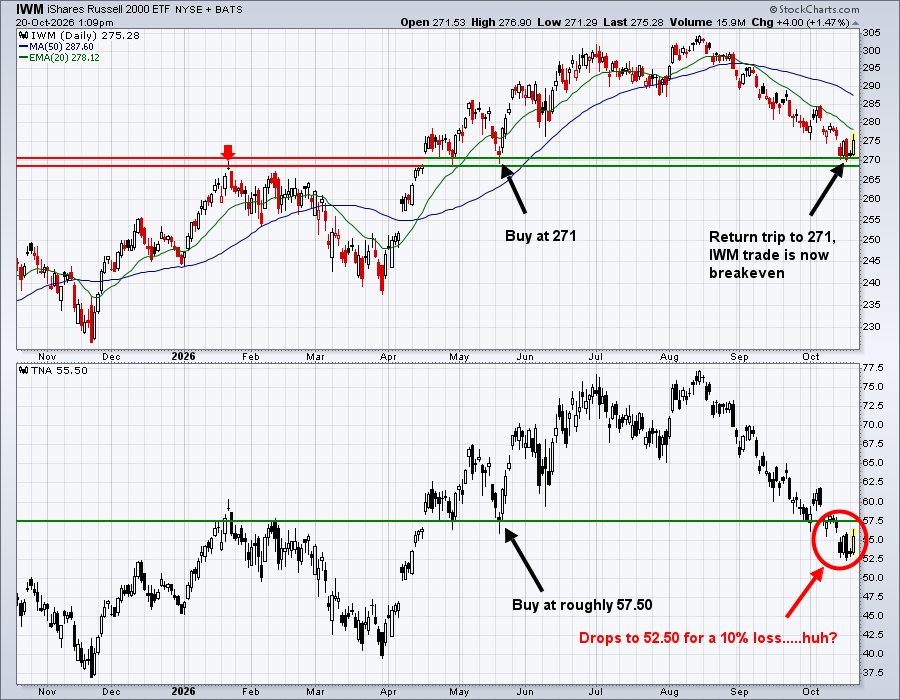
If the IWM loses 0% and you own a 3x leveraged ETF (TNA) that tracks the IWM, then it makes sense that the TNA would also be down 0%. But it's NOT! It's down 10%, because these leveraged ETFs lose value over time, much like options.
That's lesson 1. But there's another lesson here.
Lesson 2: NEVER buy the TNA based on its own price chart and basic technical analysis strategies. It trades based on the IWM, so ALWAYS buy/sell the TNA based on what the IWM chart is doing. So when the IWM hit support at 271, it was potentially time to buy the TNA at 52.50, even though that price level showed a price breakdown on the TNA chart.
Now, given all of this, it's worth noting that the SOXX is hitting key price support, which means the 3x leveraged ETF (SOXL) could represent a buy as well. Just understand that this industry group is EXTREMELY VOLATILE, meaning that its 3x leveraged ETF (SOXL) could be psychotic in its movement. Still, here's the chart for those willing to take on a very high risk trade:
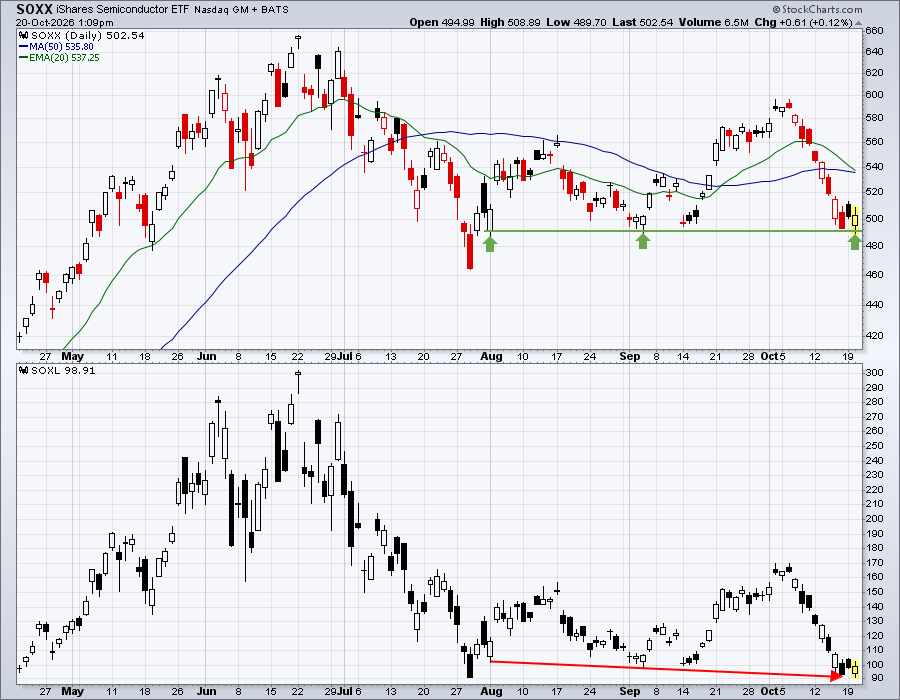
Notice that at each price support level on the SOXX, the 3x leveraged ETF (SOXL) is lower, again highlighting the fact that these leveraged ETFs ERODE over time.
ChartLists and Trading Strategies
I actually took a position today in our EB Digest stock from this morning, Forgent Power Solutions, Inc. (FPS). FPS reported excellent results in mid September and significantly raised its revenue and EPS guidance for 2027. At that time, FPS gapped up, then traded as low as 29.50 that day, before soaring to a high of 39.94 just 3 days later on some of the heaviest volume since the stock went public in February 2026. This morning, FPS actually moved a nickel lower than that 29.50 low from mid September, touching 29.45. It's bounced from that low. I am using that 29.45 as my stop (likely intraday stop, but could be closing stop depending on circumstances). The bottom of gap support is 28.64 for those who consider entering the stock and wanting to give the stock a bit more downside room.
Here's a copy of the chart that we sent out this morning in the EB Digest:
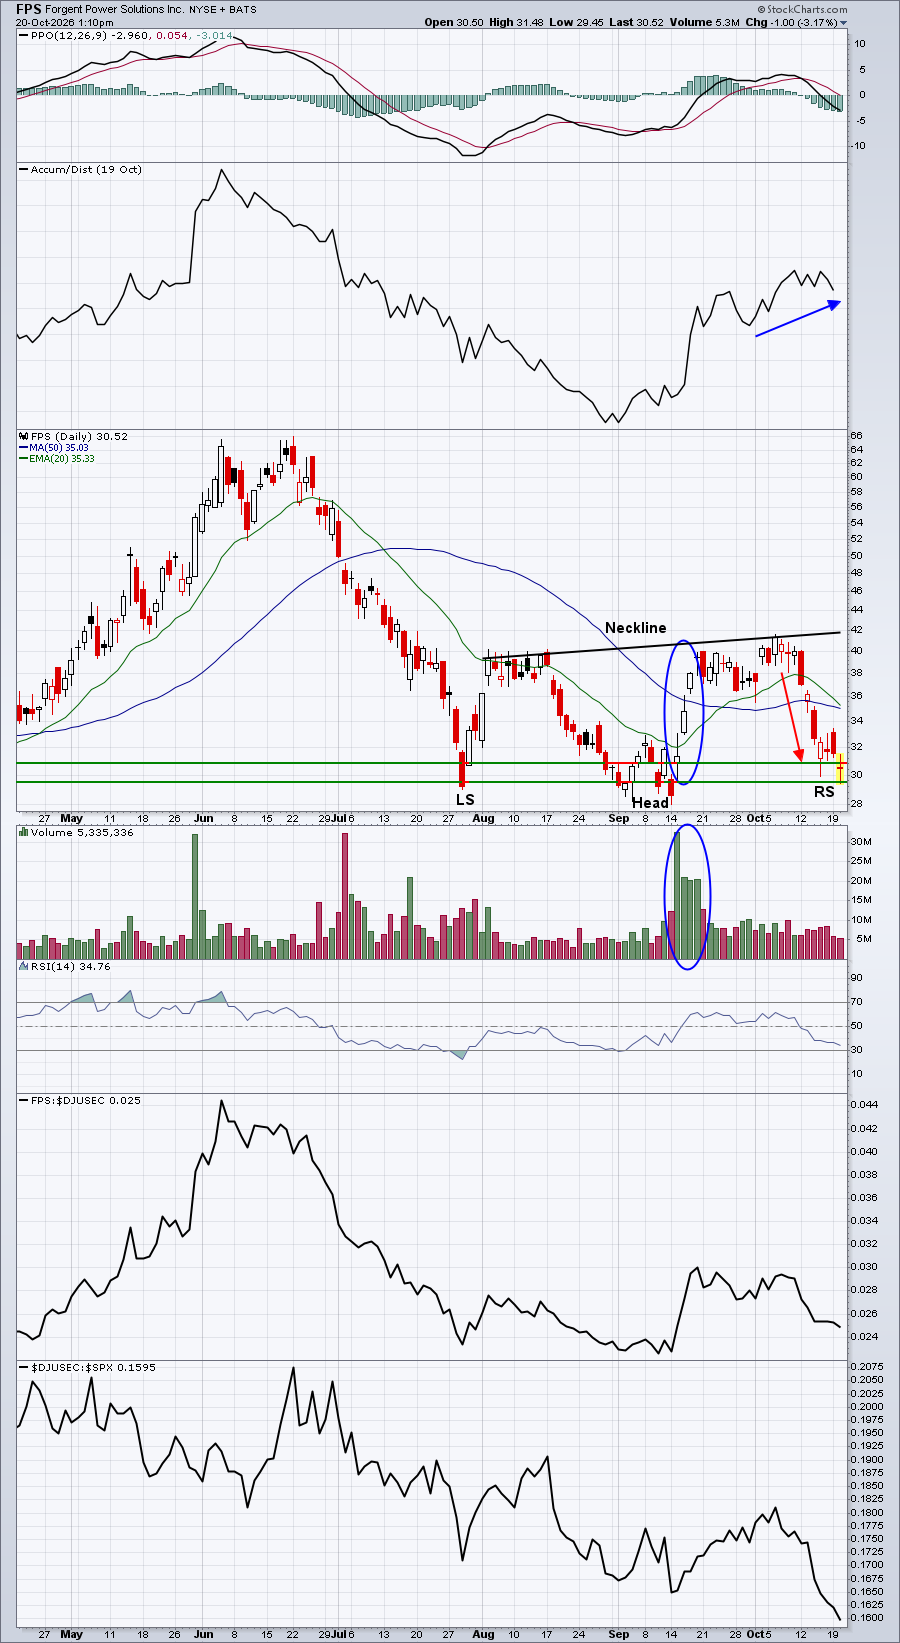
Please keep in mind that we never view technical analysis as a means to guarantee a certain outcome. Instead, we use technical analysis to manage risk. That's a very important distinction. Allowing stocks to return to key support doesn't mean they'll hold support, especially in a weak market environment. But having patience and taking advantage of those types of pullbacks helps me manage the risk I'm taking, in the event the trade doesn't work. If I had chased FPS in mid September and bought in the upper 30s, I'd be staring at a 25-30% paper loss right now, and be much more likely to panic trade on emotion. It's easier to maintain my emotional level if I buy closer to support.
Upcoming Earnings
Upcoming Earnings and Upcoming Earnings Relative Strength ChartLists are produced for EB.com members to track upcoming earnings reports and provide them to you via ChartLists throughout earnings season.
Economic Reports
September housing starts: 1,221,000 (actual) vs. 1,300,000 (estimate)
September pending home sales: -7.3% (actual) vs. -0.4% (estimate)
Happy trading!
Tom