
EB Daily Market Report - Wednesday, October 21, 2026
Executive Summary
- Futures were higher overnight and our major indices gapped up
- Cryptocurrencies are gaining ground, with bitcoin ($BTCUSD, +2.68%) nearing 85000 once again
- The 10-year treasury yield ($TNX) is down 1 basis point to 5.11%
- Crude oil ($WTIC, -0.77%) remains in an uptrend, but has pulled back from its recent high near $102 per barrel
- Technology (XLK, +1.82%) is leading the market action today as 7 of 11 sectors move higher
- Consumer staples (XLP, -0.67%) is the weakest sector as consumer discretionary (XLY, +0.47%) increases its recent relative outperformance
- Semiconductors ($DJUSSC, +2.18%) are bouncing off August and September price support
- AT&T, Inc. (T, -6.39%) is struggling after reporting its quarterly results, despite beating both revenue and EPS estimates; Netflix (NFLX, -4.65%) is doing the same
- Charles River Lab (CRL, +9.73%) leads the S&P 500 as it breaks out to another 52-week high
Market Outlook
I talk a lot about sustainability ratios, intermarket relationships, sentiment readings, seasonality, etc., but please keep in mind these should always be viewed as "secondary indicators". There is only ONE primary indicator and that's price action. No matter how bad our secondary indicators might look, they always remain secondary to price action. The ultimate confirmation of market troubles comes in the form of price breakdowns. When I speak of secondary indicator issues, I'm simply raising the "risk flag". As secondary issues mount, you simply need to understand that the risk of investing is growing. It does NOT mean that we have a guarantee of a lower stock market ahead. This is an important distinction, because our goal is never to provide guarantees or market performance or profits. Our goal is to successfully manage risk.
I believe everyone's "default", when it comes to investing, should be to remain 100% fully invested. I believe we do ourselves a major disservice to always try to call market tops and worry about everything going on in the world. Price action will ultimately tell us when to worry. And our secondary indicators will warn us of impending risk BEFORE price action weakens.
Our market guidance, in my humble opinion, is second to NONE. There's a reason for it. We do a TON of research. I've spent much of my adult life studying the stock market. I ignore the media 100% of the time. I know what works in forecasting market action and what doesn't. Politics doesn't. Debt levels don't. Wars don't. No one can predict the stock market and get it right every time. We certainly haven't. But I do think we come as close as anybody. I believe in what we do.
It is so emotionally difficult to ignore everything going on around us and remain 100% optimistic. But I like sticking with research and a process with an excellent track record.
While I can never rule out a short-term selloff, I can say, with a lot of confidence, that the S&P 500 is heading higher. How we get there and how high we go are difficult to predict, but I see little rotation from the big money on Wall Street that suggests an impending correction or bear market. Given that backdrop, I find it easier to sleep at night and remain invested - from a long-term perspective.
Sectors/Industries
Most areas within consumer discretionary (XLY) that are bouncing currently are doing so from very oversold levels. Restaurants & bars ($DJUSRU) and home construction ($DJUSHB) are two that quickly come to mind. There are a couple industry groups within this sector that do look strong, however. Check out hotels ($DJUSLG):
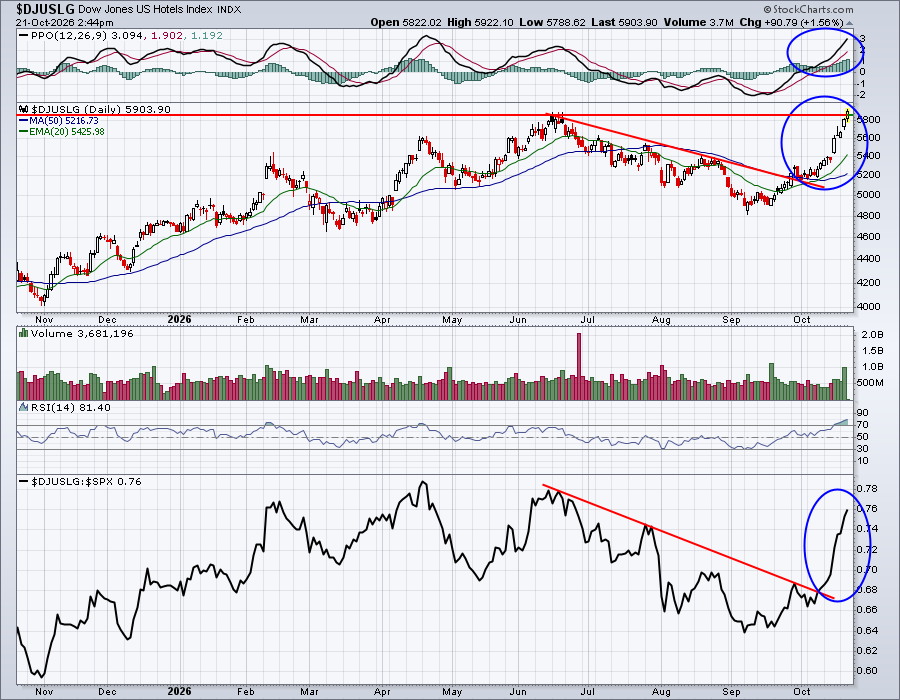
It may be a unicorn at the moment, but hotels are potentially breaking out to an all-time high today. That's at least a start for the very weak consumer discretionary group. Perhaps a few other industries in this space will begin to follow suit.
ChartLists and Trading Strategies
Now that earnings season is underway again, I just want to point out the Upcoming Earnings ChartLists that we provide for every upcoming week. These ChartLists are organized and I'll focus on today's Upcoming Earnings ChartList (10/20 AMC - 10/21 BMO) to explain how we do it:
Yesterday's earnings reports, after the market closed (AMC), are included with the earnings reports that came out this morning, before the market opened (BMO). That way, all of the earnings reports out AFTER one day's close and the NEXT DAY's open are on one ChartList. You can simply glance at the Summary View of a ChartList to see EVERY stock that's reported its quarterly results since the prior day's close. For instance, here's a quick glance at the companies that reported since yesterday's close:
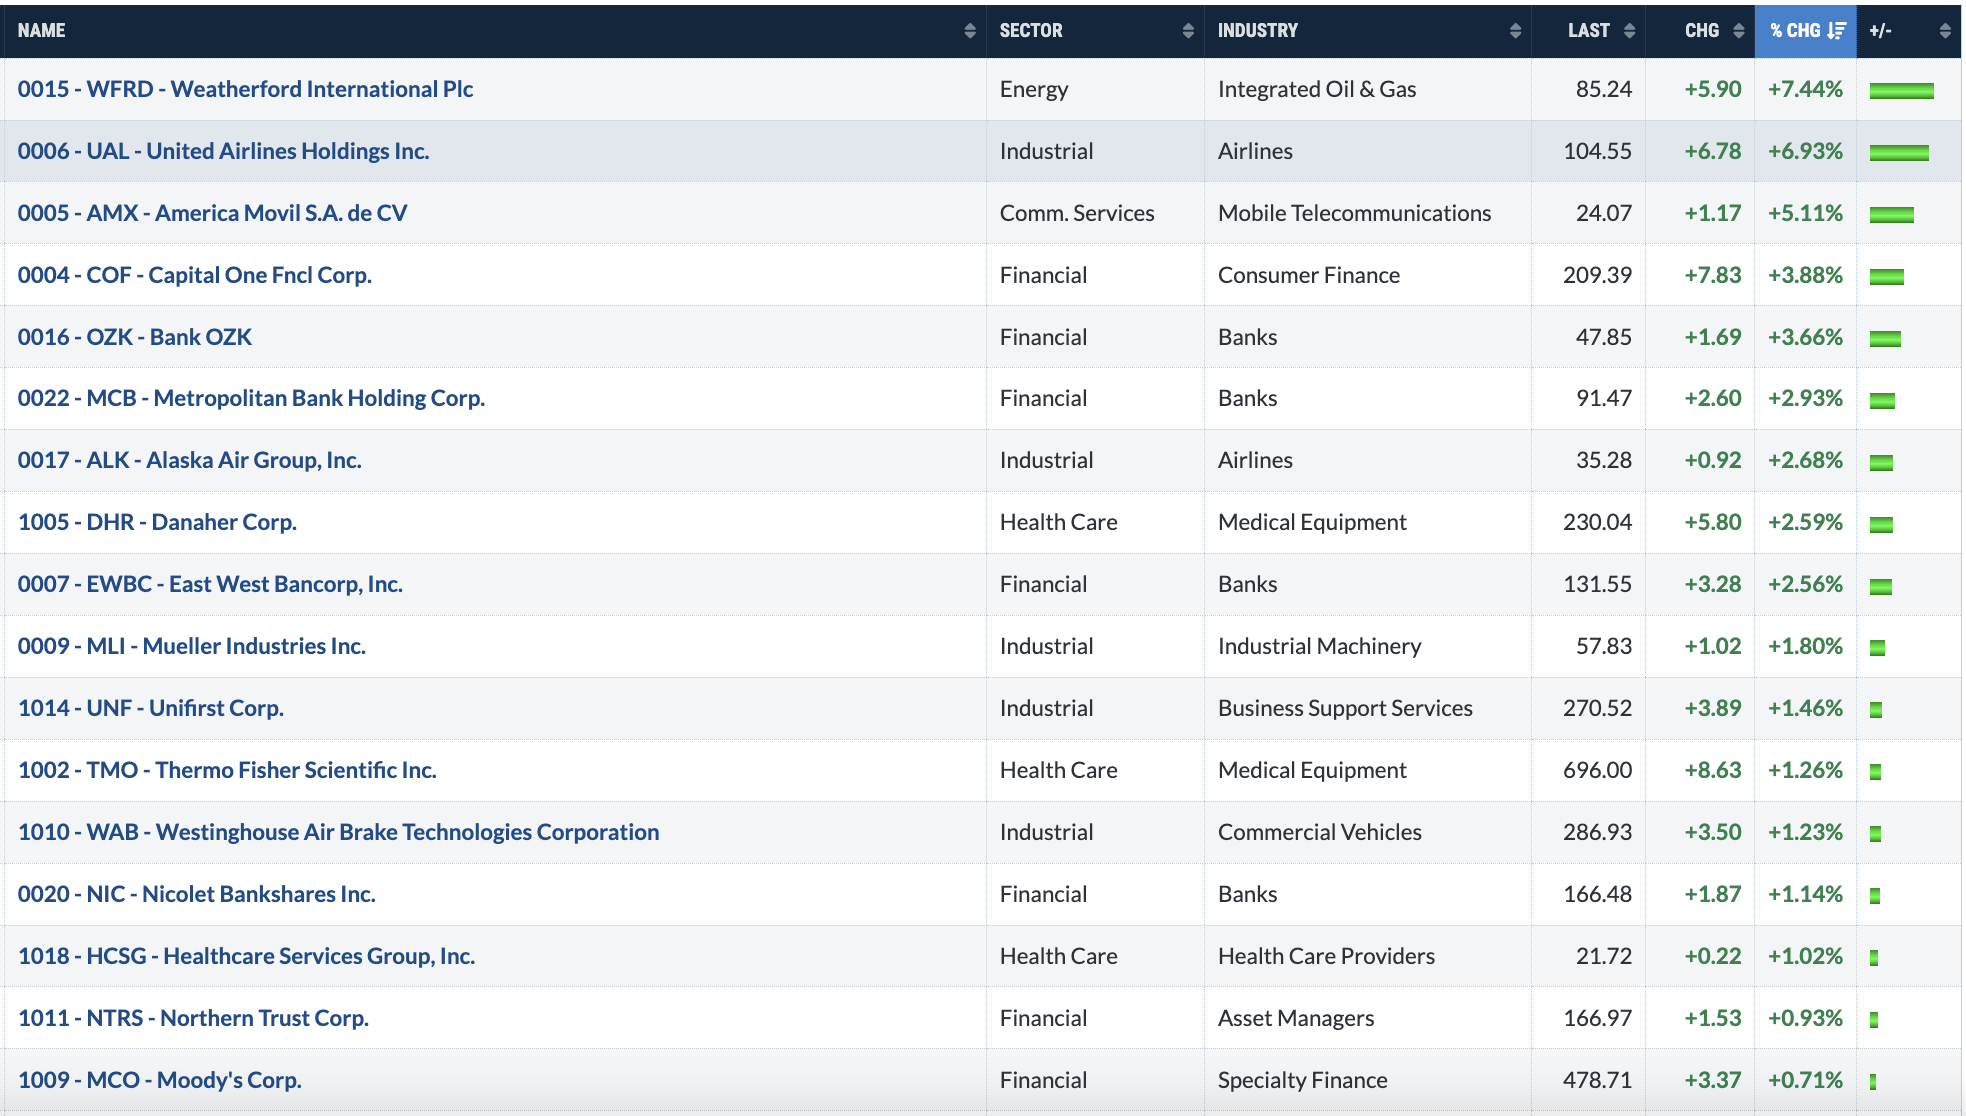
There are 43 companies included on this ChartList and the above shows you the top reactions to those reports. Next, I'm going to sort them in number order and explain how the ChartList is set up:
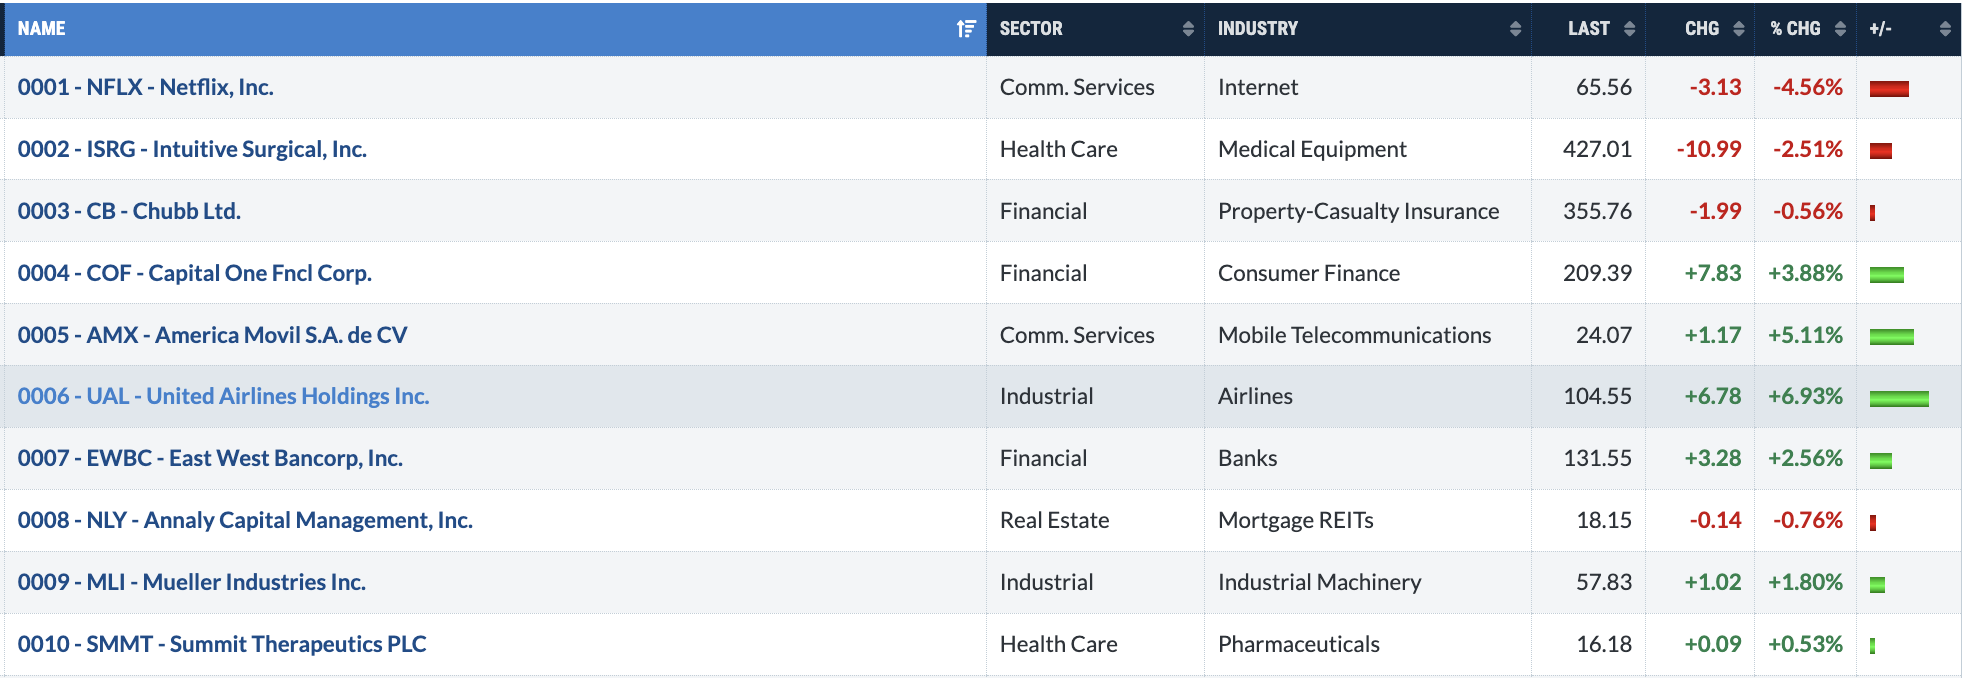
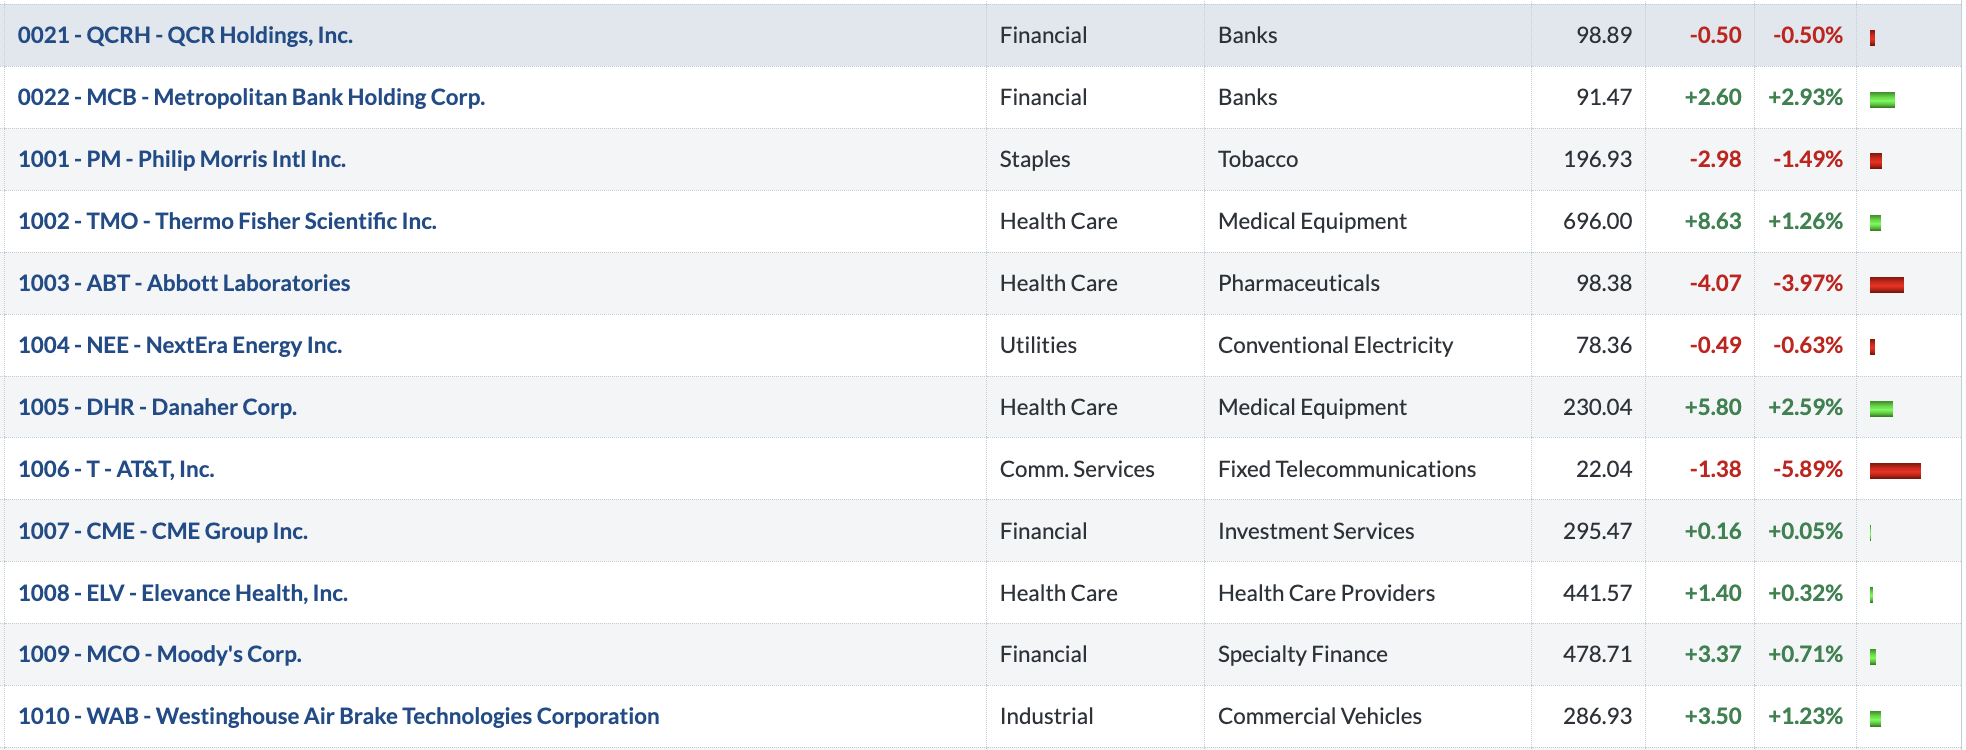
There are too many companies to show you the entire ChartList in just one image. So I've broken down the ChartList into two images. We start numbering at the top of the ChartList with "0001", which is Netflix (NFLX). Companies that report results in the afternoon, after the market close, always start with a "0". Then they're listed in market cap order - largest company to smallest. We do not include any company with a market cap of less than $1 billion.
The companies that start with a "1" like Phillip Morris (PM) in the second image, which starts with "1001", means that it will report the following morning, before the market opens. These companies are also listed in market cap order - largest company to smallest. So this ChartList tells us that 43 companies with a market cap > $1 billion will be reporting between 10/20 AMC and 10/21 BMO. It's a quick summary to see how companies that have just reported results are performing. That saves you the time of pulling up 43 stocks individually.
We also provide a Upcoming Earnings Relative Strength ChartList, which lists EVERY company that reports during the week. The chart for every stock is in relative price (vs. its industry group) format. When you glance at it, you can tell if a company has been trending higher or lower, relative to its peer group, as it heads into earnings. I believe companies trending higher and showing relative strength have a much better chance of reporting solid results and, potentially, seeing a better market reaction after earnings are released.
As an example of one such company this week, let's look at Thermo Fisher Scientific, Inc. (TMO) and how it was performing vs. its medical equipment ($DJUSAM) peers prior to releasing its earnings this morning:
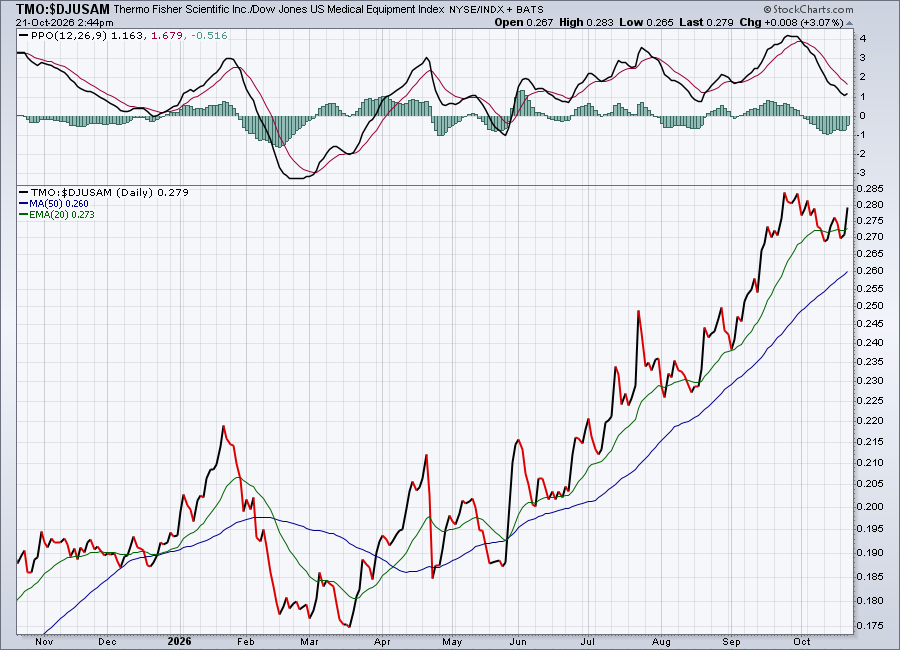
TMO has been an excellent relative performer, suggesting a strong earnings report. This morning, TMO reported revenues and EPS above expectations, but it gapped down, which is actually one of my favorite trades. I love a company that looks strong, reports great results, and gaps lower. I look for key support or a morning reversal to enter. Here's how the TMO chart looks now:
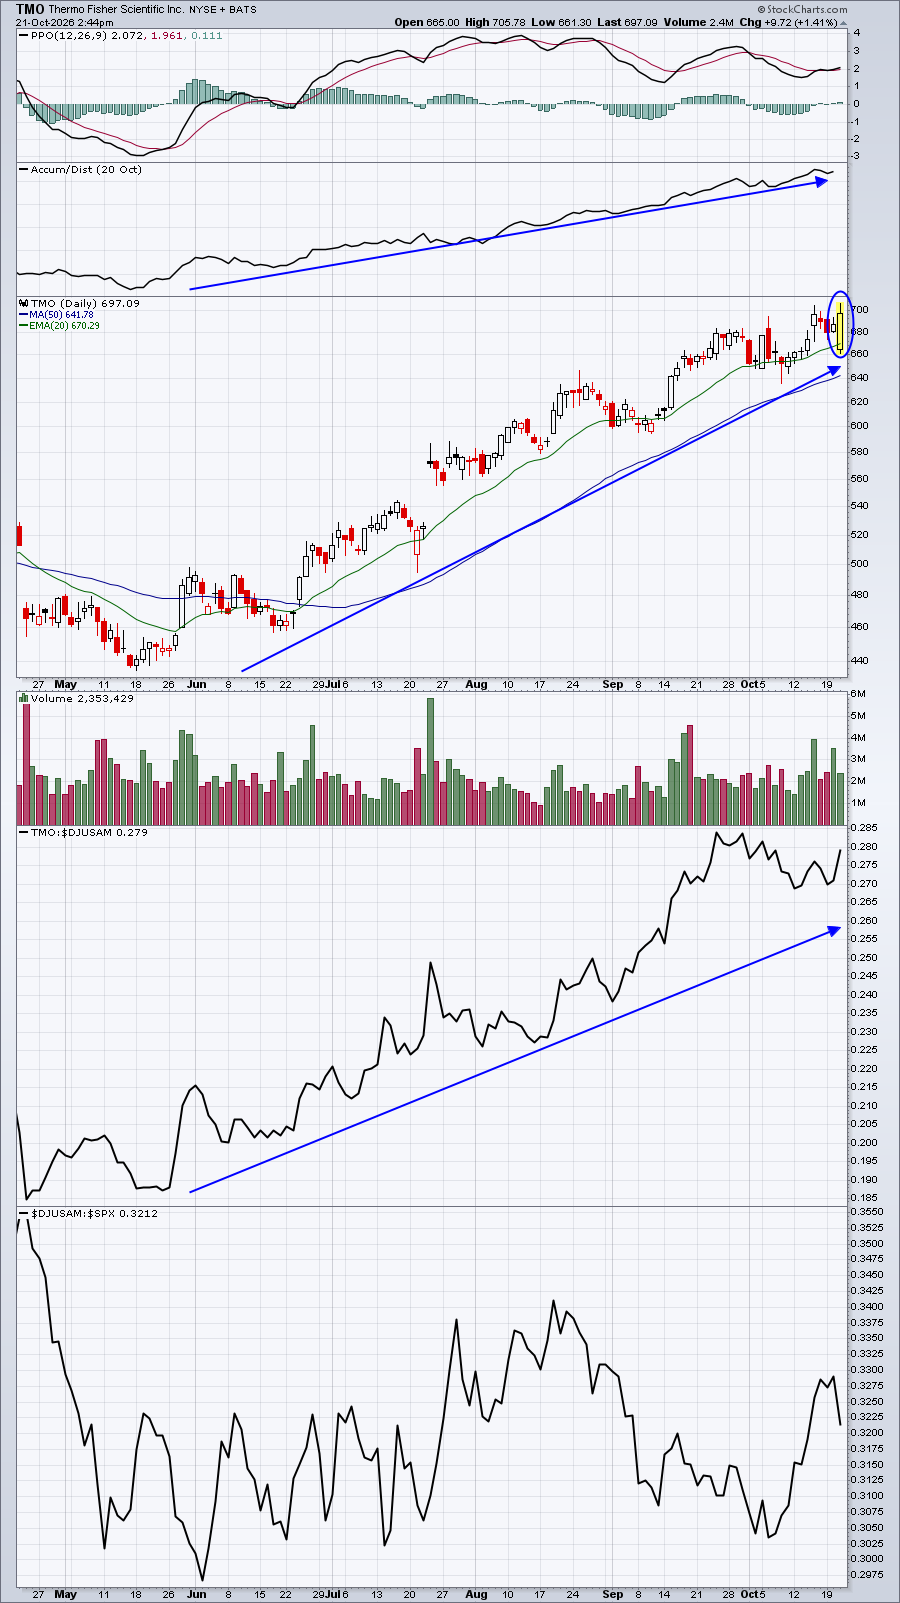
The AD line is rising, relative strength is excellent, and price action continues to bounce within a solid uptrend. Perfect. Seeing a really solid stock like TMO gap lower at the opening bell typically produces a trading opportunity for me. I just don't expect a company this strong to stay down for long. After TMO opened this morning at 666.14, it moved above 700 in roughly 15 minutes. There's a very good chance that market makers took advantage of anyone selling on the initial weak market reaction. That's one way that they accumulate inventory of a stock.
Upcoming Earnings
Upcoming Earnings and Upcoming Earnings Relative Strength ChartLists are produced for EB.com members to track upcoming earnings reports and provide them to you via ChartLists throughout earnings season.
Economic Reports
None
Happy trading!
Tom