
EB Daily Market Report - Brief Update - Thursday, October 22, 2026
First, we've changed the date of our Model ETF Portfolio Draft to Monday, October 26th, at 5:30pm ET. We're in the midst of a very bearish historical period, so we've decided to let this period play out before re-entering our Model ETF Portfolio. We plan to enter our ETFs selected as of the close on Tuesday, October 27th, the final day of the current bearish historical period (10/21 close - 10/27 close). I will provide you one hint about potential surprises on Monday.
Airlines tend to perform exceptionally well in Q4 and into Q1, so there's a reasonable chance we'll include the airlines ETF (JETS) in our portfolio next quarter. We try to spice up our Model ETF Portfolio returns by selecting one theme or industry group. Last quarter, we included bitcoin (GBTC) and cybersecurity software (HACK). They turned out to be our #1 and #2 performing ETFs last quarter. JETS might be an ETF we fly with in the next quarter. More on that on Monday.
As far as today's action, it's notable that the 10-year treasury yield ($TNX) has plummeted again, this time 19 basis points to 4.96%, our first dip below 5.00% since September 23rd, one month ago. As a result, we're seeing relative strength in small caps (IWM, -0.24%), regional banks (KRE, +2.48%), homebuilders (XHB, +2.99%), and transports ($TRAN, +1.76%). Odds of another rate hike at the next Fed meeting on October 27-28 are currently pegged at just under 20%. Given that there are no major economic reports surrounding jobs or inflation prior to next week's meeting, I'd be very surprised to see the Fed hike again. Instead, if the Fed hikes again, it'll likely be the December meeting. We'll have more jobs and inflation data prior to that meeting.
Semiconductors ($DJUSSC, -4.93%) are having another very rough day, but I do wonder how much of this is truly distribution and how much is manipulation. Let me give you an example of one semiconductor stock that MIGHT BE massively manipulated - Silicon Motion Technology (SIMO). Let's look at the stock just now hitting the top of major gap support:
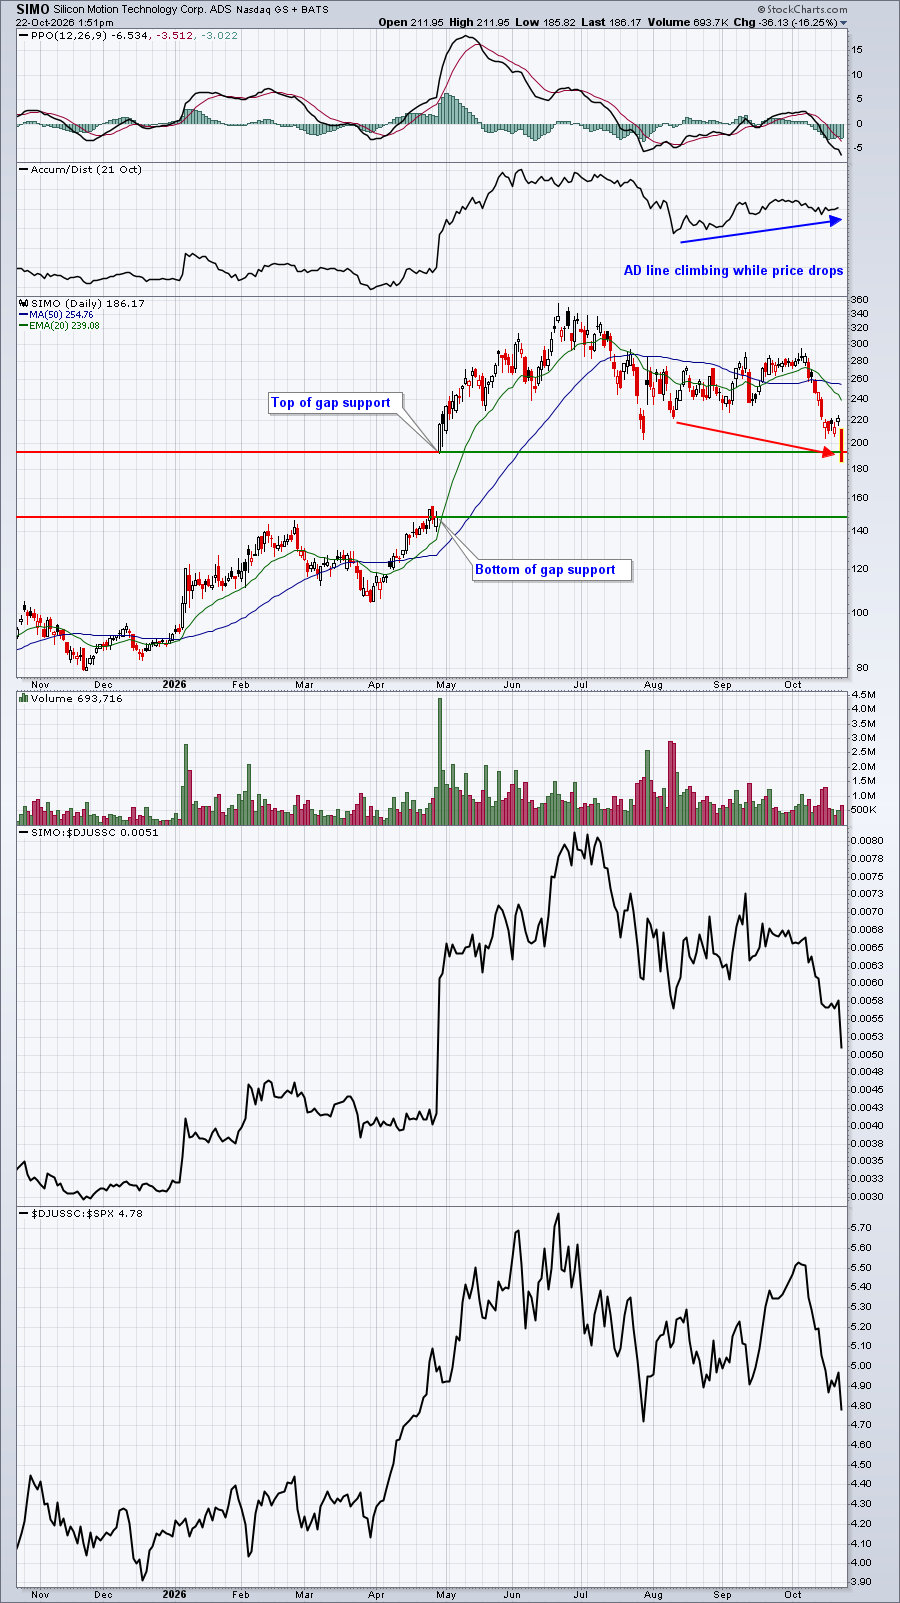
The AD line is rising, which is somewhat suspicious to me. But let's talk numbers and how SIMO has traded during this October decline. On October 6th, SIMO closed at 284.96. Since that time, and through yesterday's close at 222.30, SIMO lost 62.66. The breakdown of how those dollars were lost, however, is what is fascinating. Check this out:
- Opening gaps (cumulative since Oct 6th): -30.05
- 9:30-10:00: -35.90
- 10:00-11:00: +28.55
- 11:00-2:00: -32.40
- 2:00-4:00: +7.52
This is how SIMO has cumulatively traded during each time frame since that October 6th close and through yesterday's close. The interesting part is that SIMO lost a TOTAL of 62.66 during this period, and ALL of it was during the opening gap (-30.05) and the first 30 minutes of trading (-35.90). I call this "amateur hour", because I believe retail traders panic as market makers sweep prices lower in early trading. This allows market makers to buy into that weakness and build inventory.
I'm NOT saying that SIMO is a great buy. Rather, I'm simply pointing out a method used by market makers to MANIPULATE us into selling. If you've been a long-time member of EarningsBeats.com, then you likely remember when I called the market bottom on June 17, 2022, during that cyclical bear market. One of the reasons for that call, and a primary reason, was that I believed the market was being heavily manipulated with gap downs and significant early morning losses.....followed by much more stable action throughout the balance of the day.
I am seeing a lot of semiconductors trading in the same manner right now. Given that the market is historically weak through next Tuesday, October 27th, perhaps we'll see semiconductors soon make a "miraculous" (sarcasm intended) recovery as we move into a much more bullish time of the year.
Just some food for thought.
Happy trading!
Tom