
EB Daily Market Report - Wednesday, October 28, 2026
Executive Summary
- Futures were up slightly overnight and our major indices have been up fractionally throughout much of the session
- Leadership comes in the form of energy (XLE, +0.70%), as crude oil prices ($WTIC, +2.90%) spike to $103 per barrel
- Financials (XLF, +0.40%) are solid, with banks ($DJUSBK, +0.80%) moving up into today's Fed decision, which left rates unchanged
- Roughly half of the sectors are lower, led by real estate (XLRE, -0.92%)
- Consumer stocks are mostly lower, with home construction ($DJUSHB, -1.55%) a bit nervous as it digests another Fed decision
- Gold ($GOLD, -0.55%) is down and now threatening a key 4000 per ounce support level - more on this below
- The 10-year treasury yield ($TNX) is up by 5 basis points to 5.05%, jumping a bit after the Fed announcement
- Earnings reports will accelerate over the next 1-2 weeks as both Alphabet (GOOGL, +1.29%) and Microsoft (MSFT, -0.67%) get set to report results after the close today
Market Outlook
The leaves have turned bullish as the most bullish historical period of the year starts today. The S&P 500 has risen 67 of the past 76 years when you compare its close on October 27th to its close on January 18th. In addition, the October 27th close through the November 5th close has produced annualized returns of +67.29%. That bullishness grows as we move to the NASDAQ, then the small cap Russell 2000.
Let's look at the Seasonality Chart for the S&P 500 since the current secular bull market was confirmed in 2013:
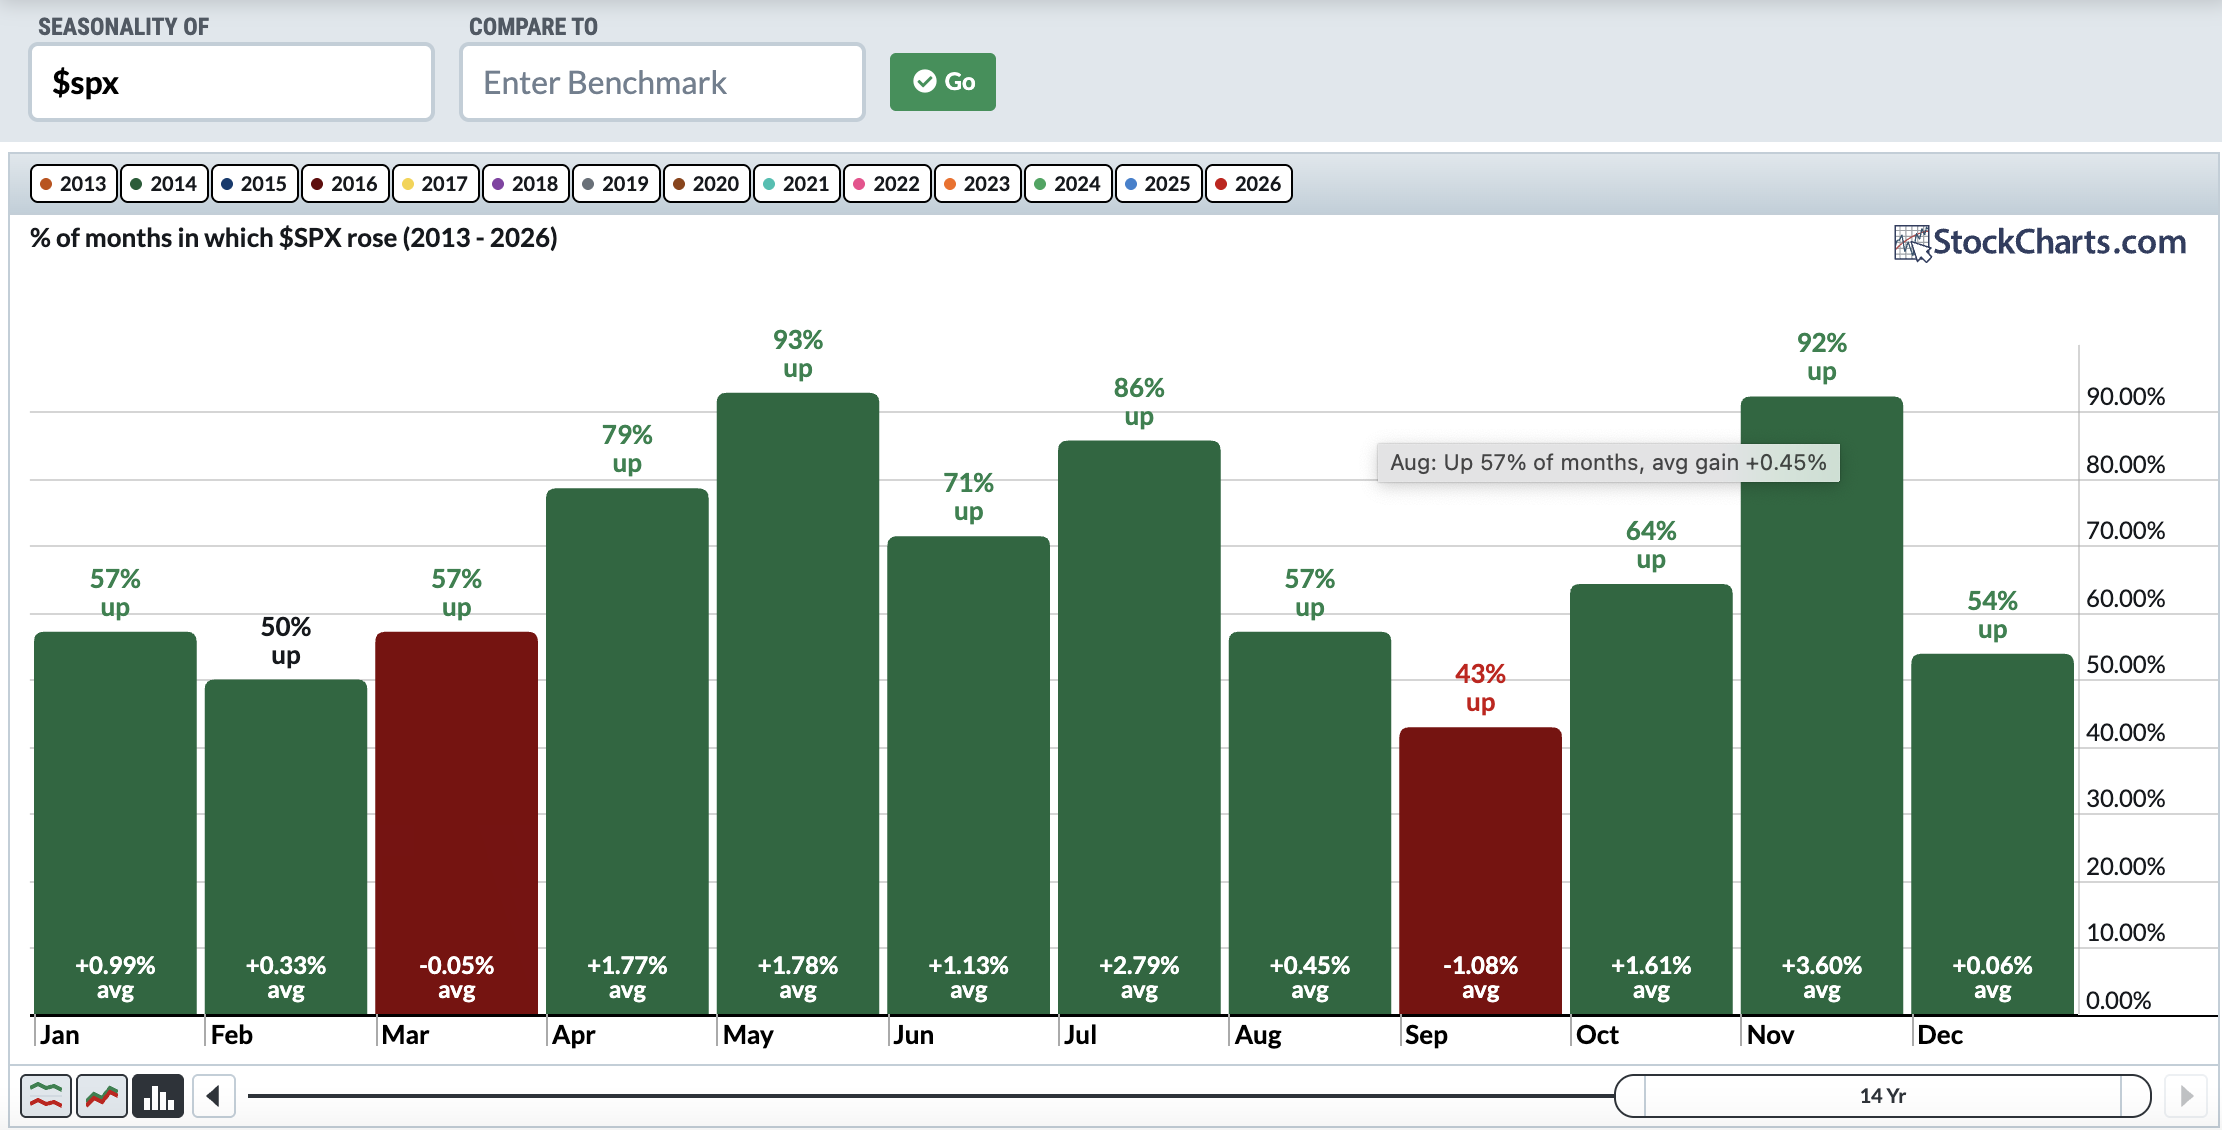
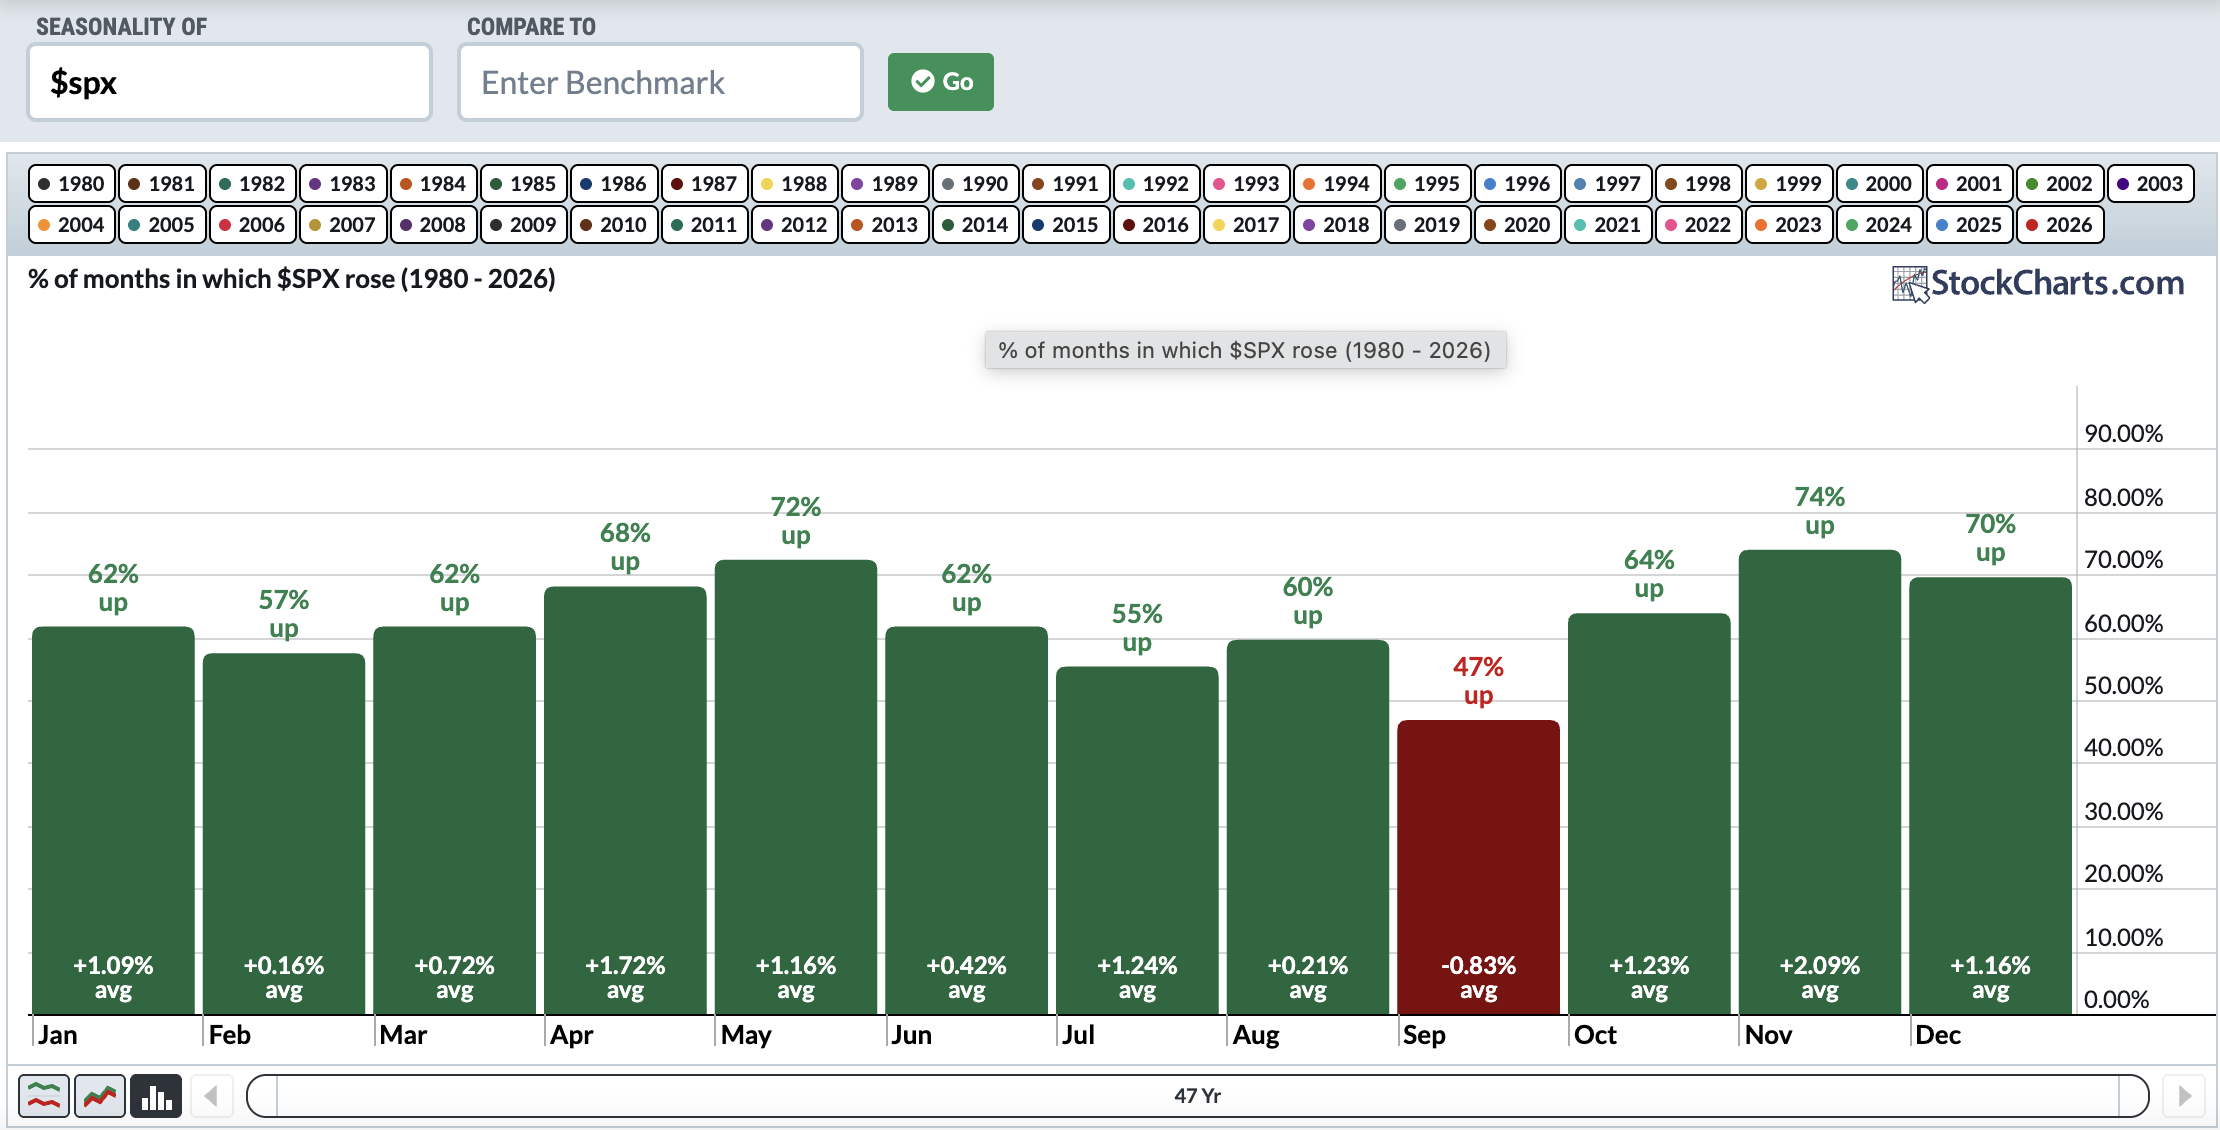
November has been the strongest month throughout this secular bull market advance. But it's not just a recent streak. November has been the best month on the S&P 500 dating back to the 1970s. Here's the seasonal history dating back 47 years:
Sectors/Industries
After bouncing in August, gold ($GOLD) has resumed the downtrend that began in January 2026. It's now approaching 4000 per ounce, which mostly held as support in June/July:
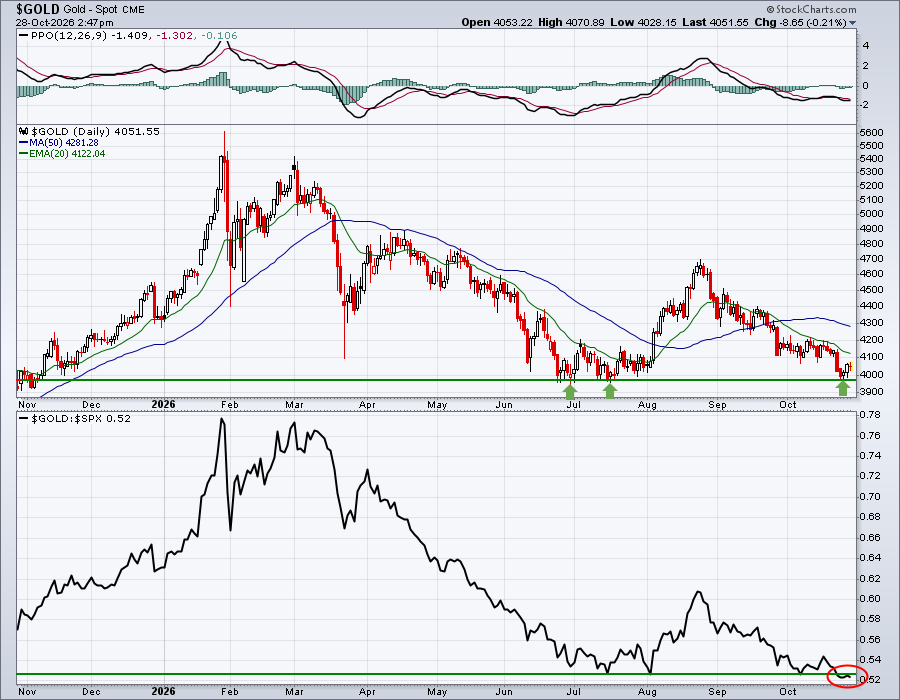
The U.S. Dollar has been trending higher since the gold top in January, providing headwinds for gold. The Volatility Index ($VIX) drifting lower since March hasn't helped the yellow metal either.
ChartLists and Trading Strategies
Given the 14-year secular bull market that we remain in, and the most bullish historical period of the calendar year now underway, my strategy will be to remain primarily invested into the new year. I'm comfortable trading the ETFs that track our major indices and switch over to individual stocks when conditions (ie, pullbacks) suggest doing so.
Upcoming Earnings
Upcoming Earnings and Upcoming Earnings Relative Strength ChartLists are produced for EB.com members to track upcoming earnings reports and provide them to you via ChartLists throughout earnings season.
Economic Reports
FOMC meeting ends, no change in the fed funds rate
Happy trading!
Tom