
EB Daily Market Report - Wednesday, November 4, 2026
Executive Summary
- Futures were volatile overnight as election results poured in
- Our major indices gapped higher and value-oriented areas (IWD, +2.51%) benefited the most, rising throughout today's session
- Meanwhile, growth (IWF, +0.63%) was higher, but clearly well behind its value counterparts
- The Dow Jones ($INDU, +3.03%) exploded 1550 points higher at last check, led by 3M (MMM, +9.52%), Microsoft (MSFT, +7.15%), and Amazon.com (AMZN, +6.85%)
- Cryptocurrencies are joining U.S. stocks and rallying; bitcoin ($BTCUSD, +3.06%) is back above 80,000
- Crude oil ($WTIC, -7.77%) is now below $89 per barrel, testing lows from 4-6 weeks ago
- Consumer discretionary (XLY, +4.41%) and consumer staples (XLP, +3.78%) are both much higher as investors are placing bets on a strengthening consumer ahead
- Energy (XLE, -5.07%) is the clear loser from the election, though high-growth technology stocks are right there as well
Market Outlook
Election results saw Democrats regain control of the Senate and House of Representatives and, while the initial reaction overnight saw loads of volatility, especially among aggressive growth stocks, the market reaction today has been mostly positive - especially outside those growth stocks. Health care (XLV) and consumer staples (XLP) extended rallies deeper into all-time high territory as the Dow Jones has soared over 1500 points. Financials (XLF) and materials (XLB) also forged into record territory today. Consumer discretionary (XLY), left behind throughout much of 2026, continues to surge higher and has quickly moved within 1% of all-time highs.
The S&P 500 has not reached all-time high territory as it is a market-cap weighted index and the hit in technology (XLK) weighs more heavily on this index. The NASDAQ 100 has even more exposure to technology, and growth stocks in general, and is badly underperforming, though it was still higher at last check today.
Semiconductors (SOXX) remain under heavy selling pressure and today reached its rising 50-week SMA for the first time since climbing above it in June 2025:
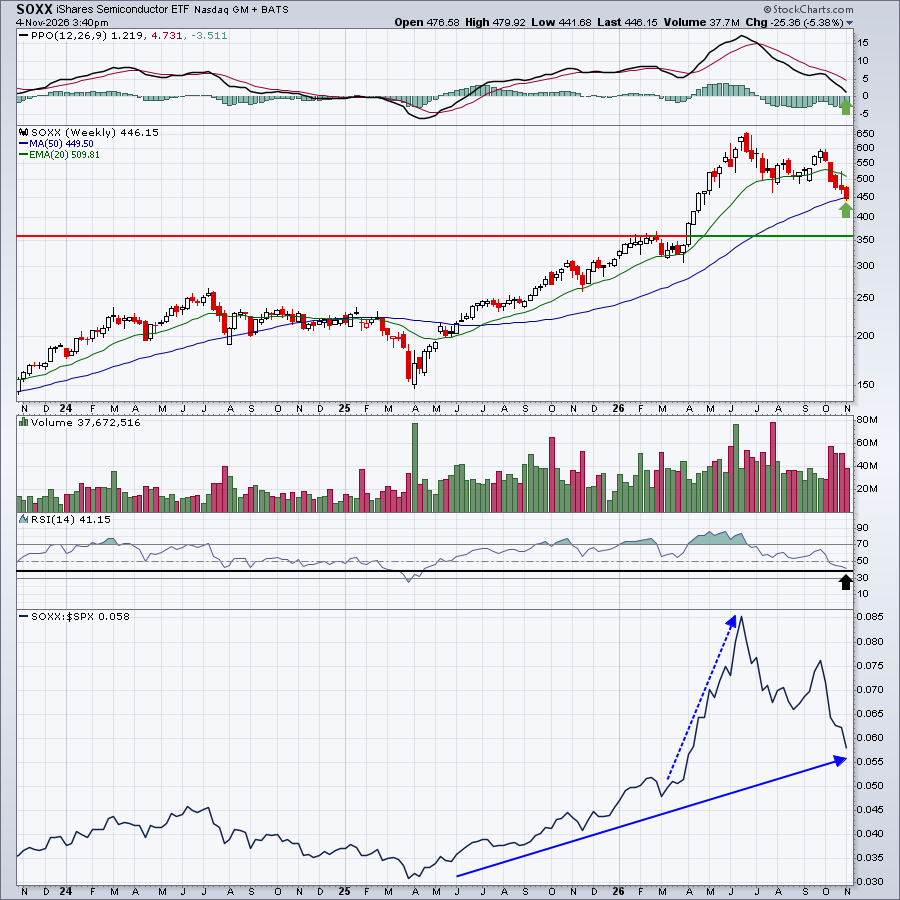
Technically, I'm watching to see if buyers step up here. The 50-week SMA is an important technical support level on the longer-term weekly chart. The weekly RSI is also nearing 40, which is an important level during uptrends.
The blue-dotted directional line shows the almost parabolic relative strength in technology and now we're seeing the effects of that relative strength unwinding. The good news is that money is rotating strongly into the many sectors identified above, creating new all-time highs there.
Sectors/Industries
While it might be somewhat disappointing to see technology stocks performing so poorly on a relative basis, we should also remember that it's not unusual at all for technology to weaken during Q4. We've seen that plenty of times in the past. I do love the fact that consumer discretionary is soaring off of its last multi-year trendline test:
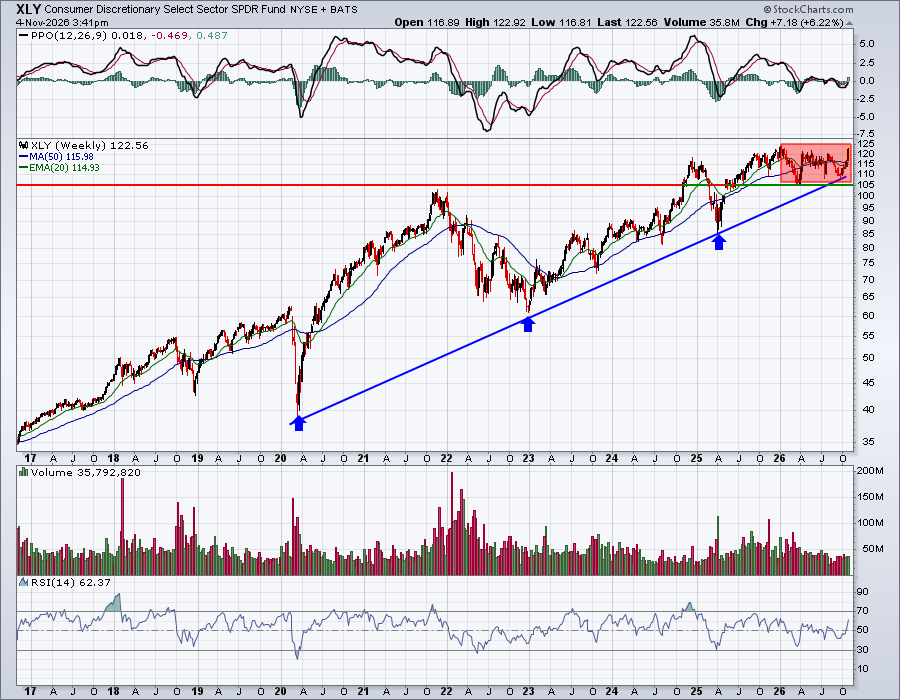
This is the exact chart that I featured 3 weeks ago on October 13th. While we're still seeing consolidation, the XLY has rallied strongly and is within a "stone's throw" of a new all-time high.
So while technology might be a concern, watching rotation favor consumer discretionary is quite encouraging.
ChartLists and Trading Strategies
We've had a number of member requests for annotations of our 20 November seasonal stocks on winning streaks. I sent those symbols out in the November Seasonality Report a few days ago. While I didn't intend to annotate them, I am responding with annotations on the ChartList below:
November Winning Streak ChartList
Password: STREAK1234
If you click on the above link, you'll be prompted to type in the password provided.
The annotations are simply areas of recent price support to watch if these stocks pull back. Many have already gotten off to nice starts to kick off November.
Upcoming Earnings
Upcoming Earnings and Upcoming Earnings Relative Strength ChartLists are produced for EB.com members to track upcoming earnings reports and provide them to you via ChartLists throughout earnings season.
If you go into yesterday's Daily Market Report and re-download the Upcoming Earnings Relative Strength ChartList, it'll now include stocks that will report earnings today after the market close and tomorrow before the market open.
Economic Reports
ADP employment report: 86,000 (actual) vs. 75,000 (estimate)
October PMI services: 56.1 (actual) vs. 58.0 (estimate)
Happy trading!
Tom