


EB Daily Market Report - Wednesday, May 26, 2021
Executive Market Summary
- Futures were higher once again this morning and we've seen mostly positive action throughout the day
- Small and mid caps are leading the charge, especially the former
- Consumer discretionary (XLY, +1.05%) and communication services (XLC, +0.75%) are the best performing sectors on the session
- Historically, May 26th (today) starts a 10/11 day bullish period as the S&P 500 has an annualized return of +32% during this period since 1950; the NASDAQ's annualized return tops 48% since 1971
- Renewable energy ($DWCREE, +4.99%) and automobiles ($DJUSAU) - see Sector/Industry Focus below - are today's best performing industry groups
- Aluminum ($DJUSAL) is testing its 50-day SMA for the first time since February and bouncing thus far
- Ford Motor (F, +7.38%) is the best performing S&P 500 company today, while Nike (NKE, +2.09%) is the only Dow Jones component gaining more than 1%
Market Outlook
Transportation stocks ($TRAN) remain strong, so I thought it was important to provide you not only an update of the index, but also the component industry groups:
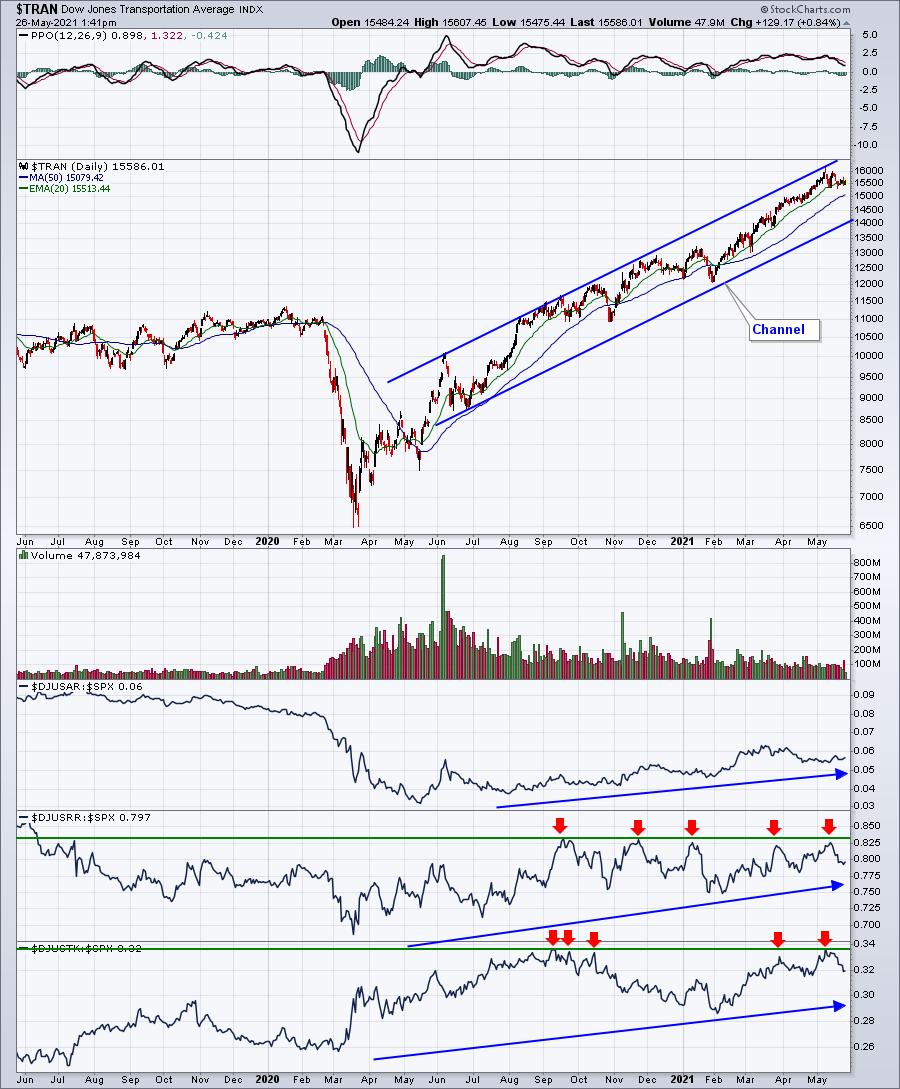
I see a very strong uptrend channel in play for transports, bullish for U.S. equities in general. When transports do well, it's hard to argue for anything other than a strengthening economy ahead.
Looking at the 3 panels beneath the TRAN chart, airlines have been the relative weakling over the long haul, but their relative strength does continue to improve. Railroads and truckers have both been trying to break to new relative highs. Should they find success in doing so in the weeks and months ahead, that would add further bullishness to an already bullish chart.
Sector/Industry Focus
Automobiles ($DJUSAU, +3.06%), the best performing industry group of 2020, is bouncing off key support and being led by a big advance in Ford Motor Co (F, +7.38%). Tesla, (TSLA, +2.92%) is also gaining strength and testing its 20-day EMA from underneath today. Here's the latest technical outlook on the DJUSAU:
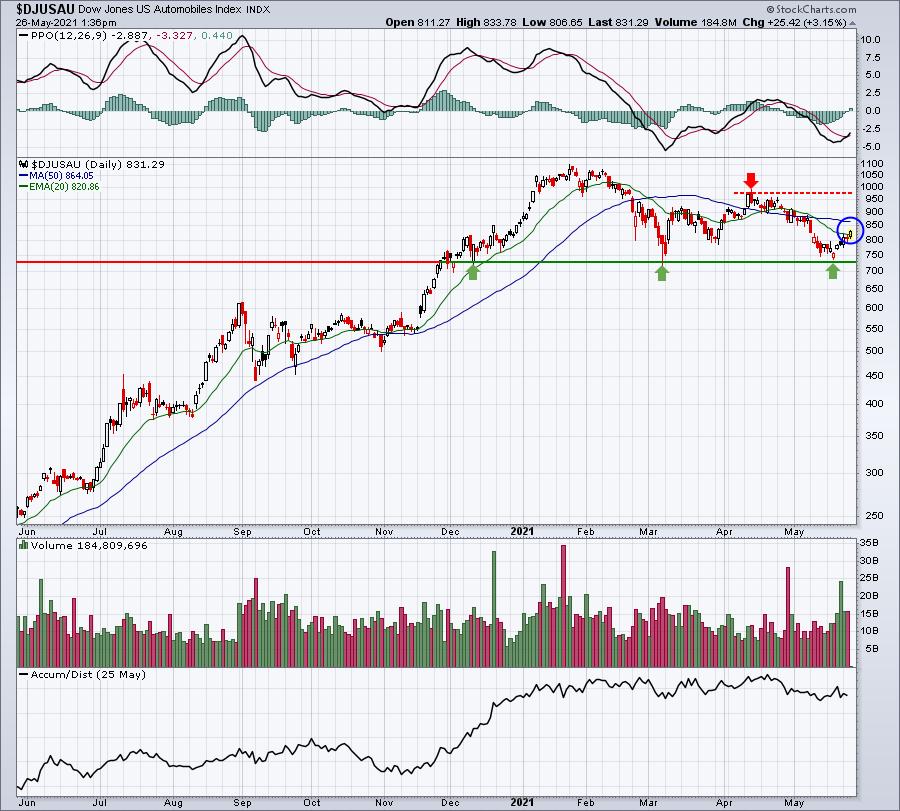
The group is attempting a 20-day EMA breakout of its own. The last two lows mark a significant double bottom. I'd expect the autos to perform well from here, while a breakdown beneath 730 would likely result in much further selling ahead. I don't see it happening.
ChartLists/Strategies
Gamestop Corp (GME, ++12.94%) and AMC Entertainment Holdings, Inc. (AMC, +15.00%) are at it again. Both have had excellent showings this week. GME has broken above key price resistance and buyers are trampling sellers. AMC easily cleared resistance just below the 15 level and is now quickly approaching the January high of 20.36. It reminded me of the huge short squeeze from January, even though the short interest is much lower on GME and AMC now than it was then. Both still have fairly high short interest, however, so a bullish reaction to these breakouts is much more likely.
I will be updating the Short Squeeze ChartList (SSCL) over the course of the next week or so, but I went through each chart on our current list to see if any were threatening what I'd consider to be potential breakouts and/or short squeezes. We really want to see the volume beginning to rise as that is a necessary component of a squeeze. Here are 6 that are worth watching, in my view:
ASO:
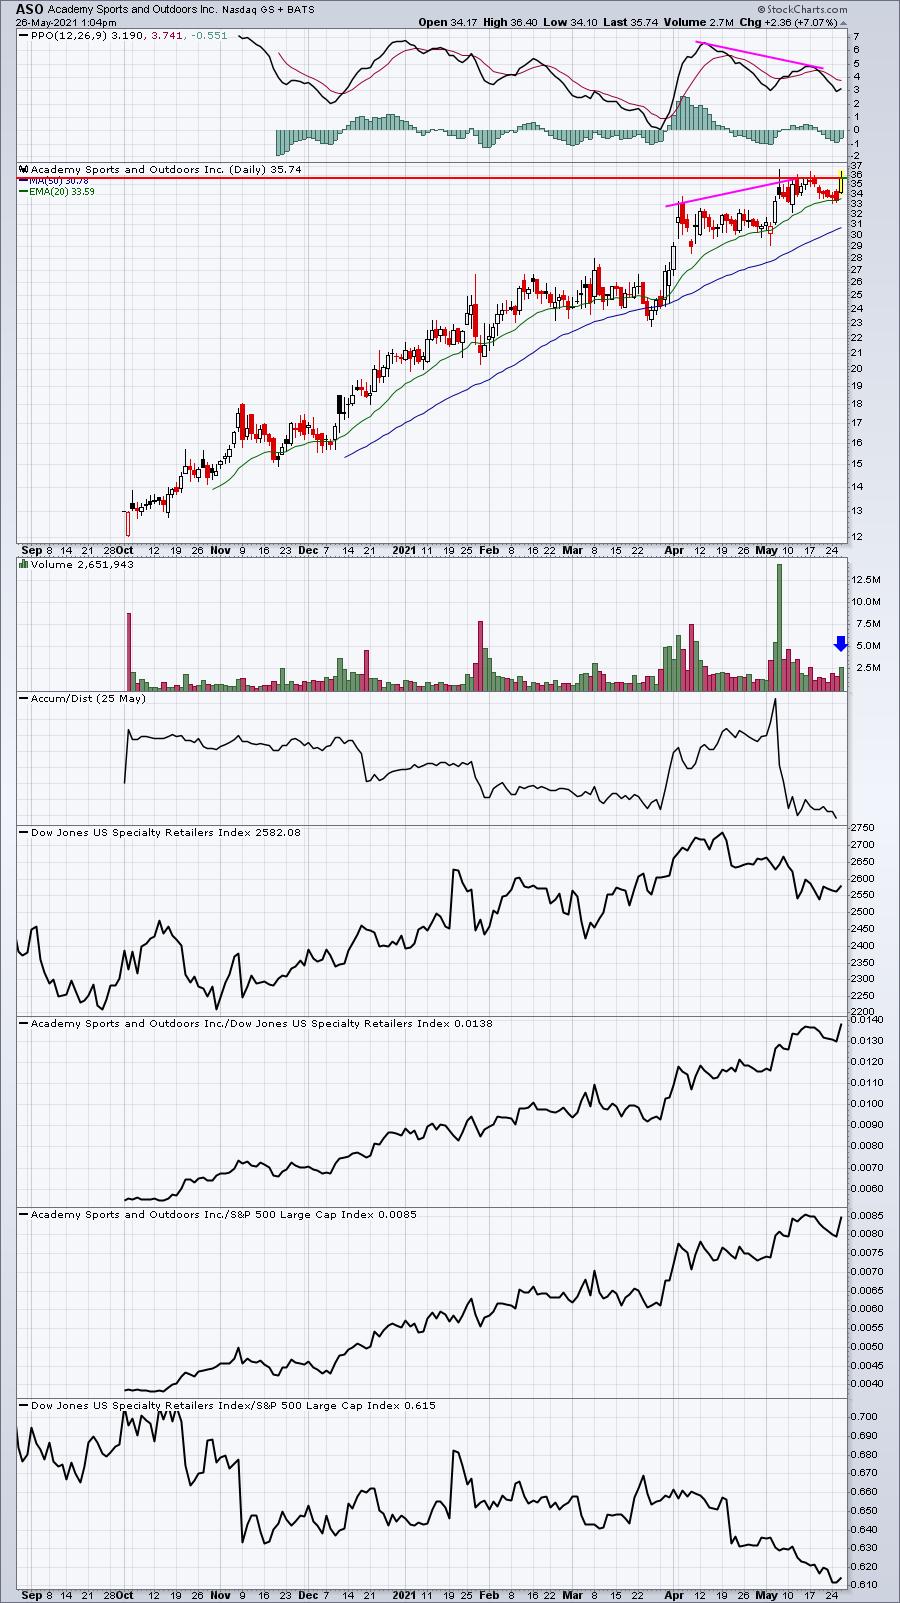
I see two potential problems here. First, the specialty retailers ($DJUSRS) are struggling vs. the S&P 500 and, second, there's a negative divergence on the PPO. A false breakout could be problematic. A high volume breakout would trump that negative divergence, however, so keep an eye on this one.
GOGO:
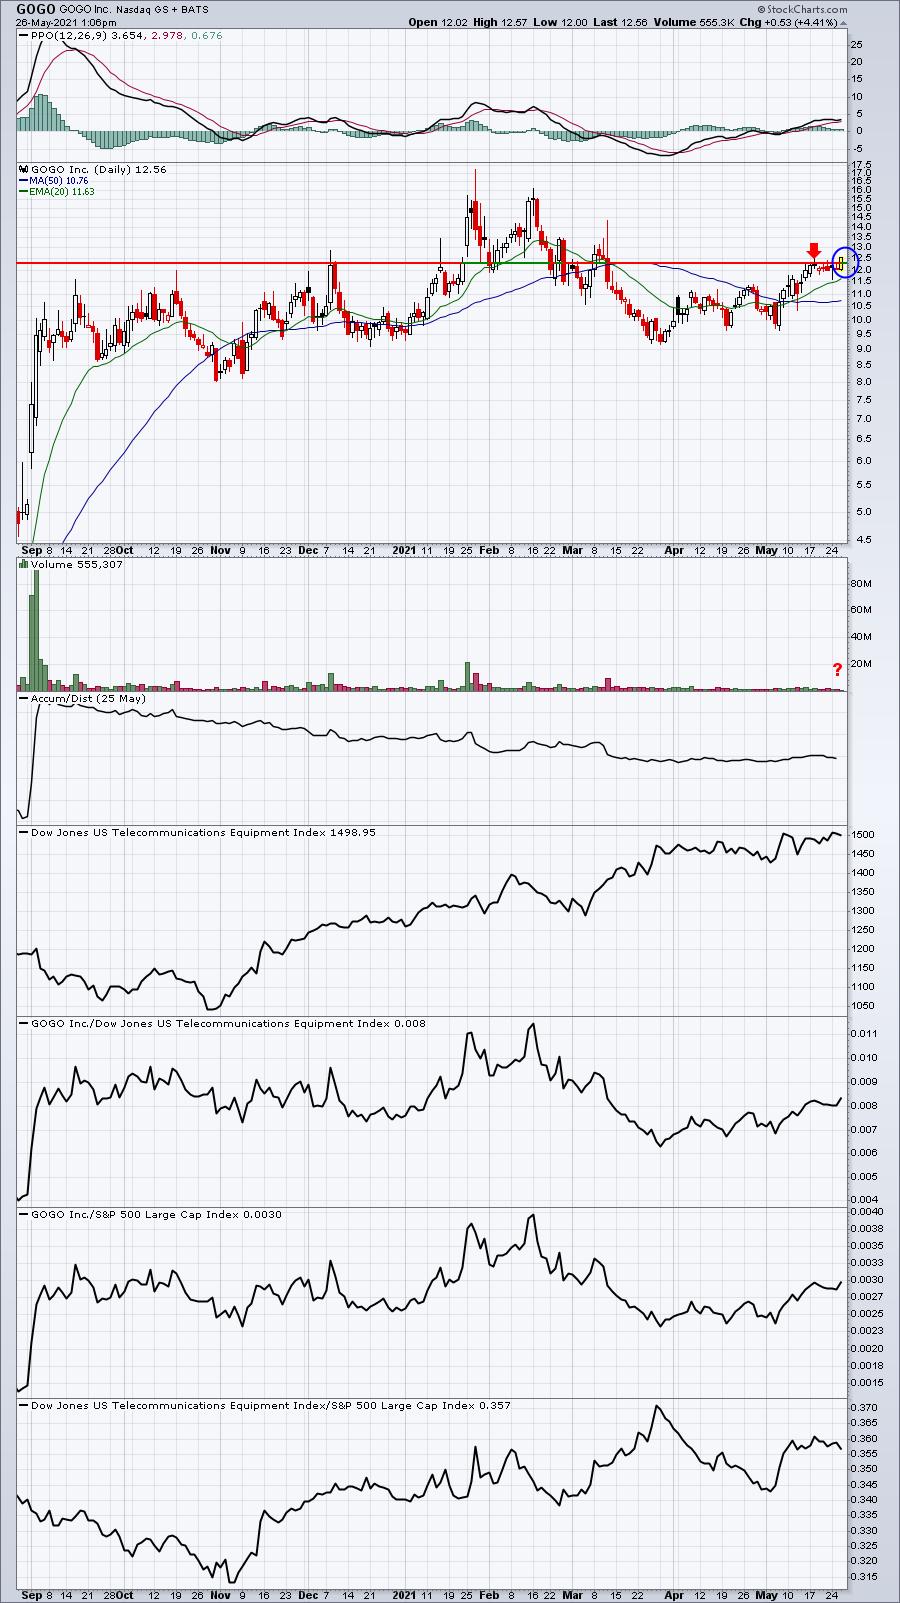
Full Disclosure: I own GOGO shares.
I liked GOGO for its short squeeze potential and it's price action is cooperating. However, it is light on volume for a short squeeze. In other words, short sellers are not "throwing in the towel" just yet. Perhaps that's a good thing as that could result in further buying and panic in the days to come. Or maybe we're seeing a head fake to the upside. I'm watching the rising 20-day EMA closely. Failure to hold that would likely take me out of this position.
KOSS:
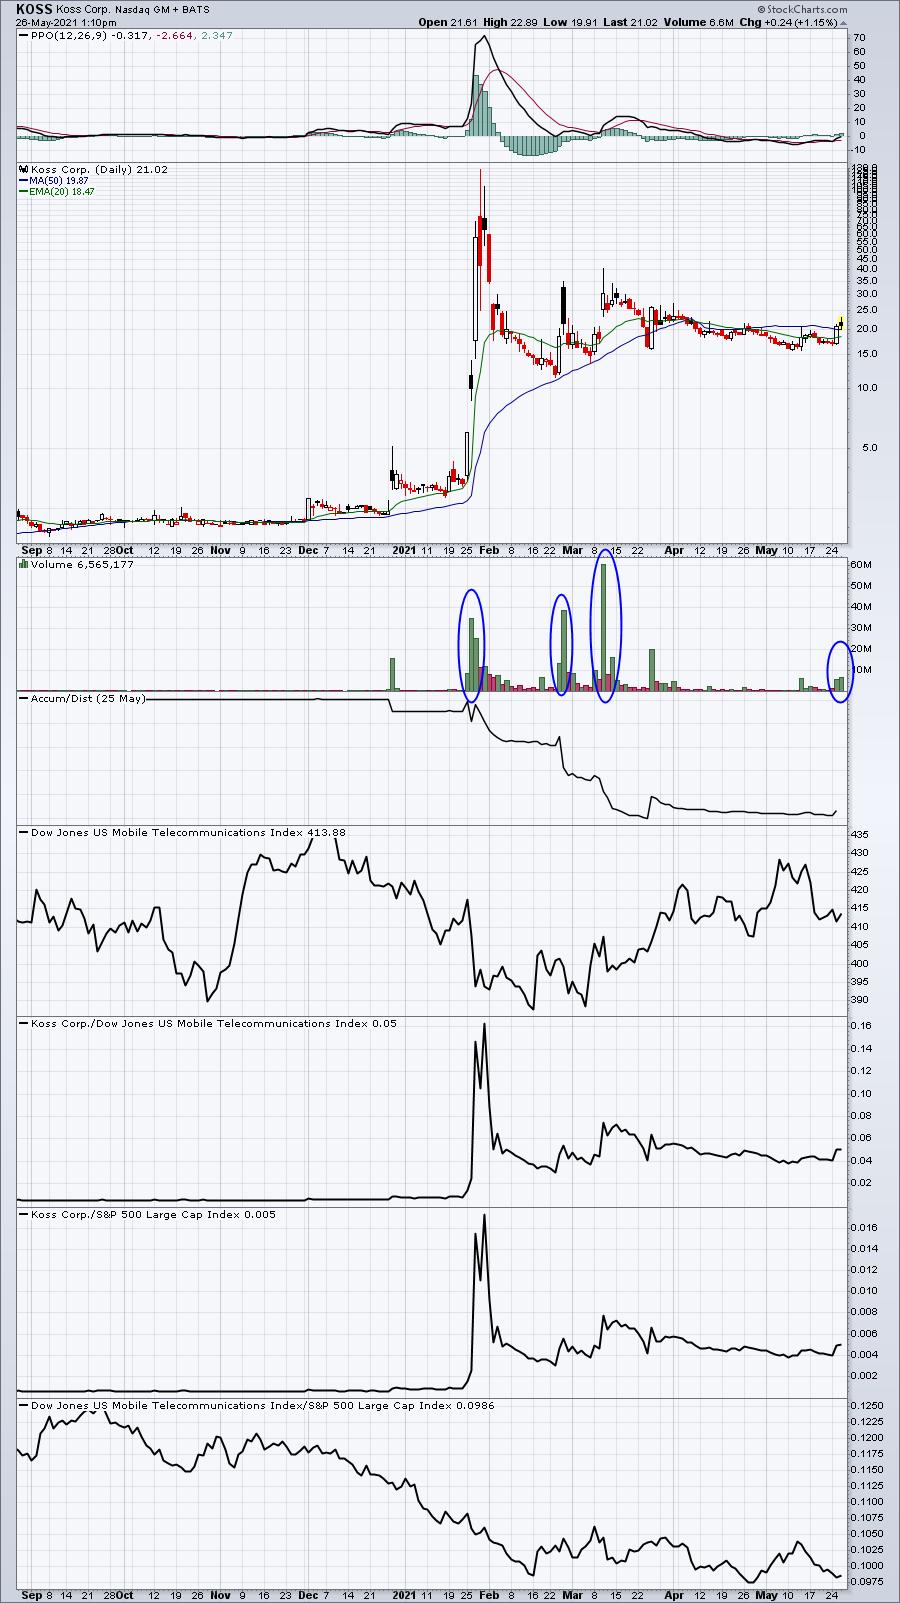
This one is extremely volatile and we've seen many head fakes over the past several months. When volume rises, the history here is to see gaps higher, but KOSS hasn't really sustained any of its recent surges. If I traded this one, I'd be very tempted to sell on gaps higher. Because of the severe volatility in both directions, I'd also consider keeping any positions very light.
BYND:
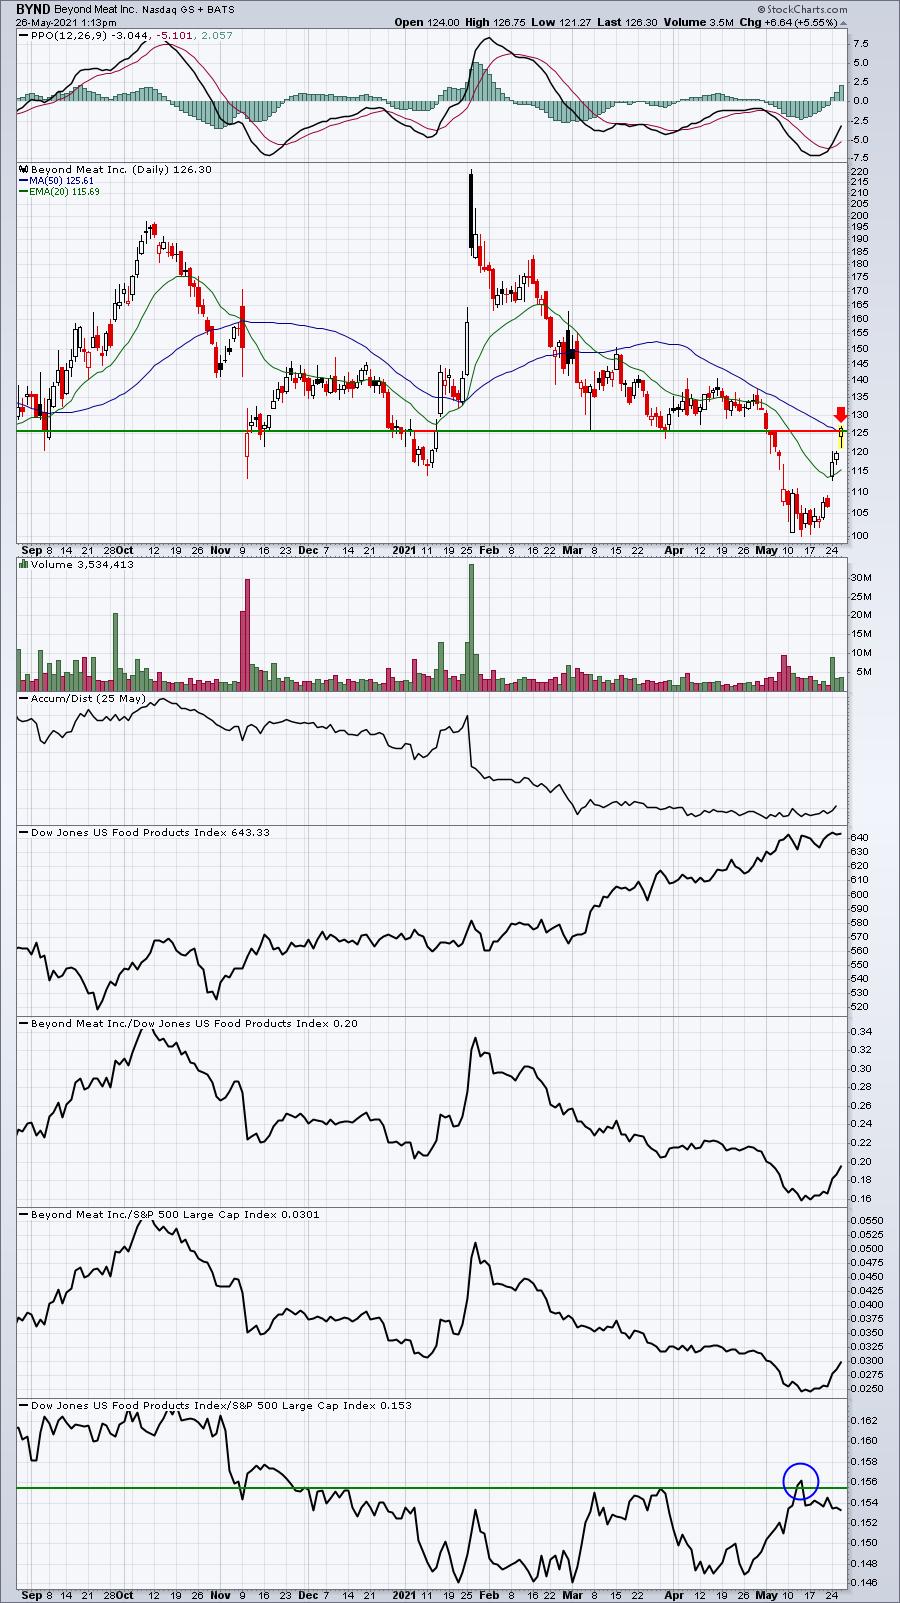
BYND has risen roughly 25% in a little more than a week. Right now, it's testing a key level - its 50-day SMA. Breaking above that moving average would likely begin to trigger at least a bit of short covering. Volume has definitely picked up in recent days, so further upside price action will put pressure on shorts.
BBBY:
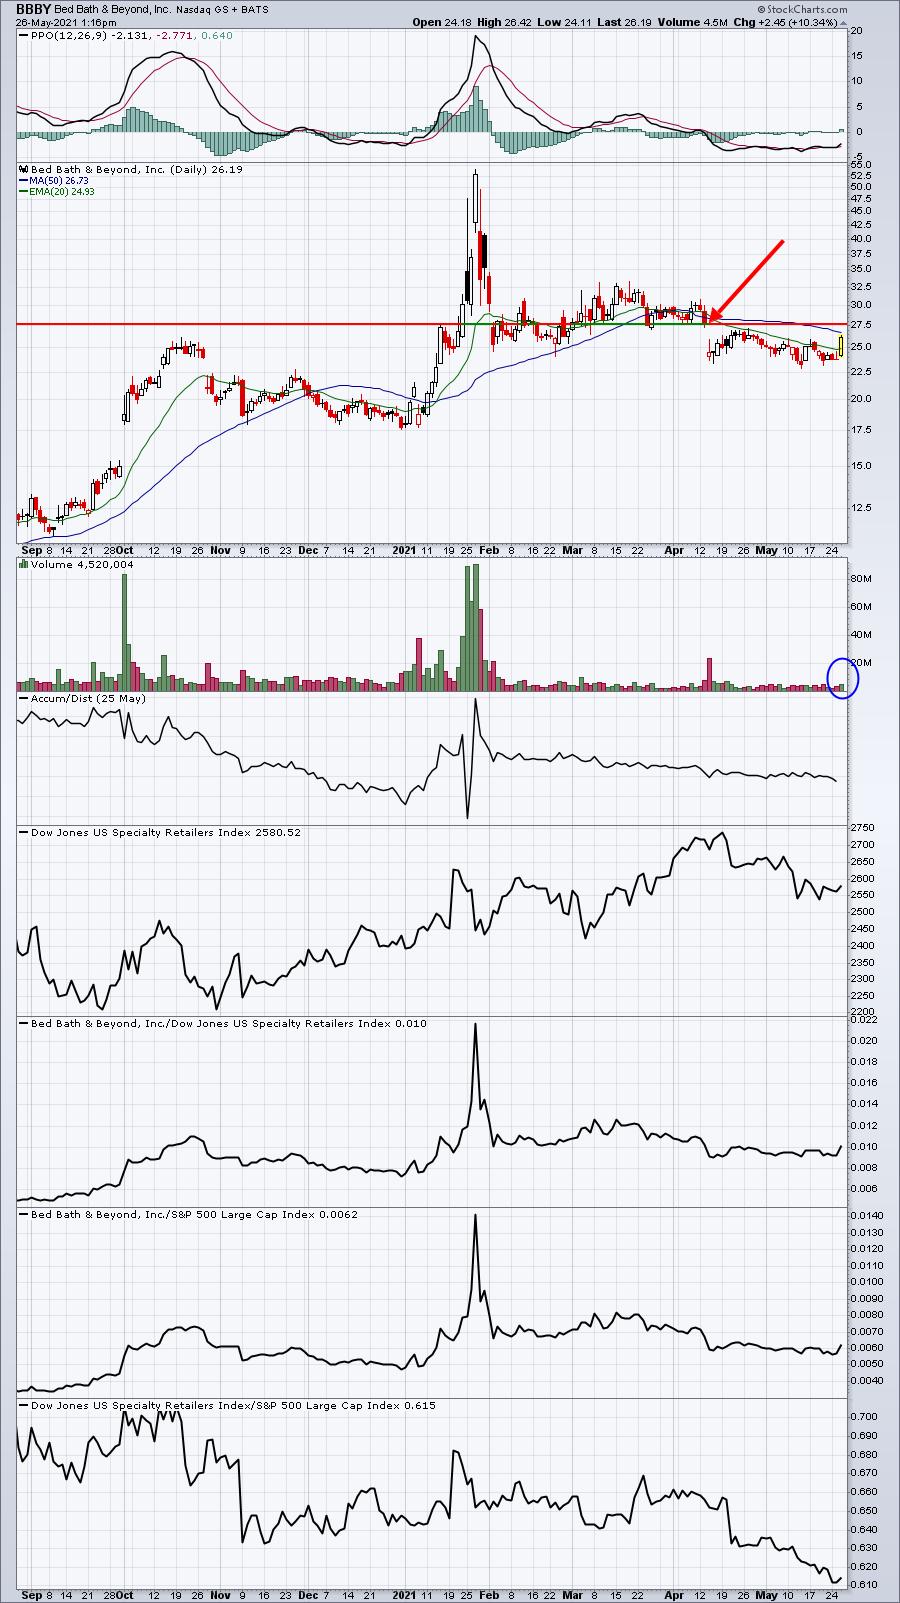
BBBY still has some work to do. That bold red arrow is pointing to a key gap resistance. I wouldn't be overly concerned about my short position (if I had one) unless gap resistance was cleared. Doing so could very well trigger much more buying among shorts.
MAC:
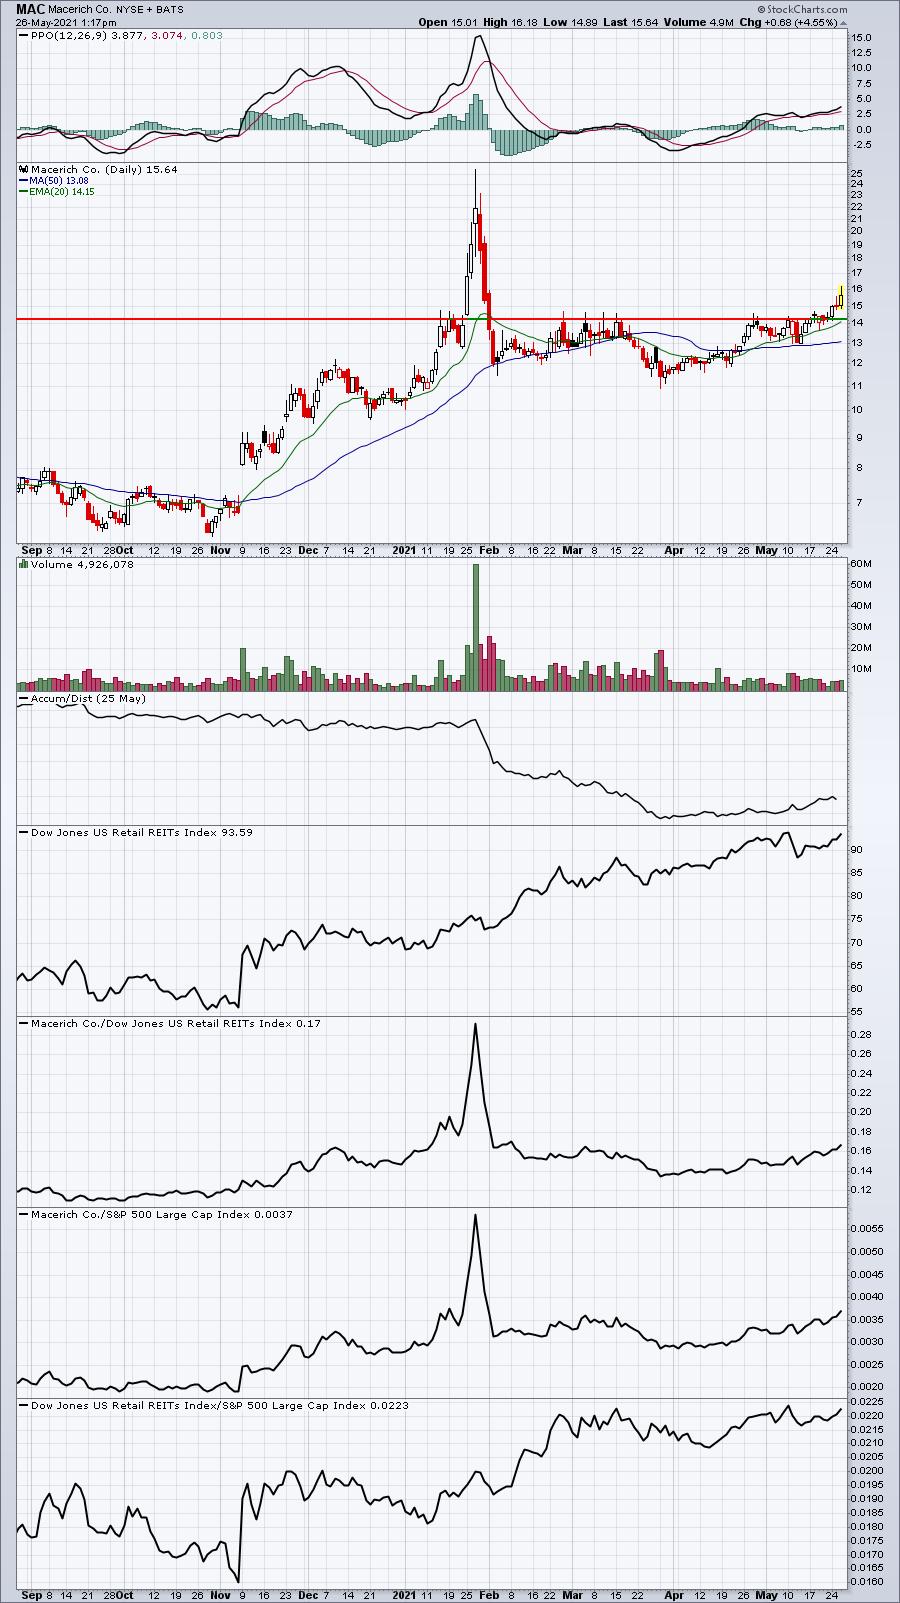
MAC is in the real estate sector, a group where I normally wouldn't be looking for violent upside action. It does have a significant short position, though, and it's now trading at its highest level since the end of January. For a true short squeeze, MAC will need to trade much heavier volume.
Earnings Reports
Here are the key earnings reports for the next two days, featuring stocks with market caps of more than $10 billion. I also include a few select companies with market caps below $10 billion. Finally, any portfolio stocks that will be reporting results are highlighted in BOLD. If you decide to hold a stock into earnings, please understand the significant short-term risk that you are taking. Please be sure to check for earnings dates for any companies you own or are considering owning.
Wednesday, May 26:
NVDA, PDD, SNOW, BMO, WDAY, OKTA, LI, AGL, WSM, UHAL, DXC, CPRI, DKS, NTNX, APPS, AEO, PSTG, ANF, ZUO, ELF, QADA, DBI, NXGN, PLAB
Thursday, May 27:
CRM, MDT, COST, RY, TD, DELL, VMW, ADSK, CM, DG, HPQ, VEEV, BBY, DLTR, BURL, ULTA, GPS, ATHM, PLAN, ASND, OLLI, BOX, DOMO, GES, YEXT
Economic Reports
None
Happy trading!
Tom