
EB Monthly Seasonality Report - January 2023
A Look Back At December Stocks:
One month ago, we provided a list of the Top 20 stocks that had strong historical track records during the month of December. Here are how they performed in December 2022:
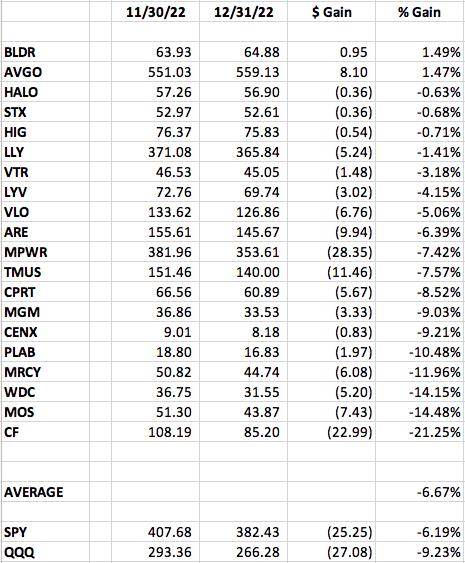
The percentages represent the returns from the November 30th close to the December 31st close. The average performance of -6.67% was mostly in line with the S&P 500 performance, but it did outperform the NASDAQ, which was hit much harder during the month. It was a rough month for most U.S. stocks.
Of the 5 stocks that fell more than 10% in December, MOS is a stock that has reached a key price support level:
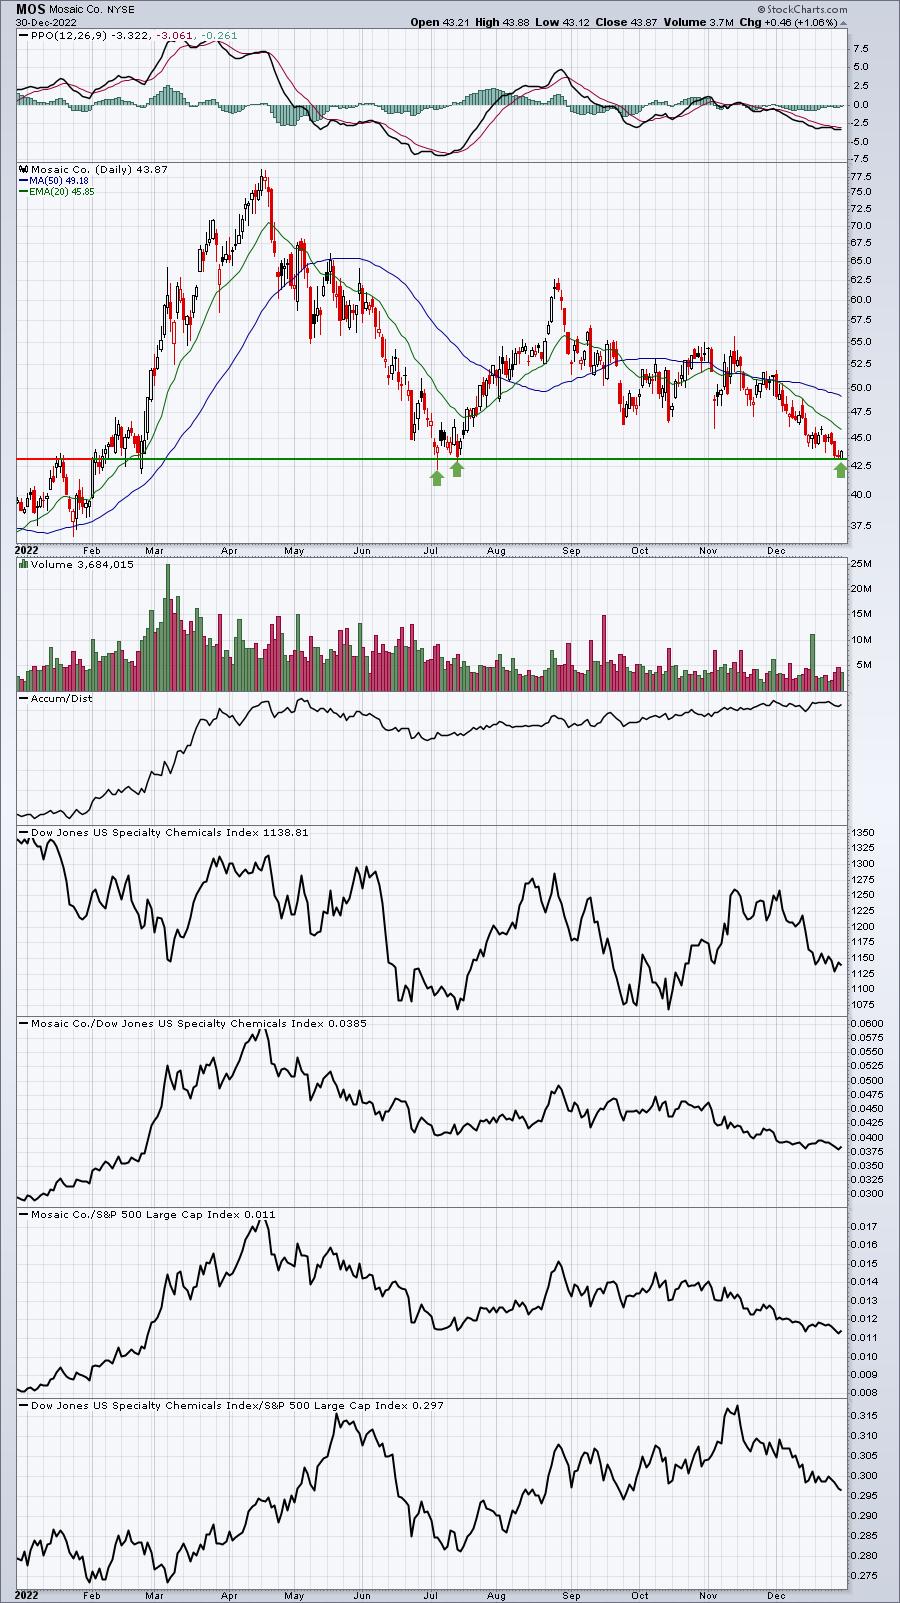
It's interesting that the AD line remains strong as well. While that may be a bullish signal, I'd still keep a very tight stop on MOS at this 43 level.
S&P 500 January Performance
Here's a breakdown of the annualized performance of the S&P 500 (since 1950) during the month of January:
- January 1-6: +38.30%
- January 7-13: -14.18%
- January 14-18: +29.84%
- January 19-22: -24.91%
- January 23-31: +24.08%
January is a part of the most bullish period of the year - from the close on October 27th through the close on January 18th. January has risen 43 of the last 73 years. Also, January's annualized return since 1950 of 11.92% and ranks 6th among all calendar months in terms of annualized return. It's worth noting, however, that January has been the best calendar month (in terms of annualized return) on the NASDAQ since 1972, boasting a 28.62% annualized return.
Sector Performance
Before we look at individual stocks, let's get an overview of how the various sectors and industries have performed during January (and February) over the past decade (during this secular bull market):
Sector Heat Map:
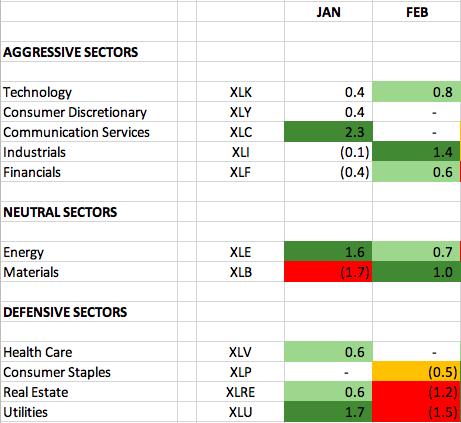
The numbers reflect how much a sector, on average, outperforms or underperforms the S&P 500 over the past 10 years. The dark green-shaded areas show significant outperformance (1.0 or greater). The light green-shaded areas show solid outperformance (from 0.5 to 1.0). The yellow-shaded areas show underperformance (-0.5 to -1.0). The red-shaded areas show significant underperformance (-1.0 or greater). Where there is no shading, there tends to be more neutral performance (-0.4 to 0.4).
The clear historical winner for January seems to be communication services (XLC), so let's look at the chart:
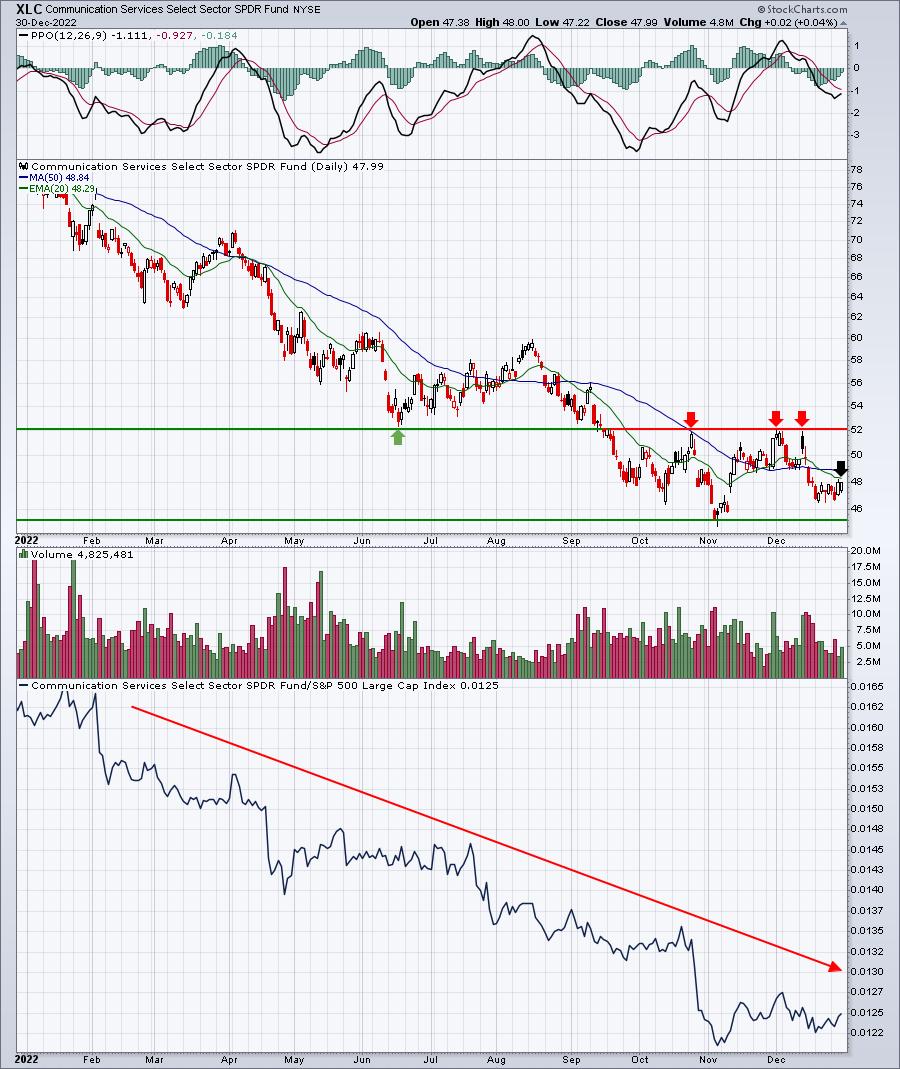
Well, the XLC may need to muster up a lot of historical strength, because technically I still see many issues. The XLC relative strength line remains horrific. From an absolute price perspective, the XLC needs first to reclaim its declining 20-day EMA at 48.29. If it can do so, then we can't rule out a 10% move higher to challenge the triple top (red arrows) near 52. Meanwhile, the November low near 45 is the primary price support level to watch.
Industry Performance
Let's take a look at the industry heat map within communication services (XLC) to drill down to the best seasonal strength in January and February over the past decade among the various industry groups (relative to the S&P 500):
Communication Services (XLC):
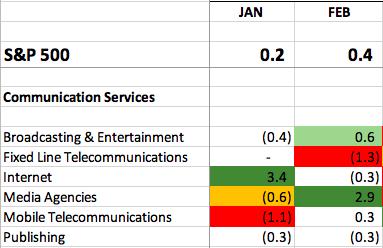
Clearly, it's the internet space ($DJUSNS) that shows the January relative strength. Check out the DJUSNS seasonality chart, relative to the S&P 500:
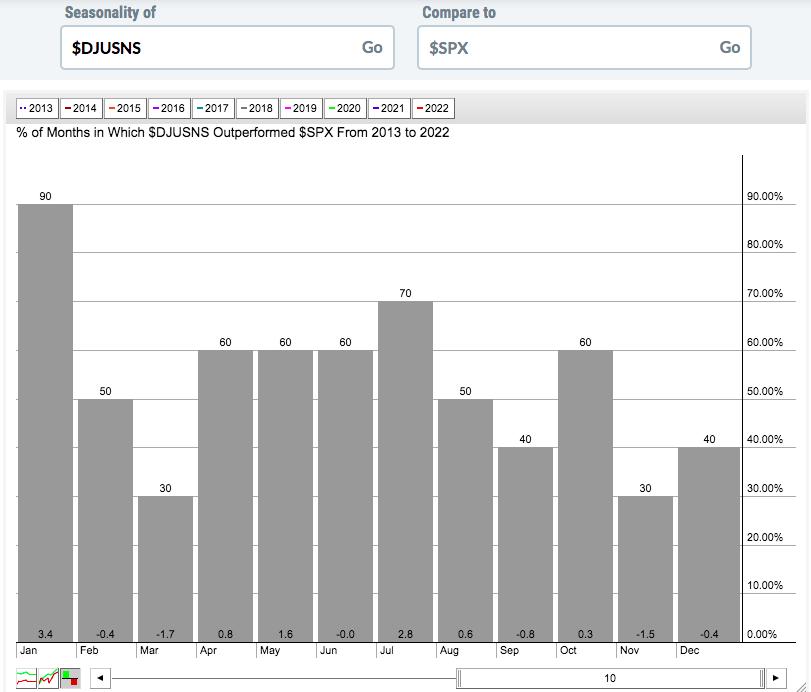
January has easily been the best month for internet stocks during this secular bull market. The only other calendar month that comes close in terms of average outperformance is July at 2.8%. And check out the odds of internet stocks outperforming during January (90%, or 9 of the last 10 years).
Here are industry groups (within sectors other than communication services) that tend to perform much better than the benchmark S&P 500 during January:
Technology (XLK):
- renewable energy, software
Consumer Discretionary (XLY):
- home construction, toys, broadline retailers, gambling, business training & employment agencies
Industrials (XLI):
- defense, aerospace
Financials (XLF):
- specialty finance
Health care (XLV):
- medical equipment
Consumer staples (XLP):
- drug retailers, tobacco, brewers, distillers & vintners
Real Estate (XLRE):
- mortgage REITs, specialty REITs, retail REITs
Utilities (XLU):
- multiutilities, gas distribution, conventional electricity, water
Energy (XLE):
- oil equipment & services, pipelines, exploration & production
Materials (XLB):
- gold mining, paper, mining
Stocks for January
We've selected our Top 20 seasonal stocks for January. Several names represent sectors and industry groups that have been discussed above. Others simply stand out in January based on their own historical track record.
The stocks this month are as follows:
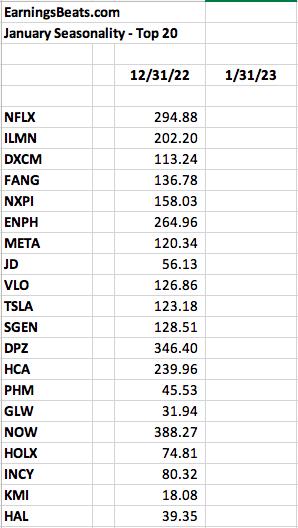
A "Seasonality - January 2023" ChartList (annotated with 1 or 2 support levels to watch) has been created and will be available for viewing/download on our website sometime on Monday. You must be a StockCharts.com Extra or Pro member to download our ChartLists. Basic members and non-StockCharts.com members can view the charts one at a time.
Happy trading!
Tom