
EB Monthly Seasonality Report - February 2024
A Look Back At January Stocks:
One month ago, we provided a list of the Top 20 stocks (actually 19 as SGEN was one of our featured 20 that was acquired by PFE) that had strong historical track records during the month of January. Here are how they performed in January (through Monday, January 29th), in order of best to worst performance:
- NFLX: +18.26%
- META: +13.30%
- NOW: +11.43%
- VLO: +6.45%
- HCA: +5.93%
- ILMN: +5.37%
- DPZ: +5.15%
- HOLX: +4.94%
- HAL: +2.88%
- PHM: +2.75%
- DXCM: +0.13%
- FANG: -0.14%
- KMI: -3.12%
- CIVI: -3.29%
- INCY: -3.69%
- CELH: -4.48%
- NXPI: -5.32%
- JD: -18.80%
- TSLA: -23.16%
The percentages represent the returns from the December 31st close to the January 29th (yesterday) close. The average performance of all 19 stocks (+0.77%) failed to keep up with both the S&P 500 performance (+3.36%) and the NASDAQ 100 performance (+4.55%). Our biggest January winner, Netflix (NFLX), showed the most historical strength in January among the 19 stocks featured and it once again delivered. Overall, however, the seasonally-strong stocks disappointed vs. our key indices. Always remember that these Top 20 stocks are provided every month based SOLELY upon historical tendencies. It's up to everyone to decide if strong seasonality warrants a trade, especially if technical conditions are suspect.
S&P 500 February Performance
Here's a breakdown of the annualized performance of the S&P 500 (since 1950) during the month of February:
- February 1-3: +40.02%
- February 4-11: -12.76%
- February 12-15: +39.90%
- February 16-29: -16.21%
February generally is fine until we get past the 15th. This lines up with the first half of calendar quarters vs. second half of calendar quarters. The first quarter is associated with pre-earnings rallies and continuing price appreciation with earnings. But as we move into the second half of February and the second half of Q1, things historically take on a much more bearish feel.
To summarize February performance, we could also look at it from a first half vs. second half perspective:
- February 1-15: +11.48%
- February 16-29: -16.21%
As you can see from the above, February, since 1950, simply isn't a very good month for the S&P 500. If we look back to S&P 500 performance this century, February trails only September (worst) and June (2nd worst).
Sector Performance
Before we look at individual stocks, let's get an overview of how the various sectors and industries have performed during February over the past decade (during this secular bull market):
Sector Heat Map (no picture as images are causing our scrolling issue):
January has historically seen significant leadership from communication services (XLC) and I said, after looking at the technical picture last month, that I'd be surprised if the XLC didn't lead once again in January 2024. Well, here was the XLC chart I featured last month and you can see what happened since:
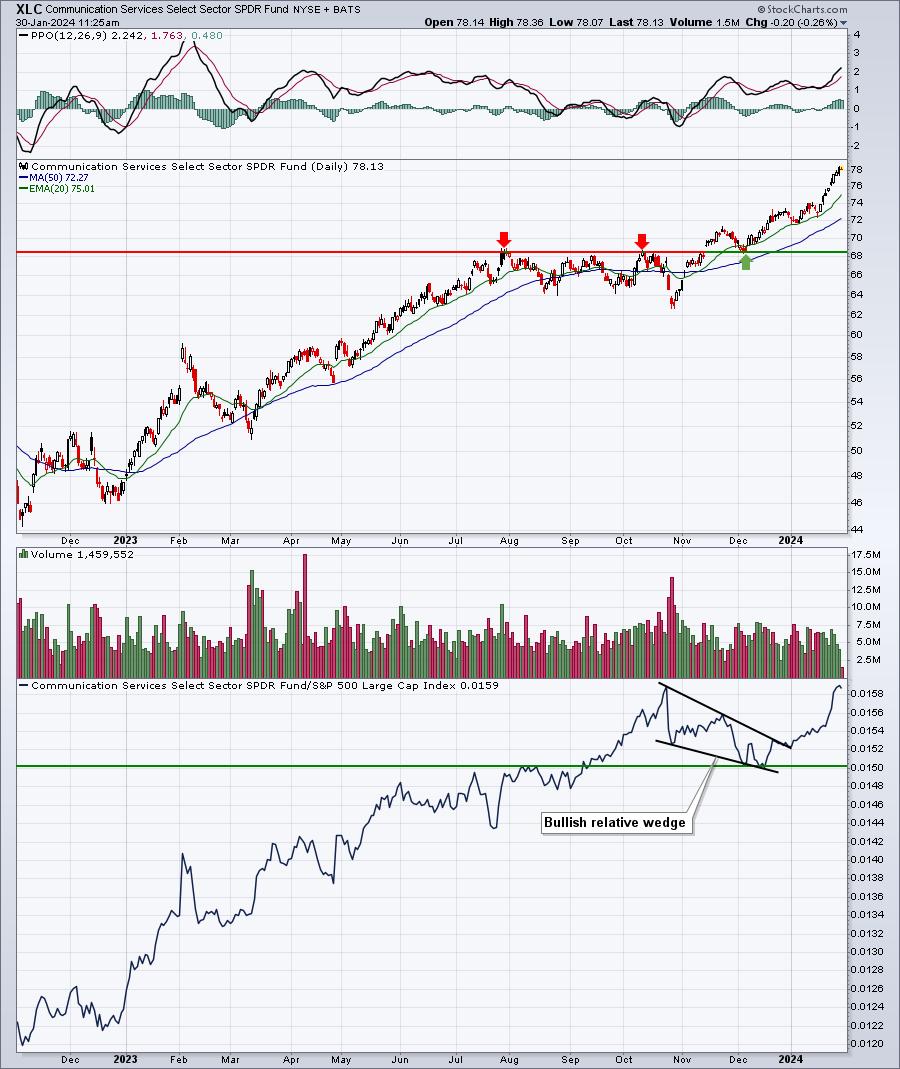
Remember that relative bullish wedge? Well, it was broken with authority and, for the 12th consecutive year, the XLC moved higher AND outperformed the S&P 500. It certainly pays to be aware of historical tendencies. Here's how each sector has performed year-to-date:
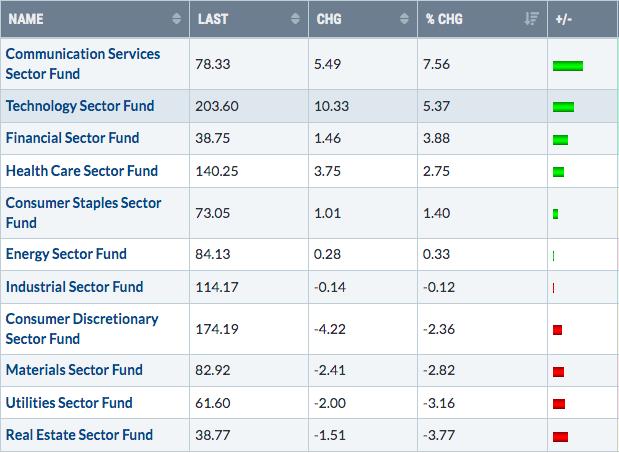
Ok, that was January. What should we expect for February 2024?
First, we do tend to see the aggressive sectors lead. While I haven't done a study, I'm fairly certain much of that strength is in the first half of the month, when the S&P 500 shows historical strength. The back half of February tends to be weak and I'd guess money rotates a bit more defensively.
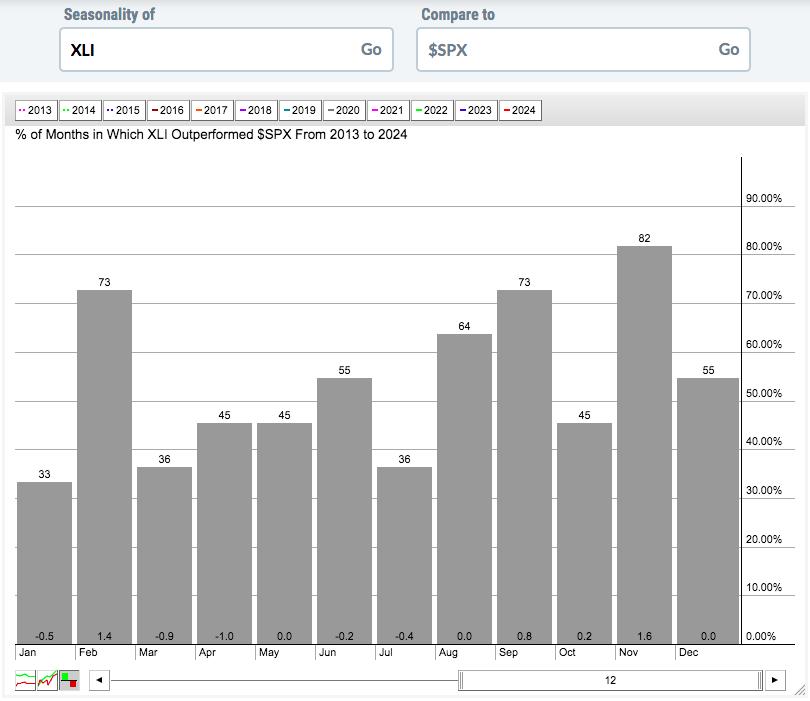
Industrials (XLI) show nearly all of its historical relative strength from September through December. But February does stick out as a very solid month for the sector. Here's a seasonality chart of the XLI during this secular bull market - since 2013:
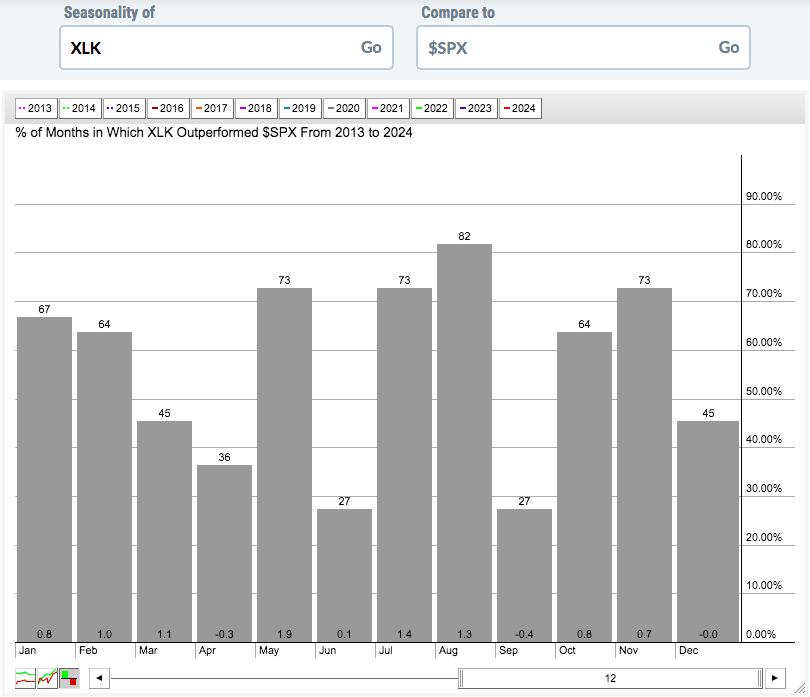
It's also important to note that technology's BEST quarter relative to the S&P 500 is Q1. Here's what technology looks like relative to the S&P 500 over the past 12 years:
Industry Performance
Let's focus on the strongest sector, which is industrials (XLI), though continuing to dive into technology (XLK) makes sense as well. Within the XLI, one group that really stands out in February is defense ($DJUSDN). On a weekly chart, the DJUSDN recently broke above price resistance and it's since pulled back to test its key 20-week EMA. This is absolutely an area where I'd expect to see strength resume:
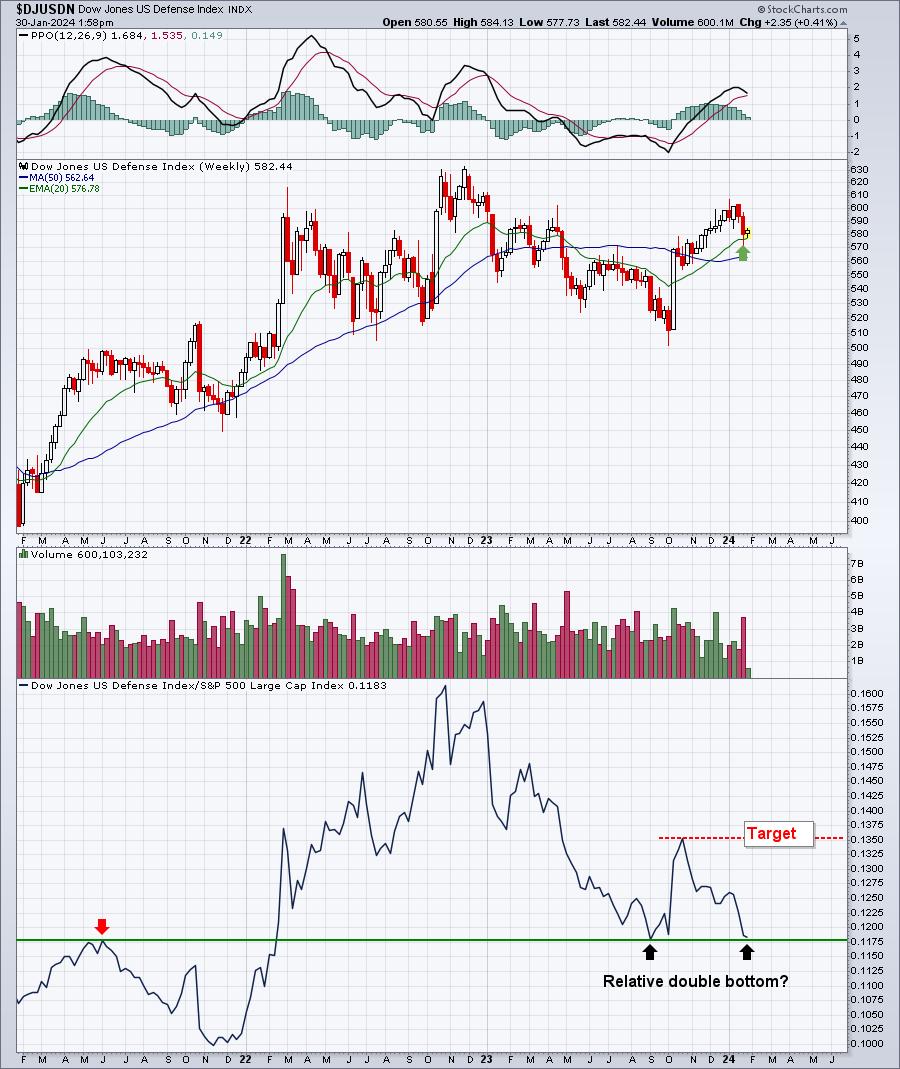
Knowing that February is easily the defense group's best calendar month of the year, in terms of relative performance vs. the S&P 500, only adds to the technical reasons to consider defense stocks as we wrap up January. I also like the relative double bottom where I'd expect to see relative strength resume.
Here are industry groups that tend to perform much better than the benchmark S&P 500 during February:
Technology (XLK):
- telecommunications equipment, semiconductors, renewable energy, electrical components & equipment
Consumer Discretionary (XLY):
- travel & tourism, hotels, tires, gambling, auto parts, gambling, specialty retailers, recreational services
Communication Services (XLC):
- media agencies
Industrials (XLI):
- marine transportation, defense, aerospace, airlines, heavy construction, commercial vehicles & trucks, railroads, trucking, industrial suppliers
Financials (XLF):
- insurance brokers, consumer finance, property & casualty insurance, specialty finance, reinsurance
Health care (XLV):
- none
Consumer staples (XLP):
- tobacco
Real estate (XLRE):
- real estate services, real estate holding & development
Utilities (XLU):
- none
Energy (XLE):
- coal
Materials (XLB):
- nonferrous metals, aluminum, steel
Stocks for February
We've selected our Top 20 seasonal stocks for February. Several names represent sectors and industry groups that have been discussed above. Others simply stand out in February based on their own historical track record.
The stocks this month are as follows:
- TTD
- BKNG
- FTNT
- CF
- FCX
- PANW
- MOS
- FLT
- SWKS
- APTV
- ON
- ZBRA
- NVDA
- AON
- AVGO
- SPLK
- MELI
- HLT
- AMAT
- CDNS
A "Seasonality - February 2024" ChartList (annotated with 1 or 2 support levels to watch) will be created and will be available for viewing/download over the next day or two. You must be a StockCharts.com Extra or Pro member to download our ChartLists. Basic members and non-StockCharts.com members can view the charts one at a time.
Happy trading!
Tom