
EB Weekly Market Report - Monday, January 29, 2024
ChartLists Updated
Several ChartLists have been updated on our website since Friday:
- Strong Earnings (SECL)
- Strong Future Earnings (SFECL)
- Raised Guidance (RGCL)
- Bullish Trifecta (BTCL)
Weekly Market Recap
Major Indices
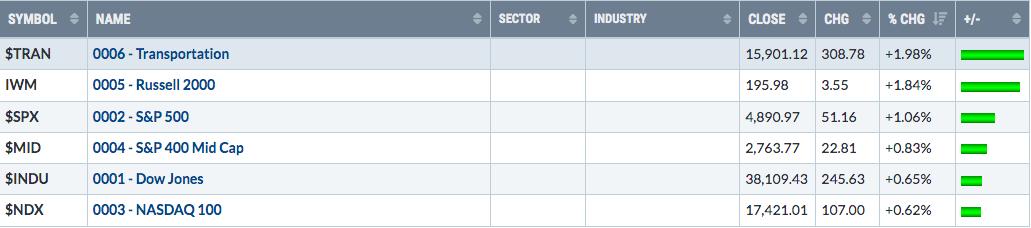
It was nice to see strength in transports ($TRAN) and small caps ($SML) as solid rotation may be needed in 2024 to extend the current secular bull market advance. At some point, the large cap growth names will need a break and areas like the TRAN and SML will be looked up as potential new leaders - even if it's just for brief periods.
Sectors
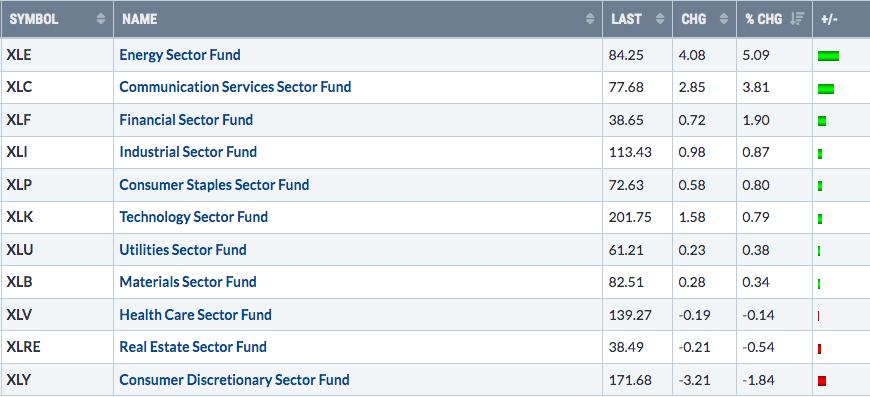
Energy (XLE) rebounded nicely last week, climbing back above both its 20-day EMA and 50-day SMA. Unfortunately, it's had a strong track record of doing that lately, but can't hold these breakouts. Instead, we've seen subsequent action to reverse the short-term bullish moves. Check this out:
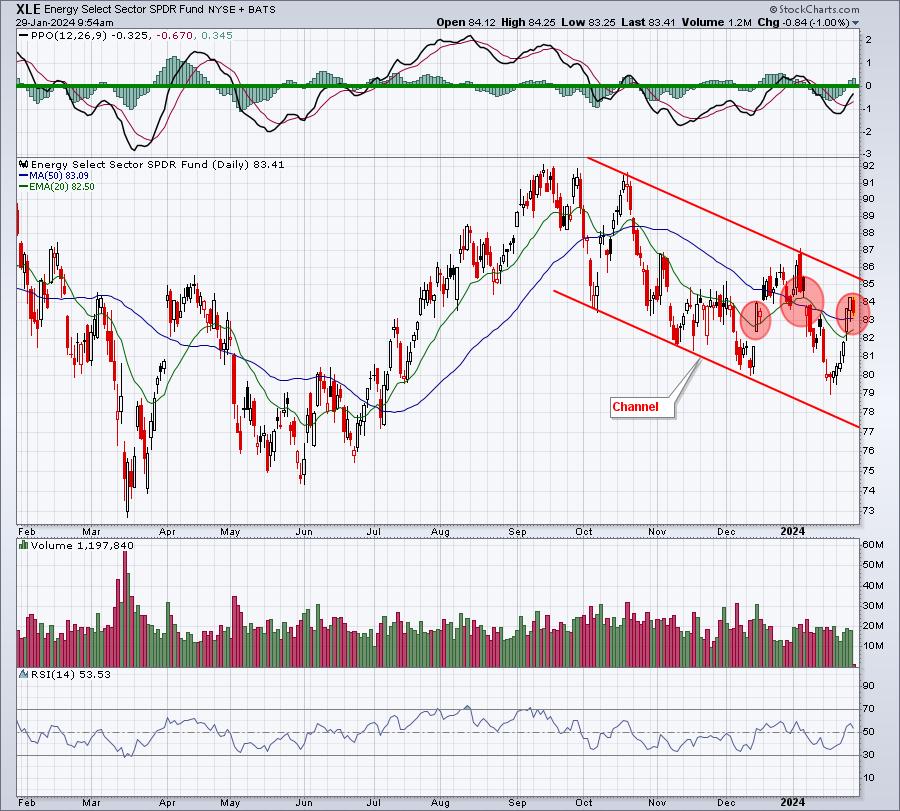
The red-shaded areas are recent examples of how price just keeps moving above and below our key moving averages. This is a sign of a trendless market. Also, look at the bottom of the chart where the RSI has struggled for months to clear RSI 60. The constant movement between 40 and 60 is another signal of trendless action. So the big question for energy is.....can it bounce off moving average support and break the 4-month downtrend channel?
Top 10 Industries Last Week
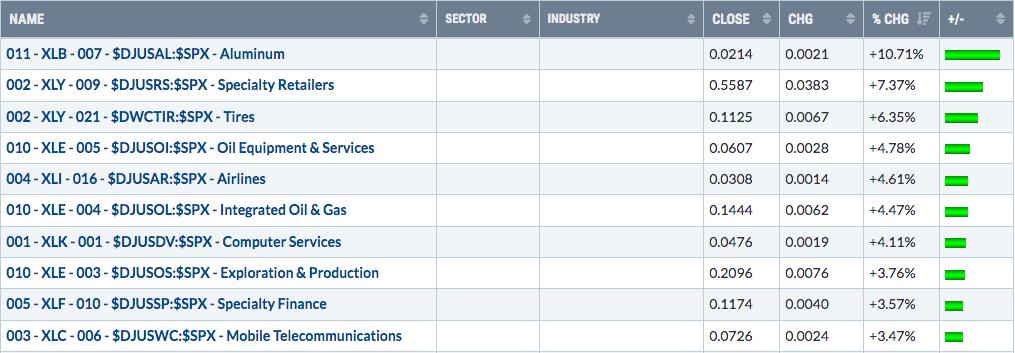
Specialty finance stocks ($DJUSSP) have been mentioned before as a group that could have a superb year in 2024 and last week's action would only further support that. The latest breakout only extends the right side of a long-term cup with handle:
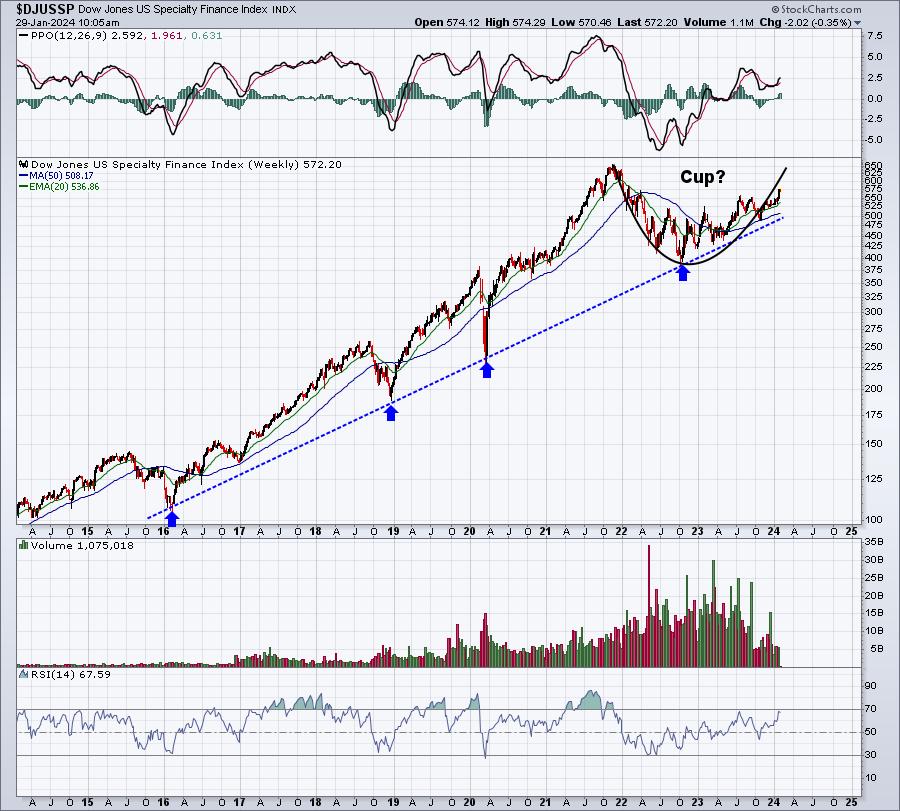
It would seem that a trip back to 650-660 to complete the cup is inevitable looking at this chart. Then I'd watch for a handle to form. On a breakout, the ultimate measurement (depth of cup in terms of points added to breakout level) would be to roughly 925.
Bottom 10 Industries Last Week
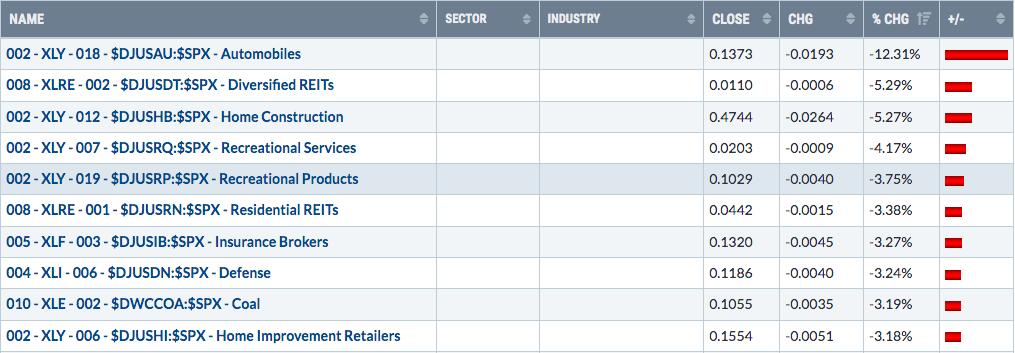
Recreational products ($DJUSRP) are at a very interesting support level after a not-so-great week. They've been here before on a couple occasions and bounced both times. Can they do it again?
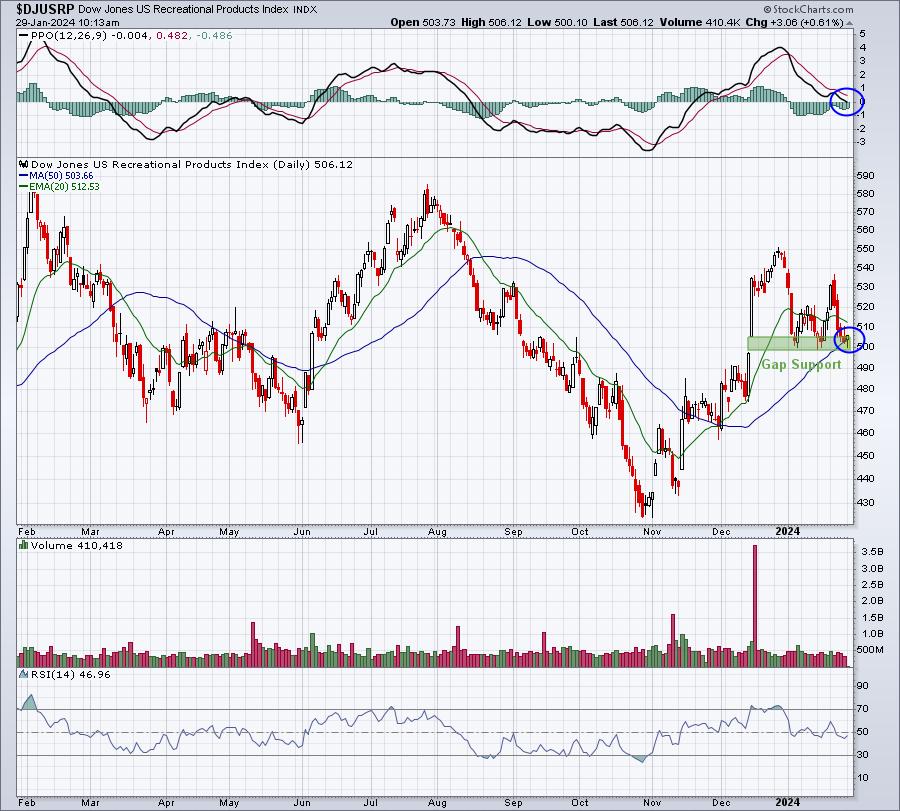
The blue circles highlight the PPO centerline and 50-day SMA tests. Throw in the RSI that's dipped into the 40s and this is the best reward-to-risk opportunity to jump into the DJUSRP. Does the support hold? A close beneath 497-498 would be potential confirmation of further downside ahead. The upside, however, would be the December high near 550.
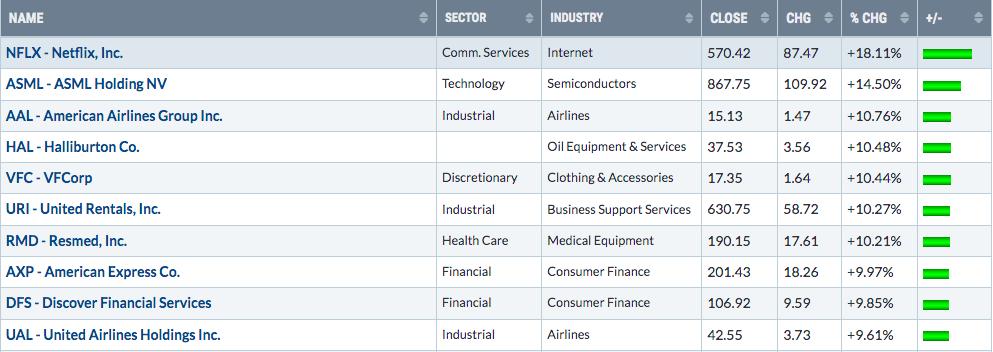
Top 10 Stocks - S&P 500/NASDAQ 100
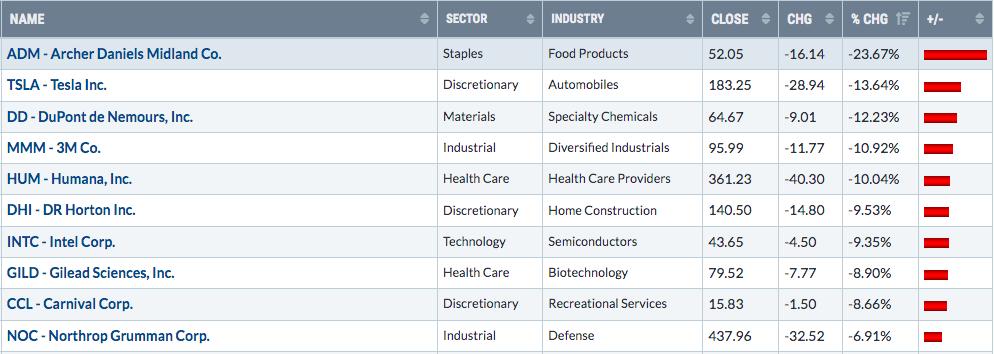
Bottom 10 Stocks - S&P 500/NASDAQ 100
Big Picture
After finally clearing 4800 and closing at fresh all-time highs, the S&P 500 quickly cleared 4900, although we're still waiting for our first close above 4900. The next level is obvious: 5000. That's a MAJOR psychological level and I don't think we'll easily blast through it. In fact, if you recall from MarketVision 2024, that's the level I thought we might touch in Q1, before backing off and seeing more potential weakness. History tells us that maintaining a bullish stance after mid-February can prove to be a big mistake. Presidential Election years (like the one we're in) have also shown a late-February to mid-March swoon. I'm not predicting a major selloff, just saying that I wouldn't be surprised to see one. I believe it could happen and be a part of our longer-term secular bull market. Stocks don't always go straight up. Pullbacks along the way are healthy and once Q4 earnings season is complete, don't be shocked to see history repeat itself.
Here's the long-term picture that we need to be reminded of periodically:
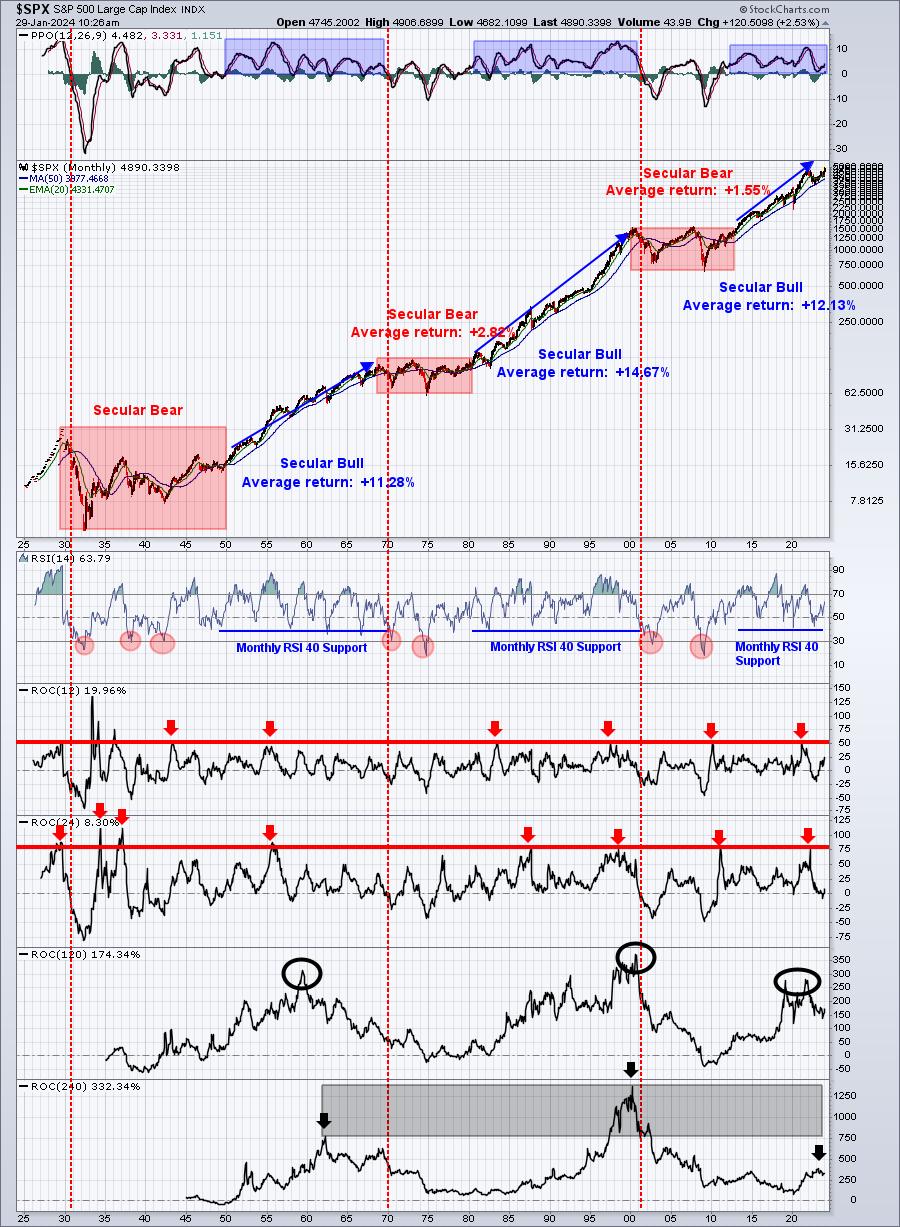
I receive a ton of questions and, unfortunately, cannot respond to many. Those who write in, citing other "experts" that are calling for armageddon, normally won't get a response from me. First, I try to avoid reading the countless articles and opinions about how the stock market is going to collapse. They call 50 of every 2 bear markets and it's not worth my time. Many of these so-called experts never can be swayed from the dark side, ALWAYS calling for bear markets. Reading these isn't much different than watching the CNBC train wreck. It's very easy to be manipulated by false stories, claims, and propaganda from services that have an agenda. I try my absolute best to be objective. Many perceive my bullish convictions during secular bull markets as being "perma-bull". My answer? Whatever. I call what I see. Many who do view me as a perma-bull did not follow me at the beginning of 2022, when I was one of the few calling for weak market action in 2022 after entering the year at an all-time high.
I look at market conditions to evaluate RISK, not to provide guarantees of market direction. However, my "home base" is that I'm bullish, because the stock market goes up A LOT more often than it goes down. Look again at the chart above and tell me WHY anyone would want to have a bearish "home base"?
I mention all of this, because one member did write in to ask about one service that follows Elliott Wave. That service apparently is calling for a bear market to last 13 to 21 years. Is it possible? I suppose anything is possible, but personally I'd spend ZERO time reading it. Again, look at the above chart. If you invest according to this "plan", I hope like crazy you're right. Because if I'm right, you'll miss probably another decade of above-average returns. And that DEVASTATES your financial future.
Please understand that scare tactics in marketing works better than any other form. If I wrote an article tomorrow that said, "We've Reached A Top And Here's How Low I Think We'll Go!", I can GUARANTEE you that this article will be read AT LEAST by TRIPLE the number that usually read my articles. It might be 5x or even more. It's a great way to reach the most people. Also, the majority of investors DO NOT trust the big Wall Street firms and are very skeptical by nature, so they're looking for folks who "speak their language". And that language is FEAR.
I'll tell you when I'm fearful, but I believe that EarningsBeats.com offers so much more than that.
Sentiment
Last week, I looked at the VIX and the long-term 253-day SMA of the equity only put call ratio ($CPCE). Both are on the bulls' side of the ledger. They support further gains ahead. This week, I'll turn to the shorter-term 5-day SMA version of the CPCE to look to see if the recent bullish market action and 4900 on the S&P 500 have made traders much more complacent. "Much more complacent" would result in 5-day SMA CPCE readings below .55, possibly even below .50. As a reminder, as option traders grow more pessimistic, we usually see this 5-day reading approach .75-.80 and potentially mark a bottom (green arrows). Here's where we stand now:
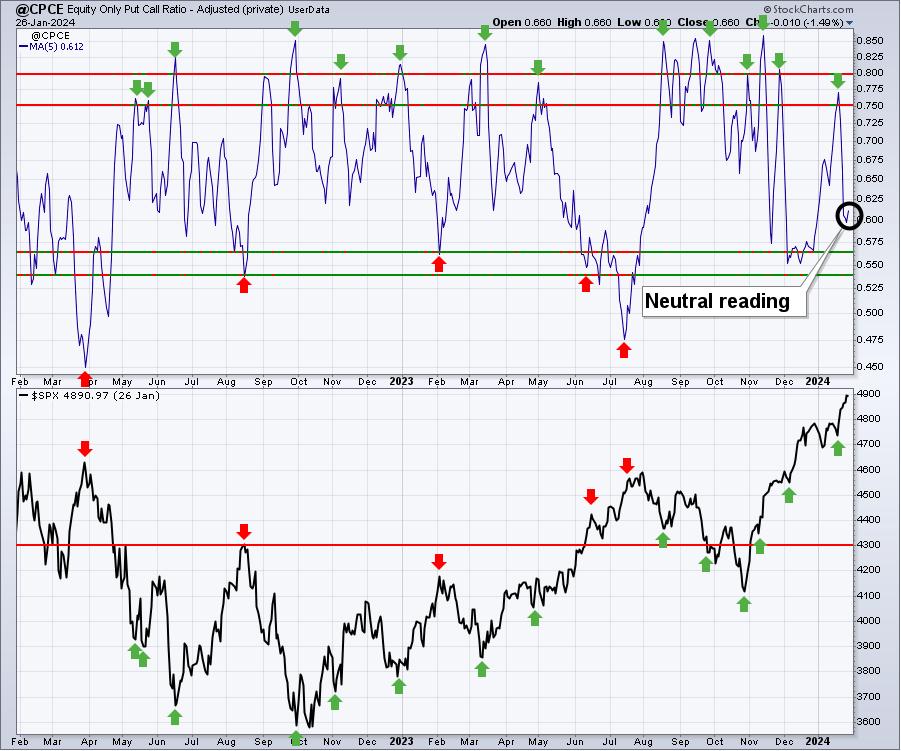
We have yet to reach the 0.55% area where we normally see short-term market tops. Therefore, the 5-day SMA remains neutral and is not really providing us any useful information regarding a possible short-term market top or bottom.
Rotation
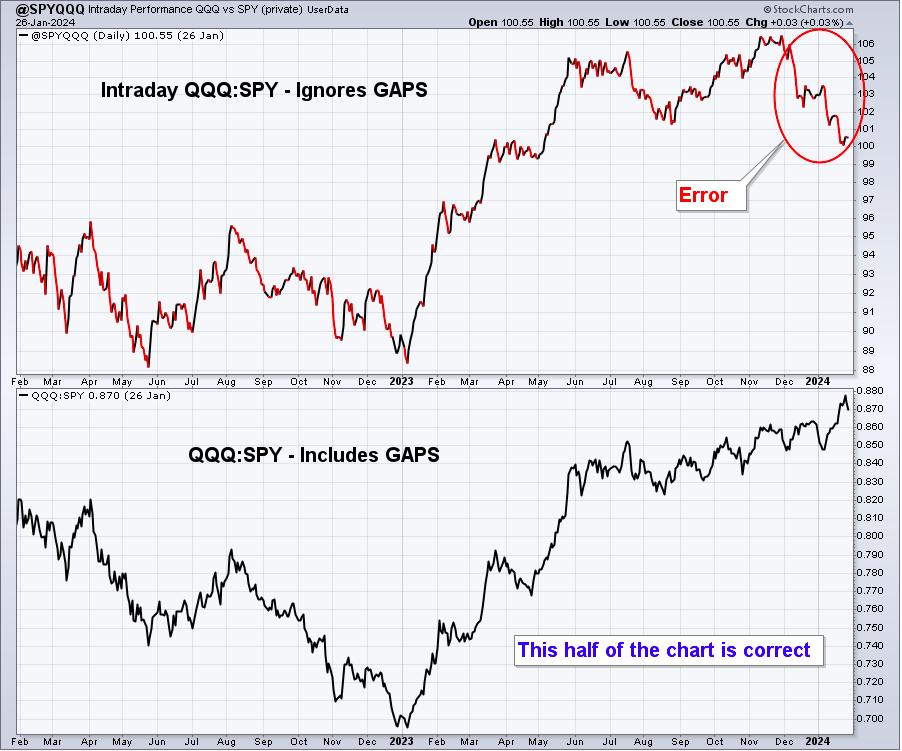
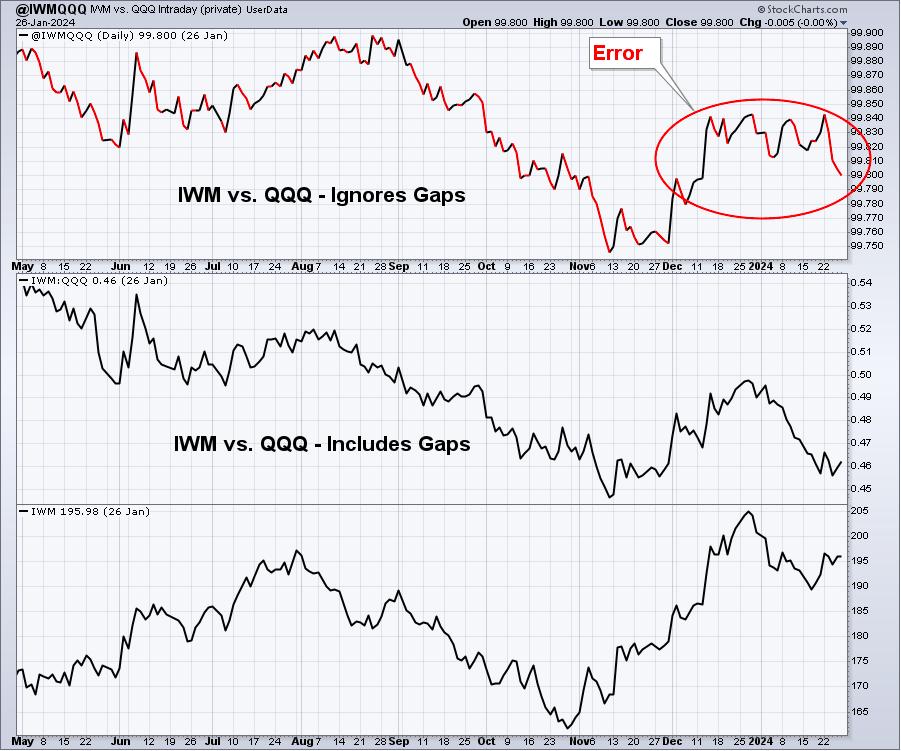
This morning, I found an error in my formulas in calculating both the QQQ:SPY and IWM:QQQ intraday relative performance and it will significantly lower the "ignoring gaps" half of these relative price charts. In other words, the intraday price action does not necessarily suggest intraday rotation has been favoring small caps and the S&P 500 - at least not nearly to the level that my previous charts were showing. The errors began in late November to early December, which is when the significant divergences began. After calculating this week WITH THE ERRORS, I'll show you what these two relative price charts (ignoring gaps) looked like, so I can circle what will change in next week's report:
QQQ:SPY
IWM:QQQ
There are no errors in the XLY:XLP chart below:
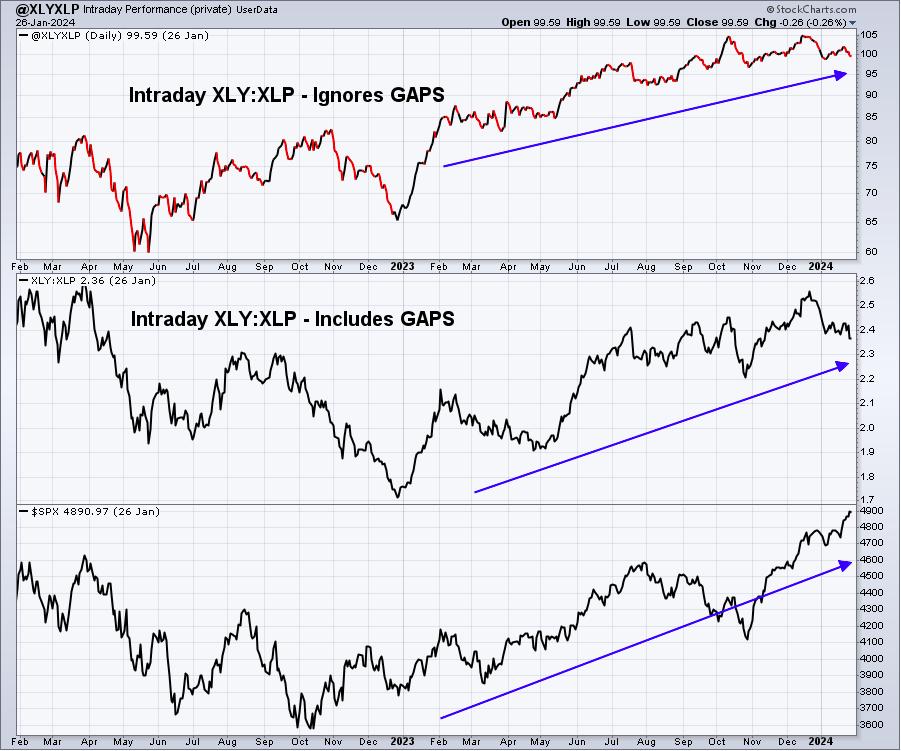
It will take me some time to correct these errors on my spreadsheet and to complete the User-Defined Indices that I keep with the correct daily numbers. Once I fix the errors, I'll post the updated charts in the Daily Market Report later this week. I'll also be sure to provide the corrected charts right here in next week's Weekly Market Report as well.
I apologize for these incorrect charts and will rectify them as quickly as possible. The biggest impact for me is that intraday rotation INTO small caps is NOT confirming what we saw during Q4, which was rotation into small caps and several value-oriented areas of the market. It does not change my bigger picture call of being bullish small caps, because the primary reason for the call was PERSPECTIVE and looking for a couple years' worth of relative underperformance to reverse. It also hasn't changed my own weighting of small caps in my own portfolios. But clearly, I've lost some confirmation of that 2024 call.
Trade Setup
Since beginning this Weekly Market Report in early September, I've discussed the long-term trade candidates below that I really like. Generally, these stocks have excellent long-term track records. Only in very specific cases (exceptions) would I consider a long-term entry into a stock that has a poor or limited long-term track record. Check these out:
- JPM
- BA
- FFIV
- UPWK (exception, limited history) - a heavy volume push through 16 would be very bullish
- MA
- GS - breaking trendline resistance near 350-355 would be very bullish
- FDX
- AAPL
- CHRW
- JBHT
- STX
- HSY
- DIS
- MSCI
- SBUX
I did not find a great long-term candidate to add this weekend, so I'll look again next week. Based on Presidential Election year cycles that suggest bottoms in March, adding a few companies in March may make good sense. I'll likely add 2-3 during February as well.
Looking Ahead
Upcoming Earnings:
We're moving into a VERY important week for earnings. I've identified what I believe are key companies that will report this week, with their respective market caps in parenthesis. This is NOT a list of ALL companies reporting this week, so please be sure to check for earnings of any companies that you own or add. Any companies in BOLD represents stocks on one of our Portfolios:
- Monday: NUE ($43 billion)
- Tuesday: MSFT ($3.0 trillion), GOOGL ($1.9 trillion), AMD ($289 billion), SBUX ($105 billion)
- Wednesday: MA ($410 billion), QCOM ($173 billion), BA ($122 billion)
- Thursday: AAPL ($3.0 trillion), AMZN ($1.6 trillion), META ($1.0 trillion)
- Friday: XOM ($405 billion), ABBV ($297 billion), CVX ($280 billion)
Key Economic Reports:
- Monday: None
- Tuesday: FOMC meeting begins, November Case-Shiller home price index, November FHFA house price index, January consumer confidence, December JOLTS
- Wednesday: January ADP employment report, January Chicago PMI, FOMC announcement
- Thursday: Initial jobless claims, Q4 productivity and costs, January PMI manufacturing index, January ISM manufacturing index, December construction spending
- Friday: January nonfarm payrolls, January consumer sentiment, December factory orders
Historical Data
I'm a true stock market historian. I am absolutely PASSIONATE about studying stock market history to provide us more clues about likely stock market direction and potential sectors/industries/stocks to trade. While I don't use history as a primary indicator, I'm always very aware of it as a secondary indicator. I love it when history lines up with my technical signals, providing me much more confidence to make particular trades.
I'm now providing a bigger window into the historical numbers ahead. Below you'll find the next two weeks of historical data and tendencies across the 3 key indices that I follow most closely:
S&P 500 (since 1950)
- January 29: +17.60%
- January 30: +2.58%
- January 31: +83.19%
- February 1: +42.23%
- February 2: +41.30%
- February 3: +36.54%
- February 4: -18.82%
- February 5: -35.77%
- February 6: +32.77%
- February 7: +8.04%
- February 8: -37.29%
- February 9: -49.10%
- February 10: -1.93%
- February 11: +0.16%
NASDAQ (since 1971)
- January 29: +6.92%
- January 30: -3.96%
- January 31: +104.47%
- February 1: +114.44%
- February 2: +26.77%
- February 3: +39.22%
- February 4: -14.48%
- February 5: -25.82%
- February 6: +66.65%
- February 7: -11.89%
- February 8: +8.22%
- February 9: -60.09%
- February 10: +25.71%
- February 11: +64.51%
Russell 2000 (since 1987)
- January 29: -15.02%
- January 30: -72.65%
- January 31: +135.91%
- February 1: +192.59%
- February 2: +27.66%
- February 3: +60.01%
- February 4: -37.47%
- February 5: -22.38%
- February 6: +71.85%
- February 7: +13.16%
- February 8: +16.94%
- February 9: -38.31%
- February 10: -25.82%
- February 11: +94.21%
The S&P 500 data dates back to 1950, while the NASDAQ and Russell 2000 information date back to 1971 and 1987, respectively.
The best part of Q1 is behind us. But we do see fairly nice action as we close out January and open up February. It likely relates to new money coming into the market in early February, with institutional money coming in just prior - a legal form of "frontrunning".
Final Thoughts
The S&P 500 has broken 4900 on an intraday basis and is literally challenging that psychological level right now as we attempt to close ABOVE 4900 for the first time in history. We're not exactly flying higher now, but the boring fractional gains that we typically see with a VIX below 15 is certainly here. In the near-term, we've been dealing with hourly negative divergences on both the S&P 500 and NASDAQ 100, but with the bears unable to gain control of the action. Sometimes, these negative divergences play out as price action simply moves sideways, while the hourly PPO works its way back to centerline support. That appears to be the case now. I've been mentioning that Presidential Election years have a history of finding lows in March and I don't see anything yet that would suggest it won't happen again. Earnings have been strong, supporting these price levels. Here are a few things I'll be focused on in the week ahead:
- Fed meeting. It begins tomorrow and ends on Wednesday at 2pm ET. Very few expect the Fed to make any changes in the fed funds rate as they monitor economic strength and inflationary pressures. I rarely consider the Fed a non-factor, but, unless there are significant changes in its policy statement, I consider the Fed this week to be mostly a non-factor.
- Nonfarm payrolls. The report will be out on Friday and consensus estimates have the number pegged at 170,000, slightly below the December level of 216,000. Keep an eye on average hourly earnings, which are expected to decline slightly from +0.4% in December to +03% in January
- Earnings. Now we're going to see several HUGE names report their quarterly results this week. Among them, we'll see MSFT, GOOGL, AMD, SBUX, AAPL, AMZN, and META. These 7 companies represent more than 25% of the S&P 500's market cap. To a large degree, the reaction to their reports is going to drive short-term stock market action.
- 10-year treasury yield ($TNX). I view the current range on the TNX to still be roughly 3.80%-4.20%. We have a Fed meeting this week and we need to watch for any bond market reactions that send yields outside of this range.
- Sentiment. If we keep rising throughout this week, let's keep an eye on the 5-day moving average of the $CPCE. It could provide us a signal of a short-term top. Currently, it's neutral.
Feedback
If you'd like to share your thoughts on our Weekly Market Report, positive or negative, you can reach us at "[email protected]".
Happy trading!
Tom