
EB Weekly Market Report - S/T Warning Signs Building - Saturday, January 25, 2025
ChartLists Updated
The following ChartLists were updated over the weekend:
- Strong Earnings (SECL)
- Strong Future Earnings (SFECL)
- Raised Guidance (RGCL)
- Bullish Trifecta (BTCL)
These ChartLists will be available to download on Monday into your StockCharts Extra or Pro account, if you have a StockCharts membership. Otherwise, we can send you an Excel file with the stocks included in these ChartLists in order to download them into other platforms. If you have any questions, please reach out to us at "[email protected]".
Important Note
I am sending this weekly report out early (usually published on Monday afternoons) as I see clouds building on the horizon. Please pay particular attention to the Sentiment section today. The 5-day SMA of the CPCE is nearing levels where the S&P 500 has struggled over the past several years. While I'm not quite ready to call for a major top, this is what I'd consider to be a "developing" story. If we get good news this week and we can't build on the all-time highs established last week, that could be another signal to support the overzealous buyers potentially marking a top.
Weekly Market Recap
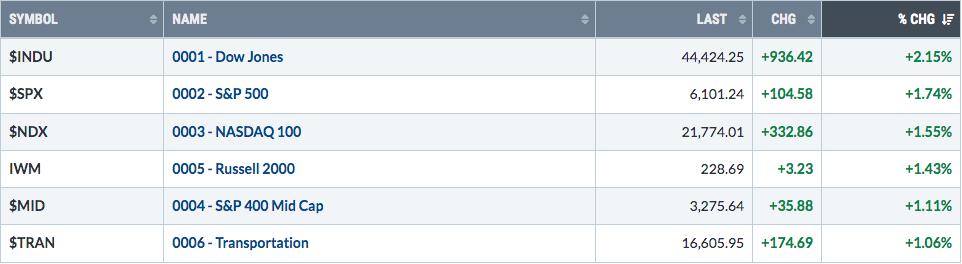
Major Indices
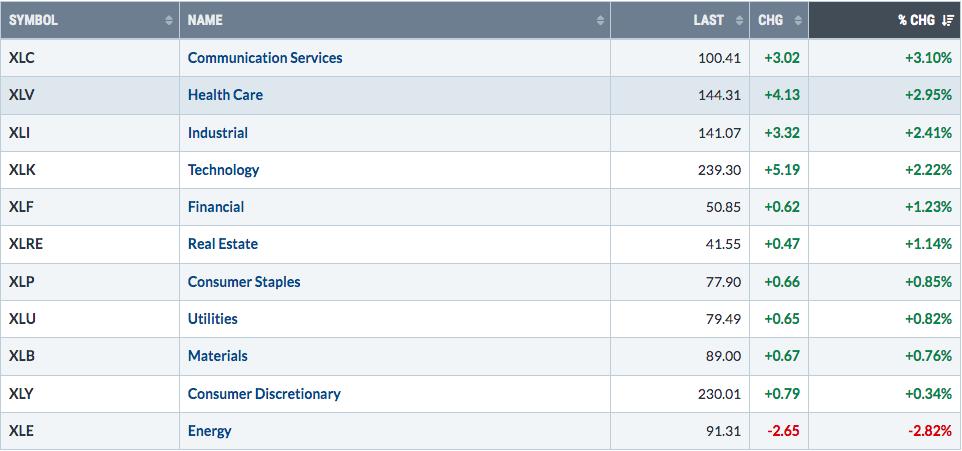
Sectors
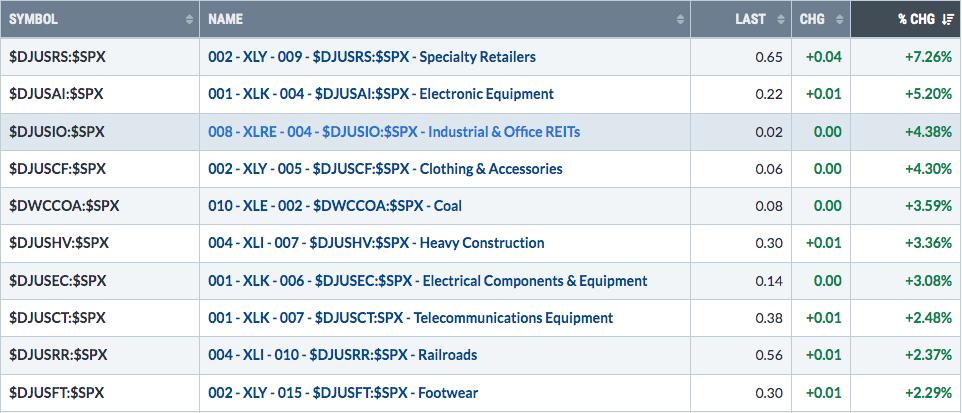
Top 10 Industries Last Week
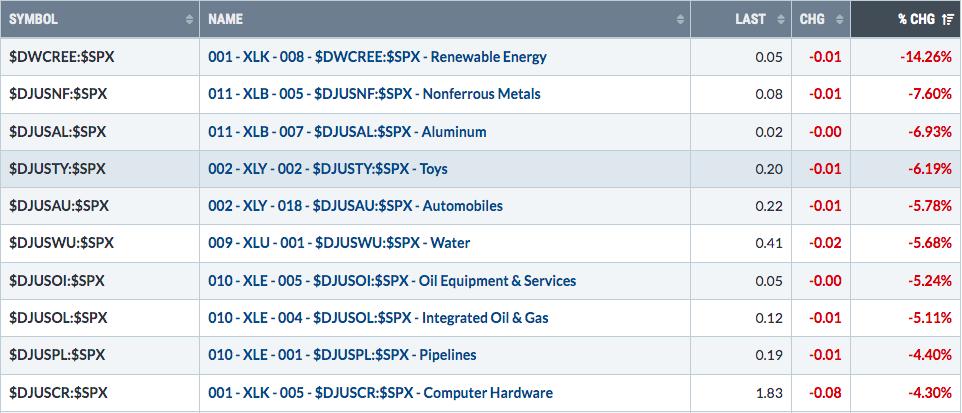
Bottom 10 Industries Last Week
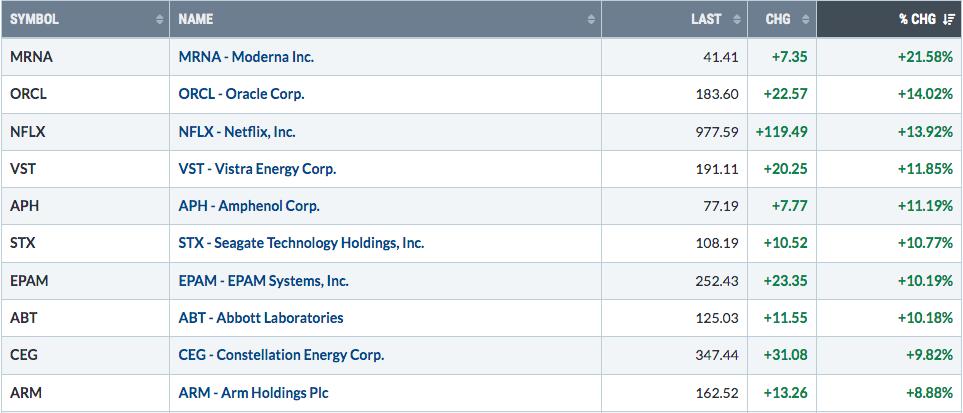
Top 10 Stocks - S&P 500/NASDAQ 100
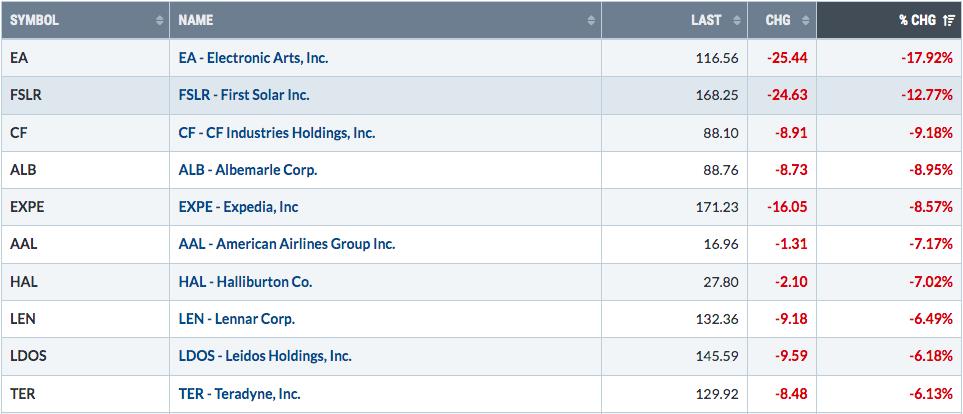
Bottom 10 Stocks - S&P 500/NASDAQ 100
Big Picture
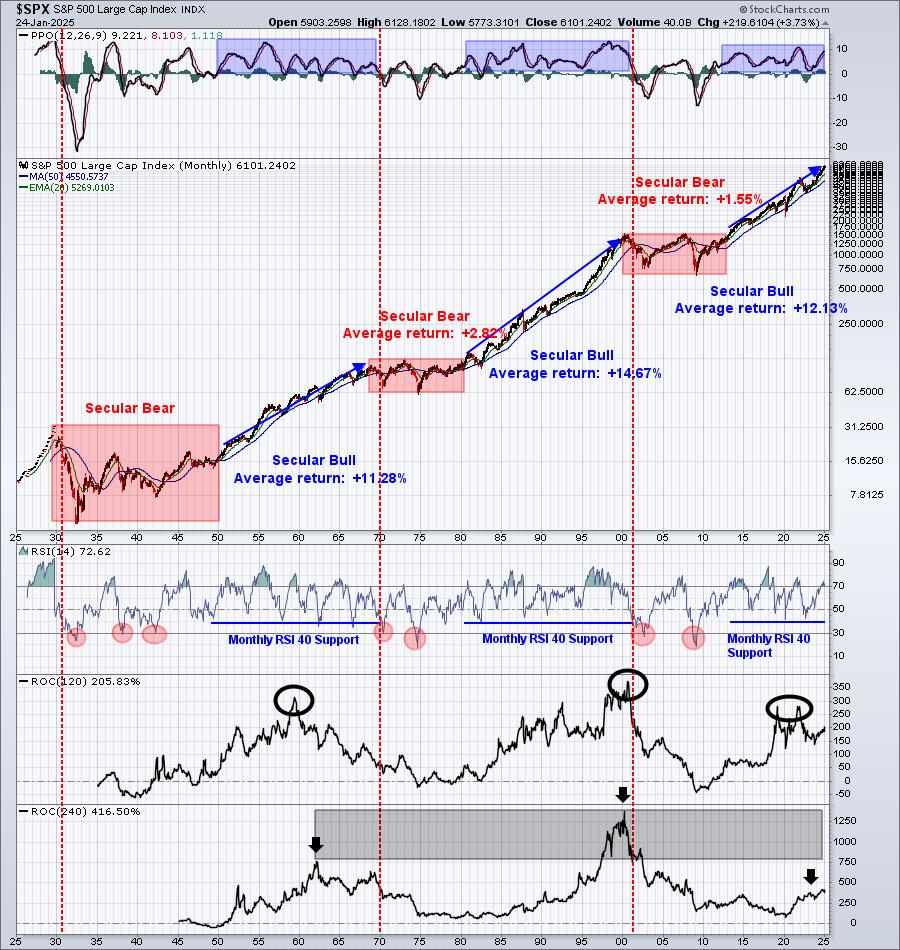
We ended last week just above the 6100 level after setting all-time intraday highs on both Thursday and Friday. As this chart suggests, it simply does not pay to continuously expect bearish developments in the S&P 500. Take advantage of the long-term success of U.S. stocks by remaining fully invested nearly all of the time from a long-term investor perspective.
Sustainability Ratios
Here's the latest look at our key intraday ratios as we follow where the money is traveling on an INTRADAY basis (ignoring gaps):
QQQ:SPY
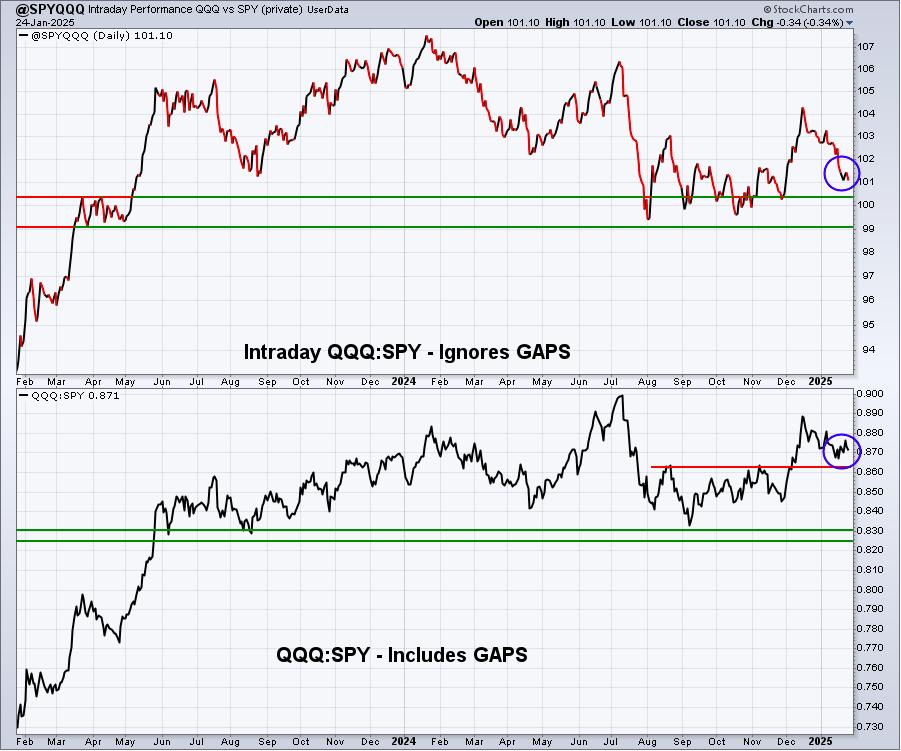
Given the sentiment issues discussed above, it makes sense to be a little worried about the top panel of this chart. Despite the rally to an all-time high on the S&P 500, this intraday QQQ:SPY ratio continues falling. While not a major signal, it does potentially add to the bearishness found in sentiment.
IWM:QQQ
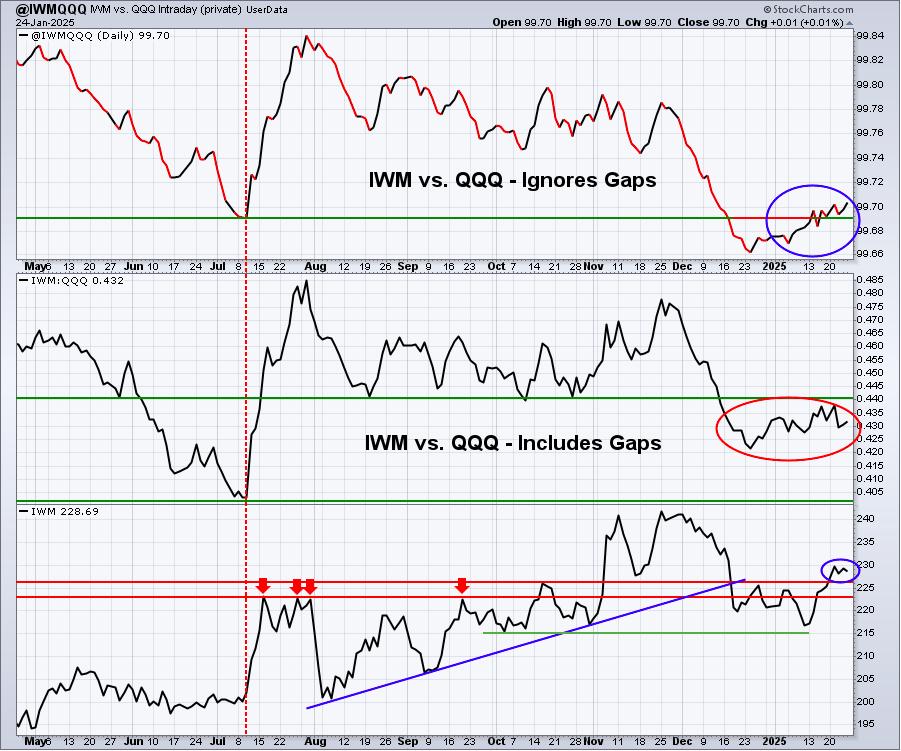
I am seeing continuing improvement on this ratio chart comparing small caps to large caps. Could small caps keep moving higher, while the large caps take a break? I don't know, but I'll stick with small caps as long as price support in the 225-227 range holds. The next week or two could be quite interesting.
XLY:XLP
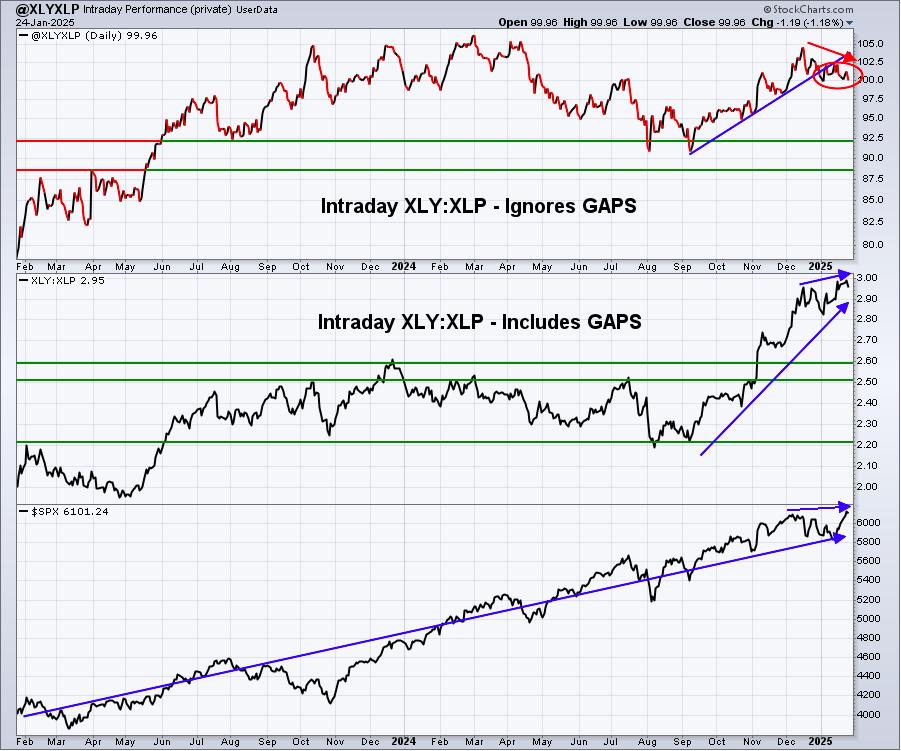
The strength in this ratio had been very bullish, but that top panel has turned lower, which is a bit worrisome, especially with other warning signs beginning to appear.
Sentiment
5-day SMA ($CPCE)
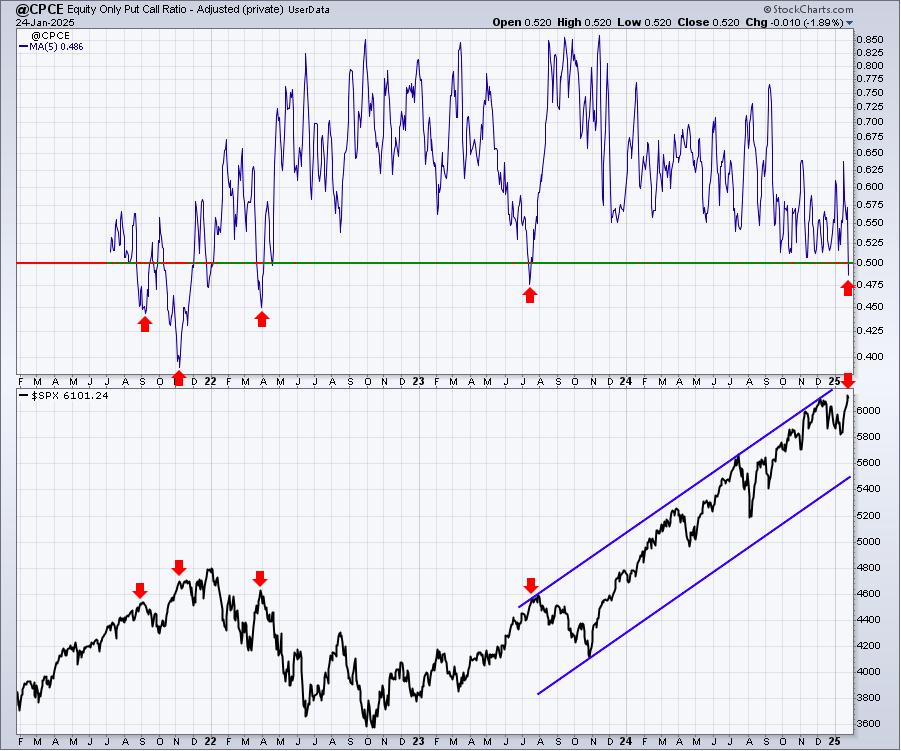
Sentiment indicators are contrarian indicators. When they show extreme bullishness, we need to be a bit cautious and when they show extreme pessimism, it could be time to become much more aggressive. Major market bottoms are carved out when pessimism is at its absolute highest level.
The above chart is one that would keep me awake at night. This isn't rocket science. When everyone decides it's time to get aggressively long, especially with options, then we should begin to at least turn cautious.
253-day SMA ($CPCE)
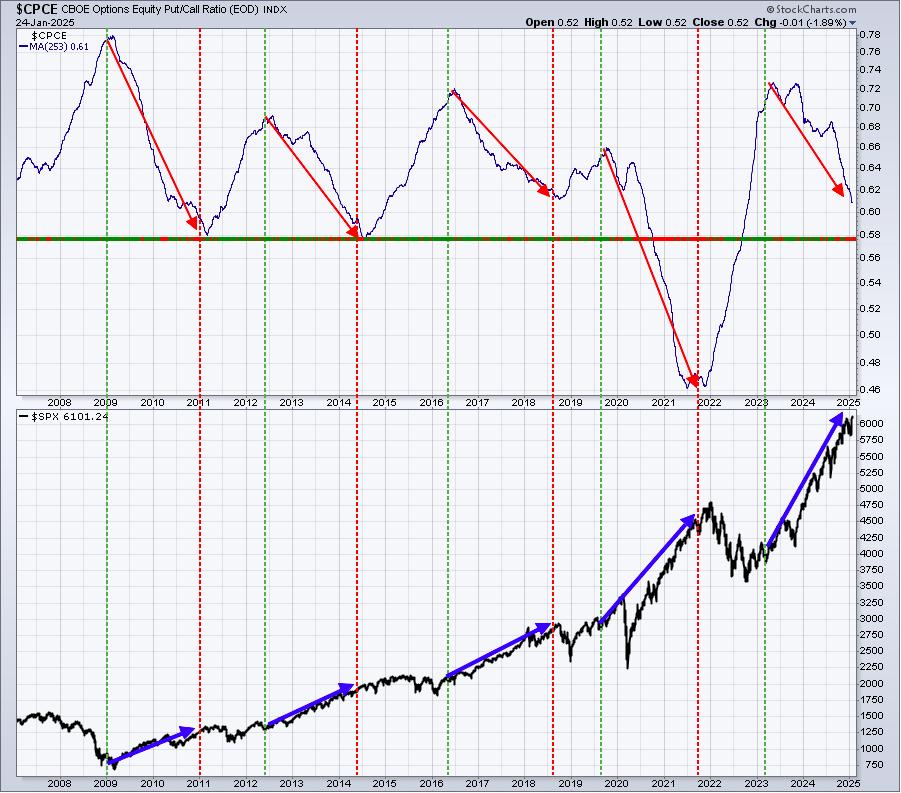
This signal is unmistakeable, but long-term in nature. Currently, long-term sentiment is falling from its very bearish double top in 2023. It is, however, moving closer and closer to other key bottoms. Of the 4 major bottoms on the upper part of this chart, the 253-day SMA of the CPCE reached .62 once and .58 twice. Right now, we're at .61 and it's definitely concerning that the 5-day SMA of the CPCE is starting to warn us of a potential top. Let me be very clear, though. IF we see weakness ahead, I believe it'll be part of a bigger longer-term bullish story. I think the odds of a correction (10% drop or more) are growing and, if we see one, it would be a HUGE buying opportunity somewhere in the 5500-5600 area.
Growth vs. Value
An interesting change is taking place on this S&P 500 chart. Below the S&P 500 price action, I show 3 growth vs. value ratios - large cap, mid cap, and small cap. Check it out:
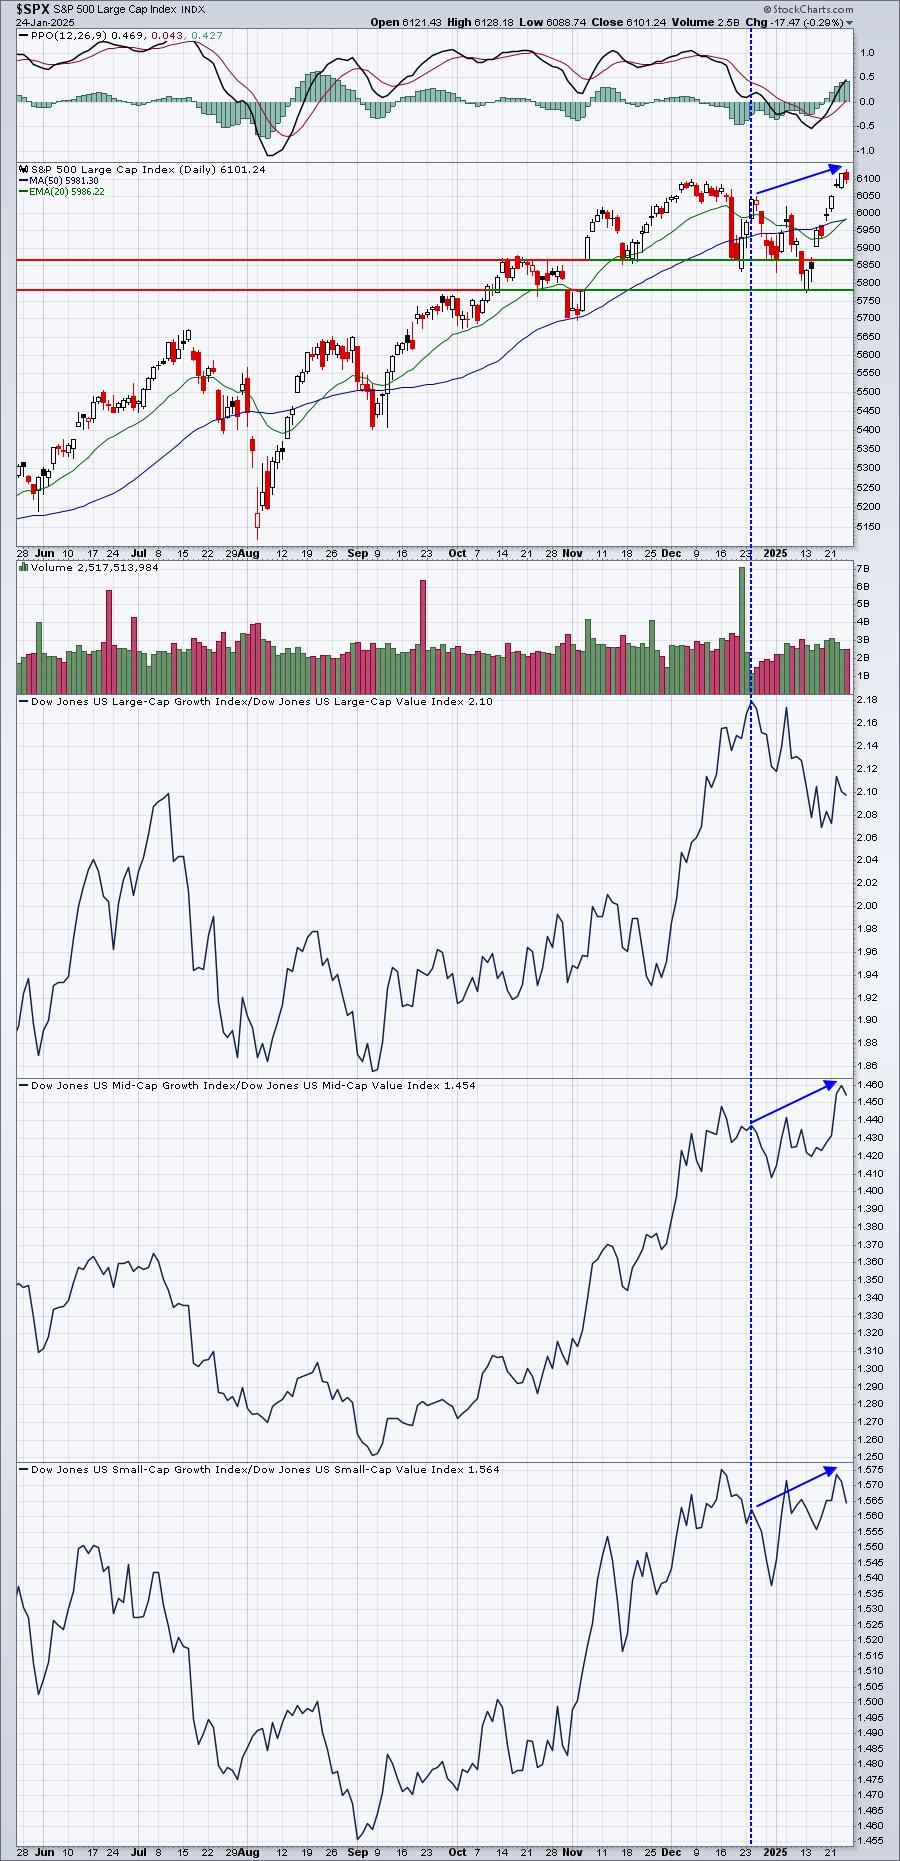
This hasn't happened often over the past several years, but large cap growth has been falling vs. large cap value the past month, while both mid cap growth and small cap growth is improving vs. their respective value stocks. Is this supporting my possible short-term theory that, if the S&P 500 corrects, money will rotate to mid caps and small caps? Hhhhmmmm.....
Long-Term Trade Setup
Since beginning this Weekly Market Report in September 2023, I've discussed the long-term trade candidates below that I really like. Generally, these stocks have excellent long-term track records and many pay nice dividends that mostly grow every year. Only in very specific cases (exceptions) would I consider a long-term entry into a stock that has a poor or limited long-term track record and/or pays no dividends. Below is a quick recap of how I viewed their long-term technical conditions two weeks ago:
- JPM - enjoying one of its best rallies in its long history
- BA - a move through 183 or so could really kick start the stock
- FFIV - new highs in place, but volume is tailing off with a negative divergence on weekly chart, may pause here
- MA - looking for next all-time high breakout
- GS - excellent uptrend in place
- FDX - tested 20-month EMA, 310 area is critical resistance until broken
- AAPL - has run into short-term selling, likely solid entry here
- CHRW - consolidating after 50% move higher in 2024
- JBHT - remains in lengthy consolidation period
- STX - great start to 2025, needs to clear resistance in 110-115 area
- HSY - brutal 25%+ drop over past 5-6 weeks, loves next few months historically
- DIS - after 6 weeks of selling, resuming strength the past week
- MSCI - continuing to trend higher, sights set on late-2021 and all-time high near 650
- SBUX - building bullish short-term momentum
- KRE - has received boost in 2025 as 10-year treasury yield ($TNX) topped and reversed
- ED - been weak, but long-term support remains intact
- AJG - one of most consistent and dependable uptrends off of pandemic low in 2020
- NSC - late stage cup with handle pattern on monthly chart, will likely lead to a solid 2025
- RHI - long-term price support is in 58-60 area, still looks solid as a long-term buy and hold
- ADM - remains in 2-year downtrend, could potentially reach key support from 40-43
- BG - continues to test key price support in the 75-80 range, monthly RSI at 40
- CVS - awesome response as buyers have poured in off of recent 43-44 price support test
- IPG - 3-year consolidation has stock in middle of its 15-month 26-32 price range
- HRL - bound between price support at 27.50 and 20-month EMA resistance at 33.07
We're going to add one stock this week. Typically, we're looking for stocks that have been downtrending and find key levels where support and reversals have been found in the past. Sometimes, it's a monthly PPO that hits centerline support or perhaps a monthly RSI test at or near 40. This time, Deere & Co (DE) has recently made a breakout after a few years of consolidation on its long-term monthly chart:
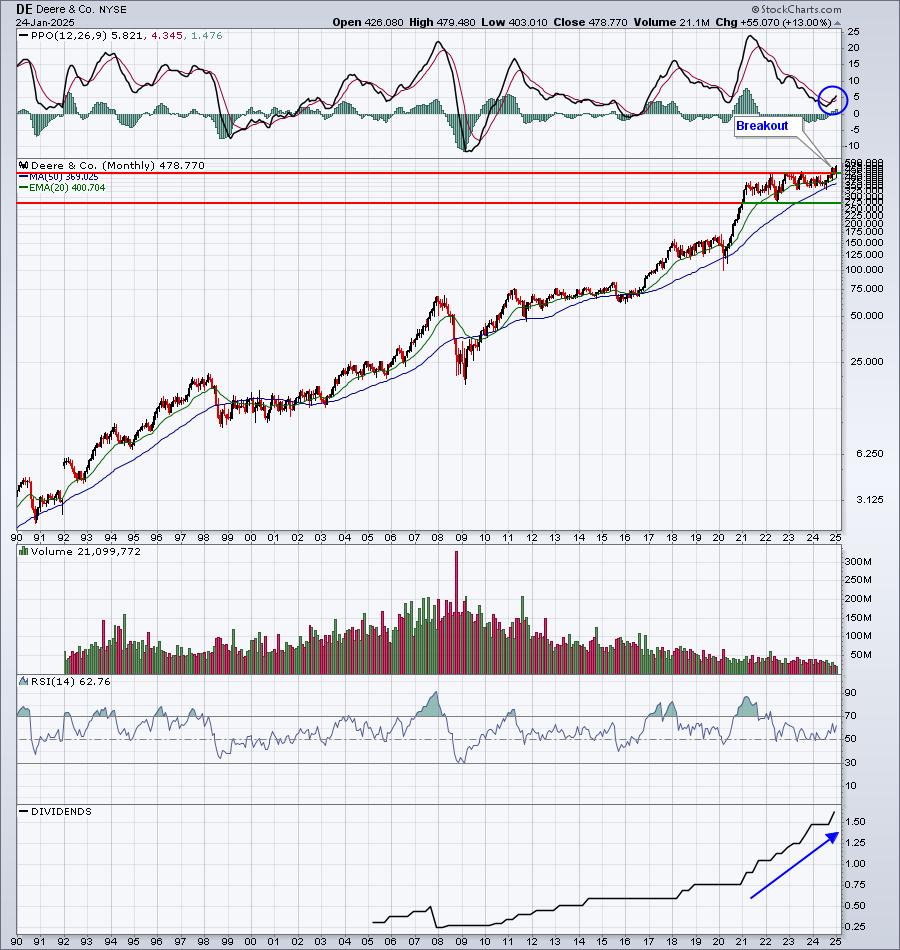
In addition to the price breakout, I love the monthly PPO turning up from near centerline support and I also like the fact that the dividend has more than doubled since 2021.
Keep in mind that our Weekly Market Reports favor those who are more interested in the long-term market picture. Therefore, the list of stocks above are stocks that we believe are safer (but nothing is ever 100% safe) to own with the long-term in mind. Nearly everything else we do at EarningsBeats.com favors short-term momentum trading, so I wanted to provide an explanation of what we're doing with this list and why it's different.
Also, please keep in mind that I'm not a Registered Investment Advisor (and neither is EarningsBeats.com nor any of its employees) and am only providing (mostly) what I believe to be solid dividend-paying stocks for the long-term. Companies periodically go through adjustments, new competition, restructuring, management changes, etc. that can have detrimental long-term impacts. The stock price nor the dividend is ever guaranteed. I simply point out interesting stock candidates for longer-term investors. Do your own due diligence and please consult with your financial advisor before making any purchases or sales of securities.
Looking Ahead
Upcoming Earnings
Q4 earnings are now underway and the banks will be welcoming in a number of other areas of the market this week. The following list of companies is NOT a list of all companies scheduled to report quarterly earnings, however, just key reports, so please be sure to check for earnings dates of any companies that you own. Any company in BOLD represents a stock in one of our portfolios and the amount in parenthesis represents the market capitalization of each company listed:
- Monday: T ($162 billion)
- Tuesday: SAP ($338 billion), RTX ($168 billion), LMT ($118 billion), SBUX ($111 billion)
- Wednesday: MSFT ($3.32 trillion), META ($1.61 trillion), TSLA ($1.32 trillion), NOW ($234 billion)
- Thursday: AAPL ($3.36 trillion), V ($611 billion), MA ($490 billion), CAT ($196 billion)
- Friday: XOM ($484 billion), ABBV ($302 billion), CVX ($280 billion)
Key Economic Reports
- Monday: New home sales
- Tuesday: Case-Shiller 20-city home price index, consumer confidence, durable goods
- Wednesday: FOMC policy statement
- Thursday: Q4 GDP, initial jobless claims, pending home sales
- Friday: PCE price index
Historical Data
I'm a true stock market historian. I am absolutely PASSIONATE about studying stock market history to provide us more clues about likely stock market direction and potential sectors/industries/stocks to trade. While I don't use history as a primary indicator, I'm always very aware of it as a secondary indicator. I love it when history lines up with my technical signals, providing me much more confidence to make particular trades.
Below you'll find the next two weeks of historical data and tendencies across the 3 key indices that I follow most closely:
S&P 500 (since 1950)
- Jan 27: +7.75%
- Jan 28: +54.14%
- Jan 29: +20.88%
- Jan 30: +2.25%
- Jan 31: +74.10%
- Feb 1: +47.30%
- Feb 2: +45.54%
- Feb 3: +36.54%
- Feb 4: -18.82%
- Feb 5: -36.61%
- Feb 6: +33.23%
- Feb 7: +11.83%
- Feb 8: -36.33%
- Feb 9: -45.50%
NASDAQ (since 1971)
- Jan 27: -43.49%
- Jan 28: +82.12%
- Jan 29: +14.37%
- Jan 30: -8.89%
- Jan 31: +87.33%
- Feb 1: +119.96%
- Feb 2: +37.65%
- Feb 3: +39.22%
- Feb 4: -14.48%
- Feb 5: -26.49%
- Feb 6: +65.38%
- Feb 7: -5.45%
- Feb 8: +9.50%
- Feb 9: -50.46%
Russell 2000 (since 1987)
- Jan 27: -99.42%
- Jan 28: +42.00%
- Jan 29: +1.83%
- Jan 30: -77.20%
- Jan 31: +107.92%
- Feb 1: +198.28%
- Feb 2: +21.08%
- Feb 3: +60.01%
- Feb 4: -37.47%
- Feb 5: -34.16%
- Feb 6: +77.32%
- Feb 7: +11.10%
- Feb 8: +29.93%
- Feb 9: -22.55%
The S&P 500 data dates back to 1950, while the NASDAQ and Russell 2000 information date back to 1971 and 1987, respectively.
Final Thoughts
Throughout the past several years, some of the stock markets worst moves have been after Fed Chief Jay Powell has opened his yap and contradicted something from his immediate past, leaving Wall Street confused. There's been an obvious lack of trust in the Fed, at least in my opinion, and that could continue to play a hand in very choppy stock market behavior during Q1 2025. Last week's rally to a new all-time high in the S&P 500 was nice, especially with strength seen in our aggressive sectors. However, what might Powell have to say this week? Here are the primary themes I'll be watching in the week ahead:
- The Fed. Honestly, I'm just looking for a little consistency from the Fed. Is that asking too much? Stop waffling, playing it safe, and show some conviction! Please? I'll be watching closely on Wednesday at 2pm ET as that's when the fireworks are likely to begin. It's widely expected that the Fed will keep the fed funds rate unchanged at this meeting, but will they make any adjustments to the expected rate cuts later in 2025?
- Earnings. The banks have set the stock market up very nicely, with some excellent quarterly results announced thus far. This week, we'll begin hearing from a few heavyweights that have the ability to really move the markets, companies like AAPL, MSFT, META, TSLA, V, MA, NOW, IBM, CAT, UPS, LRCX, KLAC.
- Volatility ($VIX). The VIX ended Friday at 14.85, close to where it was the Friday before the last Fed meeting (13.81). Then the Fed happened and 3 days later, the VIX hit 28. I see no reason for the Fed to drop any bombs this time around, but who knows? Also, with a few warning signs present, a suddenly-surging VIX could be quite problematic.
- Seasonality. Both the S&P 500 and NASDAQ have shown excellent trends in the past as January winds down and February begins. If the Fed can manage to stay out of the way, I would not be at all surprised to see our major indices tack on additional gains into record all-time high territory this week, but how do underlying signals react? That'll be key.
- Q4 GDP. We'll get our initial reading of Q4 GDP, providing our first clues about economic strength in the most recent quarter. Q3 GDP ended at 3.1%.
- January Effect. This week is the final week of January. History tells us that the stronger that January performs, the stronger the balance of the year will perform. Finishing strong this week could have very positive implications for the S&P 500 over the balance of the year.
- Equity Only Put Call Ratio ($CPCE). As I've shown above, the CPCE's 5-day moving average has moved to an overly bullish level that has led previously to a cyclical bear market (2022) and also a correction (2023). I'm certainly not convinced that we'll see big selling ahead, but I do expect 2025 to be choppy, so I won't rule it out. If our heavy hitters (think AAPL, MSFT, META, TSLA, AMZN, GOOGL) report solid results, but struggle to advance, that could be another signal to be careful ahead. I'll be watching closely for a potential top later in the week or possibly into early February.
Happy trading!
Tom