
EB Monthly Seasonality Report - January 2026
A Look Back At December Stocks:
Last month, we released our list of the Top 20 large cap stocks (plus 5 small cap stocks) that had strong historical track records during the month of December. Here are how they performed in December 2025, in order of best to worst performer:
Large Caps:
- LULU: +12.83%
- JBL: +8.22%
- ON: +7.78%
- IVZ: +7.44%
- TER: +6.42%
- WDC: +5.56%
- LYV: +2.47%
- LLY: -0.07%
- STX: -0.47%
- CCEP: -1.08%
- EW: -1.64%
- EXR: -2.22%
- MPWR: -2.35%
- VTR: -4.03%
- MHK: -5.69%
- VLO: -7.90%
- BLDR: -8.32%
- SMCI: -13.53%
- AVGO: -14.11%
- LW: -29.07%
Small Caps:
- HCC: +12.62%
- REZI: +6.46%
- KTOS: -0.25%
- COLL: -0.81%
- COHU: -4.32%
The percentages represent the returns from the November 30th close to the December 31st close. The average performance of all 20 large cap stocks (-1.99%) trailed the S&P 500 (+0.08%) and the NASDAQ 100 (QQQ, -0.67%). The average performance of the 5 small cap stocks (+2.74%) easily outpaced the small cap Russell 2000 (IWM, -0.71%).
S&P 500 January Performance
The annualized performance of the S&P 500 (since 1950) during the month of January is quite solid from a long-term perspective as the S&P 500 has closed higher in January 46 times out of the last 76 years. There's one important thing to keep in mind when it comes to January performance. The most bullish period of the year is from the October 27th close through the January 18th close. So a very bullish historical season comes to an end on the 18th. This nearly 3-month period accounts for 50% of the gains on the S&P 500 since 1950. It doesn't mean that the market's guaranteed to move lower after January 18th. Instead, it simply means that we should perhaps adjust our bar of expectations a tad lower.
Since 1950, January has produced an annualized return of +13.10% on the S&P 500, which ranks 5th among all 12 calendar months. January gains have been more modest during the current secular bull market. Here's a breakdown of the historically strong and weak performance periods throughout January on the S&P 500 since 1950:
- January 1-6: +38.17%
- January 7-9: -31.47%
- January 10-18: +16.86%
- January 19-22: -19.08%
- January 23-31: +23.98%
I would certainly give a seasonal edge to the bulls, though recent years might want us to consider January historical performance as more of a neutral reading. It's worth mentioning, however, that January has been the best performing calendar month on the NASDAQ since 1971, with an annualized return of 29.99%. Like with the S&P 500, though, January returns during the secular bull market have been more modest since January 2014.
Sector Performance
Last month, real estate (XLRE) looked interesting, yet we saw mostly sideways action throughout the month. Instead, industrials (XLI) and financials (XLF) continued to show relative strength, as they typically do during Q4.
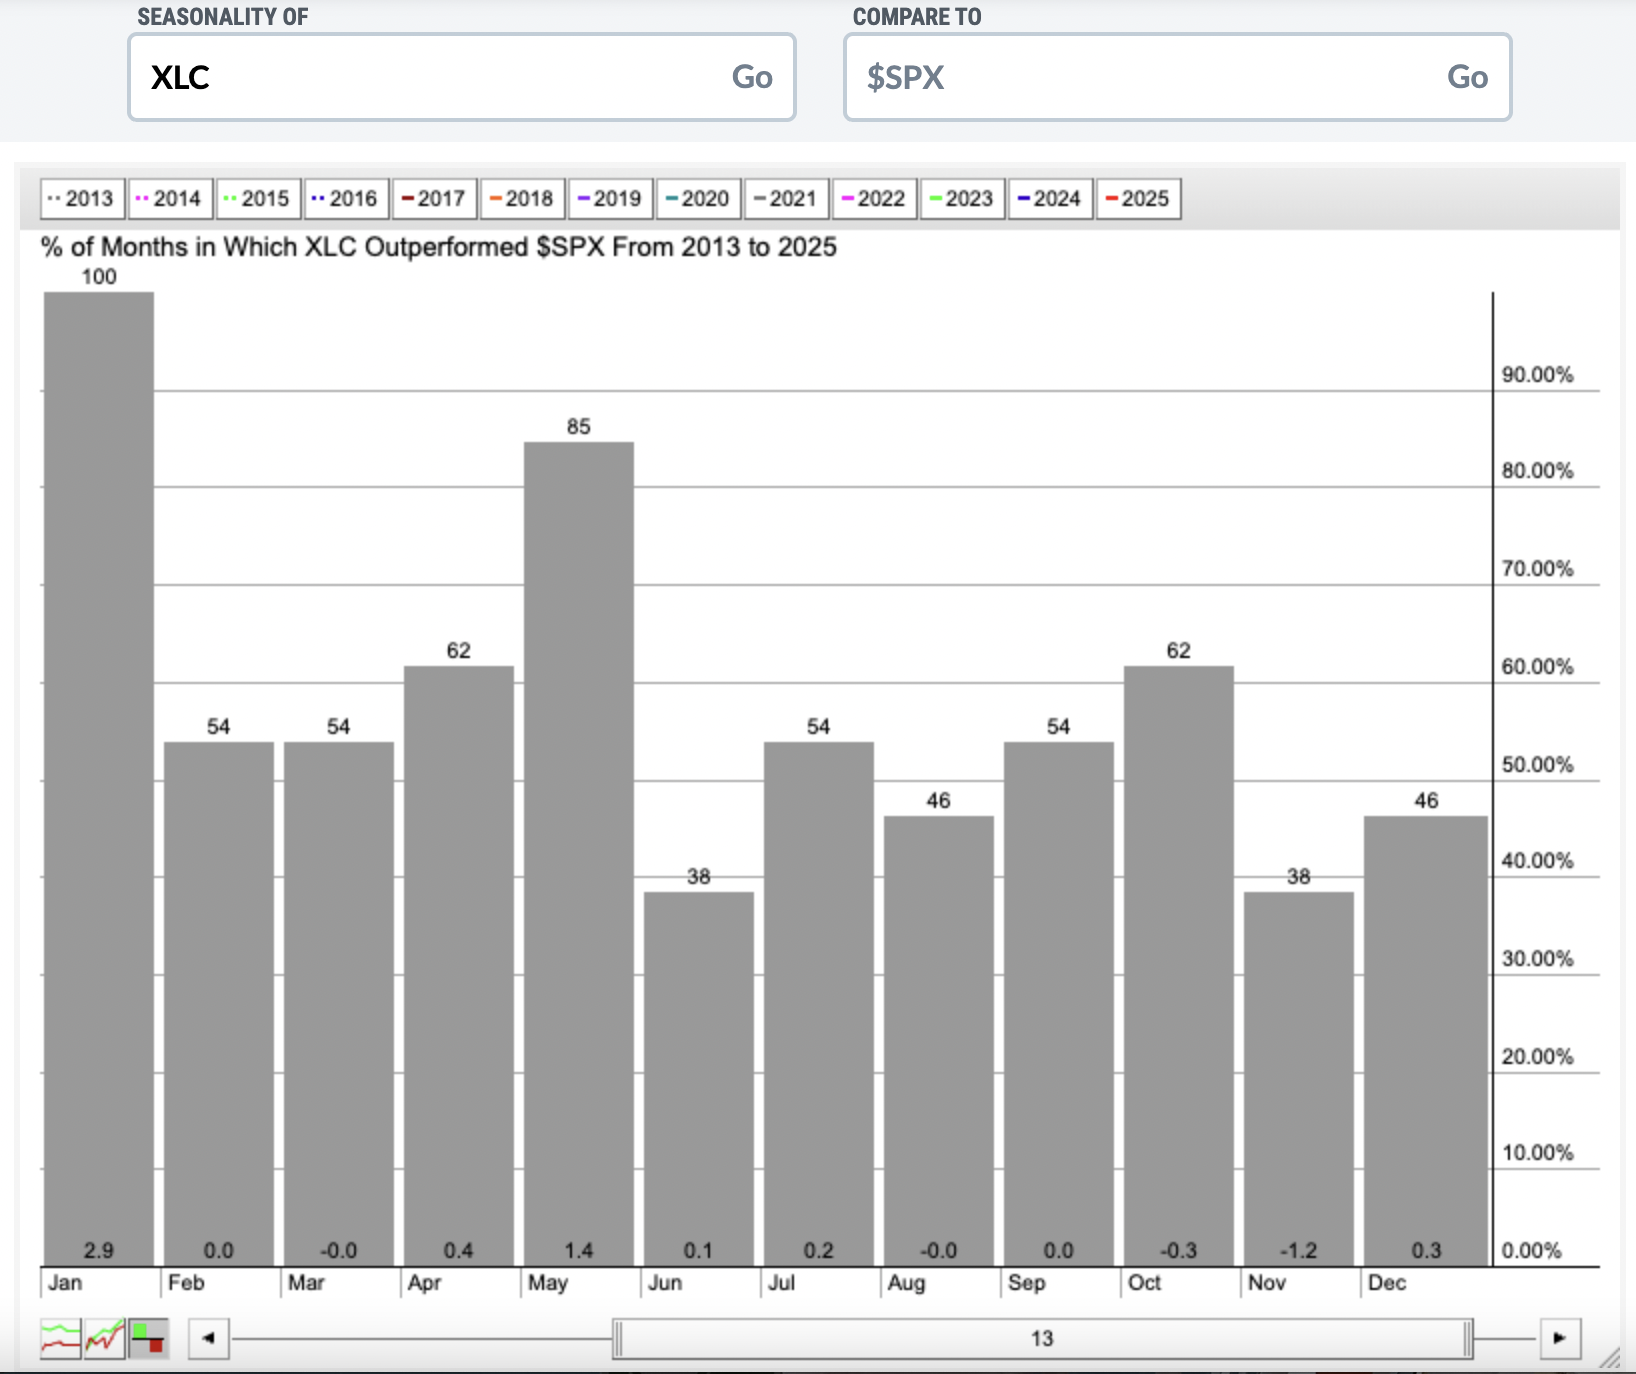
January usually caters to the communication services (XLC) sector as that group has typically jumped in January. In fact, since 2013, the XLC has outperformed the S&P 500 in every single January:
Technically, it appears that the XLC simply needs a breakout out of a bullish cup with handle continuation pattern:

The breakout would be a very bullish clue that the XLC might be looking to outperform the S&P 500 in January for the 14th straight year. For now, however, that red circle in the bottom panel is highlighting the relative weakness in January 2026 thus far.
Industry Performance
There is a very clear winner among industry groups within the communication services sector - internet ($DJUSNS). Here's how internet stocks have fared vs. the S&P 500 from 2013-2025:

Here are all industry groups that tend to perform much better than the benchmark S&P 500 during January, broken down by sector:
Technology (XLK):
- computer services, software
Consumer Discretionary (XLY):
- broadline retailers, home construction, gambling, specialty retailers, toys, recreational services
Communication Services (XLC):
- internet
Industrials (XLI):
- airlines, aerospace
Financials (XLF):
- specialty finance
Health care (XLV):
- medical equipment
Consumer staples (XLP):
- drug retailers, general retailers
Real estate (XLRE):
- mortgage REITs, office & industrial REITs
Utilities (XLU):
- water
Energy (XLE):
- oil equipment & services, pipelines
Materials (XLB):
- gold mining, mining
Stocks for January
A "Seasonality - January 2026" ChartList (annotated with 1 or 2 support levels to watch) will be created later today and will be added to our website later today or tomorrow.
You must be a StockCharts.com Extra or Pro member to download our ChartLists. Basic members and non-StockCharts.com members can view the charts one at a time.
Happy trading!
Tom