
EB Monthly Seasonality Report - October 2021
A Look Back At September 2021
Below are the 20 stocks that were favored for the month of September and how they performed:
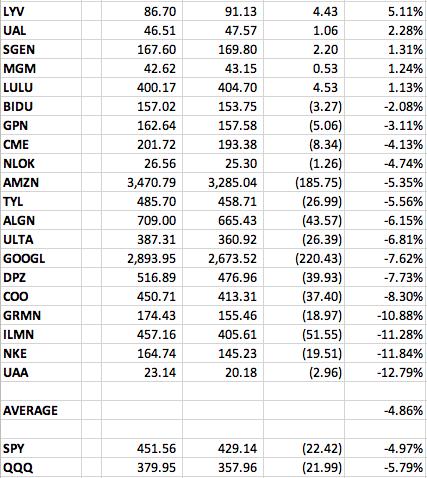
9 of the 20 stocks provided outperformed the S&P 500's return of -4.97% during August. The average return of -4.86% was roughly the same as the S&P 500 return.
The best performer from our September group was Live Nation Entertainment (LYV), which managed to gain more than 5%, despite the overall market's headwinds. The best news of all, however, was its performance on October 1st, where LYV broke out above rectangular consolidation resistance on increasing volume:
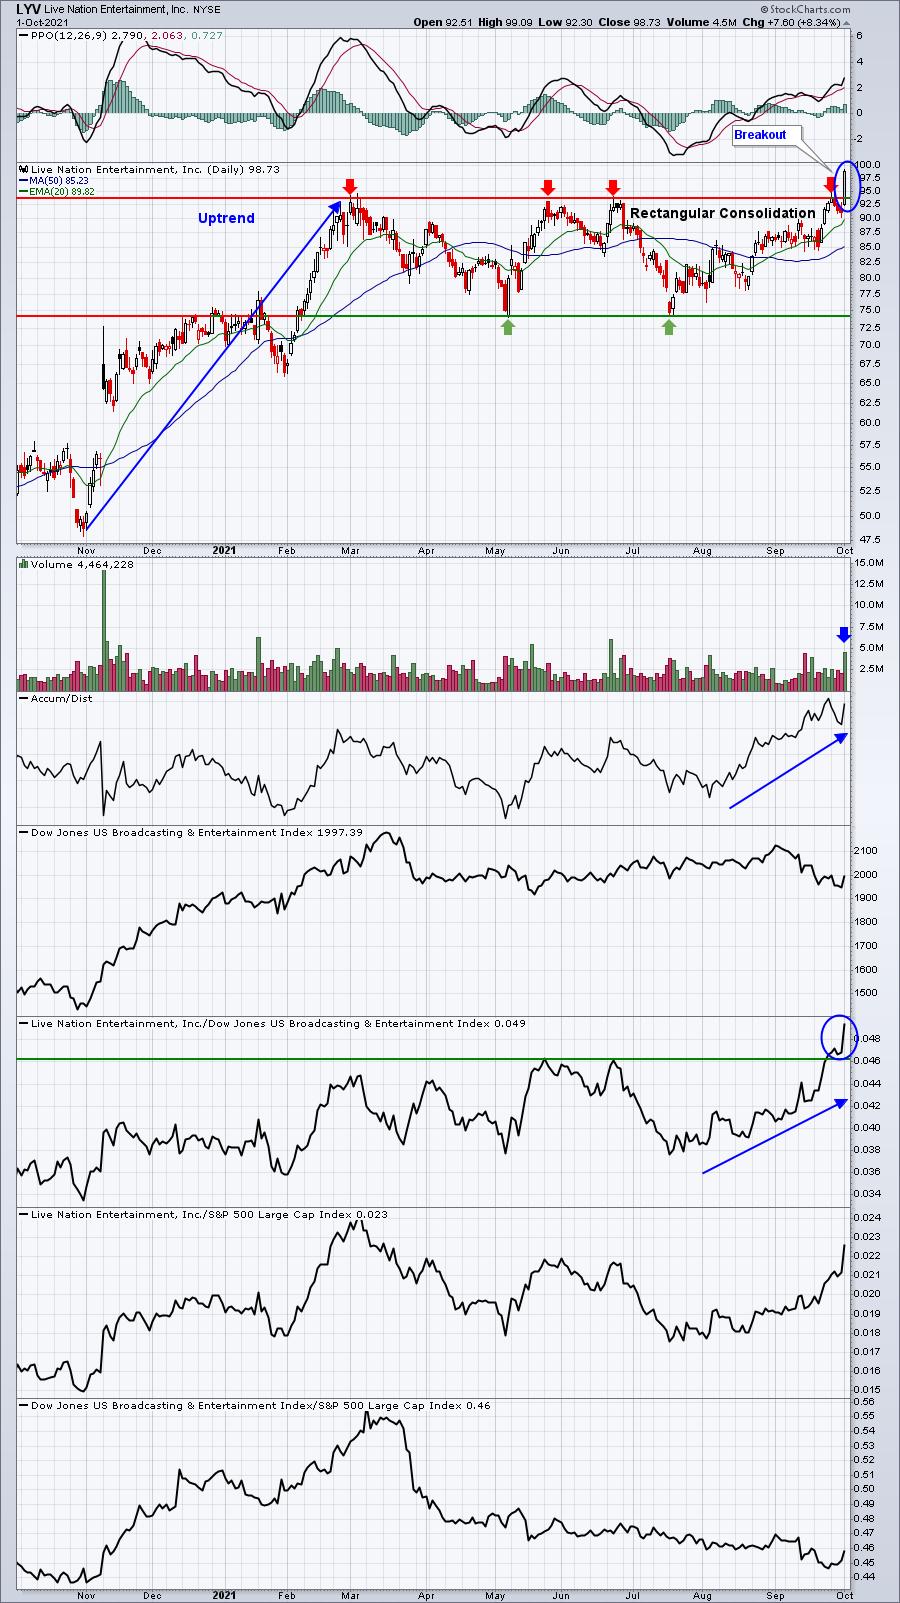
LYV is a great-looking chart and its recent strength, both absolute and relative, comes despite relative weakness in broadcasting & entertainment stocks ($DJUSBC). PPO is showing excellent bullish momentum as well. Any 20-day EMA test would be a solid reward to risk entry.
A Look Ahead At October 2021
S&P 500 Performance
Here's a breakdown of the annualized performance of the S&P 500 (since 1950) during the month of October:
October 1-6: +35.16%
October 7-10: -19.18%
October 11-18: +17.49%
October 19-27: -27.95%
October 28-30: +66.74%
October has a bad reputation, because of 1987 and 1929, but it's actually not a bad month outside of that October 19th to October 27th period. We definitely need to be aware of the bearish tendencies that period, but otherwise October is generally a bullish month.
Sector Performance
Before we look at individual stocks, let's get an overview of how the various sectors and industries have performed during October (and November) over the past decade (during this secular bull market):
Sector Heat Map:
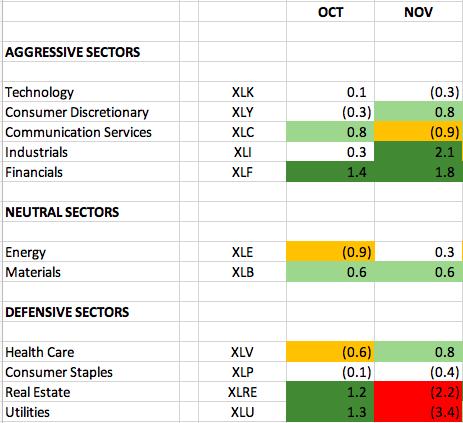
The numbers reflect how much a sector, on average, outperforms or underperforms the S&P 500 over the past 10 years. The dark green-shaded areas show significant outperformance (1.0 or greater). The light green-shaded areas show solid outperformance (from 0.5 to 1.0). The yellow-shaded areas show underperformance (-0.5 to -1.0). The red-shaded areas show significant underperformance (-1.0 or greater). Where there is no shading, there tends to be more neutral performance (-0.4 to 0.4).
While October is strong historically, relative strength resides in sectors you might not expect. Financials (XLF) have been solid outperformers during October (and November) throughout this secular bull market, so I'd look for more of that, especially if the 10-year treasury yield ($TNX) continues to rise. Among defensive sectors, October relative strength resides in both utilities (XLU) and real estate (XLRE). History provides us just that, not a guarantee of future results. If you recall, I pointed out last month that the XLU was beginning its best two-month period of the year (September-October). After a decent start to the month, it promptly lost ground 14 consecutive days from September 9th through September 28th. The rising TNX likely had something to do with that, but again, seasonality isn't the "holy grail". It's simply one more piece of information that we can use to make informed trading decisions.
Industry Performance
Let's take a look at the industry heat map within financials to drill down to the best seasonal strength among the various industry groups:
Financials:
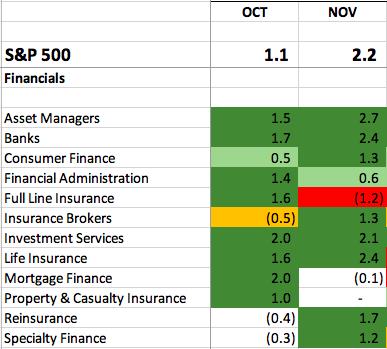
Two interesting charts among these industry groups are asset managers ($DJUSAG) and banks ($DJUSBK), depending on whether you're interested in a recent pullback near support (AG) or more recent strength nearing a breakout (BK):
DJUSAG:
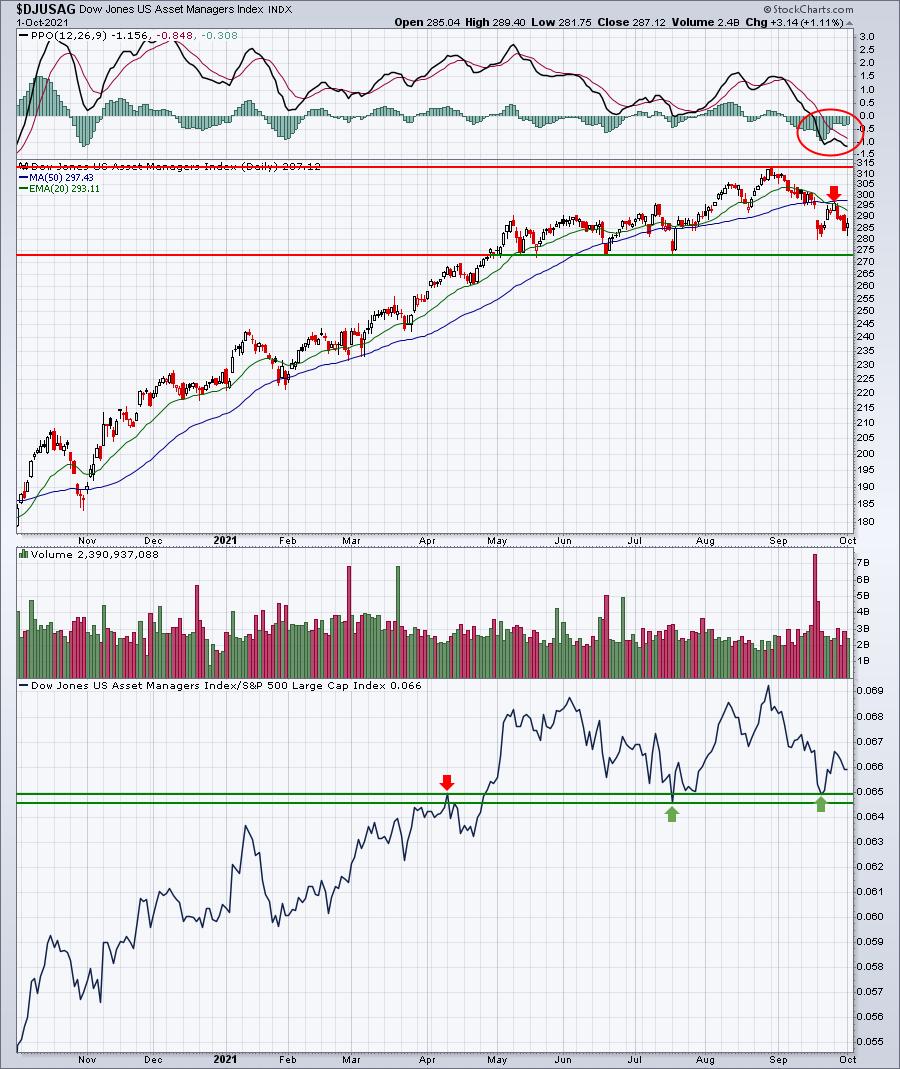
The current trading range on the DJUSAG is roughly 273-313, so the closer it gets to 273, the better the opportunities in this industry. I'd watch absolute and price support closely, however, and avoid the group if support fails to hold. History would point to the likelihood that it will hold.
DJUSBK:
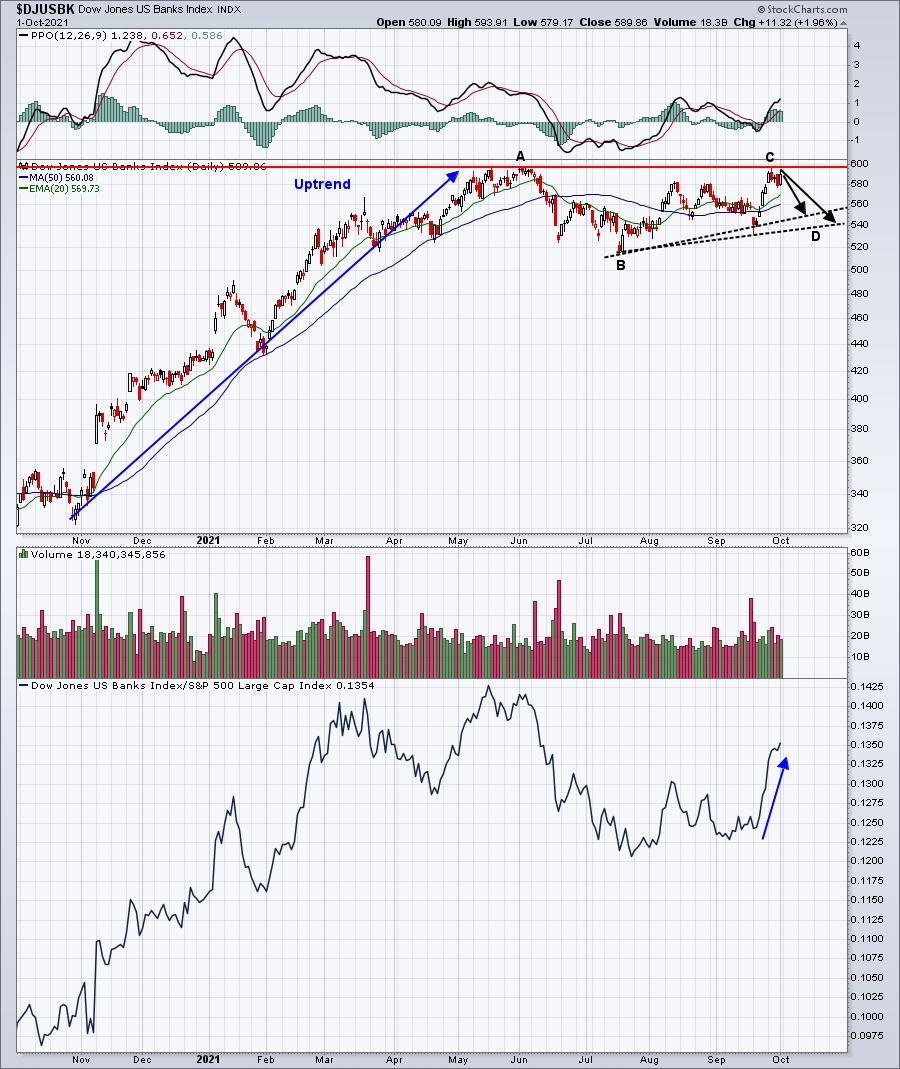
Banks clearly are the stronger of the two industries, but overhead price resistance must still be negotiated. We could see a breakout, which obviously would be bullish, or we could see a bullish continuation pattern evolve. If the TNX were to fall back near-term, we could see banks temporarily lose their luster and potentially drop to establish a Point D in an A-B-C-D-E ascending triangle pattern. Traders tend to grow extremely impatient while consolidation takes place. The DJUSBK chart is bullish, but a breakout doesn't have to occur immediately.
Here are industry groups that tend to perform much better than the benchmark S&P 500 during October:
Technology (XLK):
- renewable energy, electrical components & equipment, computer hardware, software
Consumer Discretionary (XLY):
- automobiles, hotels, auto parts, business training & employment agencies, furnishings, gambling, recreational products, home construction, travel & tourism
Communication Services (XLC):
- media agencies, internet
Industrials (XLI):
- airlines, commercial vehicles & trucks, industrial machinery, heavy construction, building materials & fixtures
Health care (XLV):
- health care providers
Consumer staples (XLP):
- tobacco, tires
Real estate (XLRE):
- real estate services
Utilities (XLU):
- multiutilities, water, conventional electricity, gas distribution
Energy (XLE):
- none
Materials (XLB):
- steel, nonferrous metals, paper
Stocks for October
We've selected our Top 20 seasonal stocks for October from the S&P 500 and NASDAQ 100. Several names represent sectors and industry groups that have been discussed above. Others simply stand out in October based on their own track record.
The stocks this month are as follows:
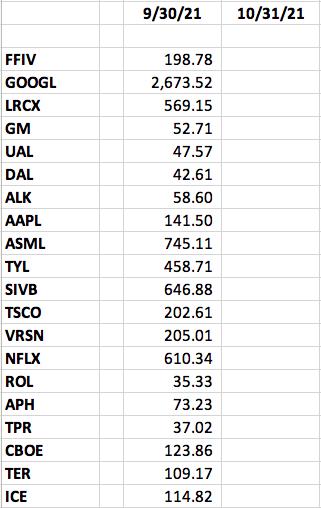
A "Seasonality - October 2021" ChartList has been created and is available for viewing/download. It should be updated on our site over the weekend. You must be a StockCharts.com Extra or Pro member to download our ChartLists. Basic members and non-StockCharts.com members can view the charts one at a time. The charts will be annotated with a key support level (or two) to watch.
Happy trading!
Tom