
EB Monthly Seasonality Report - October 2023
A Look Back At September Stocks:
One month ago, we provided a list of the Top 20 stocks that had strong historical track records during the month of September. Here are how they performed in September 2023, in order of best to worst performance:
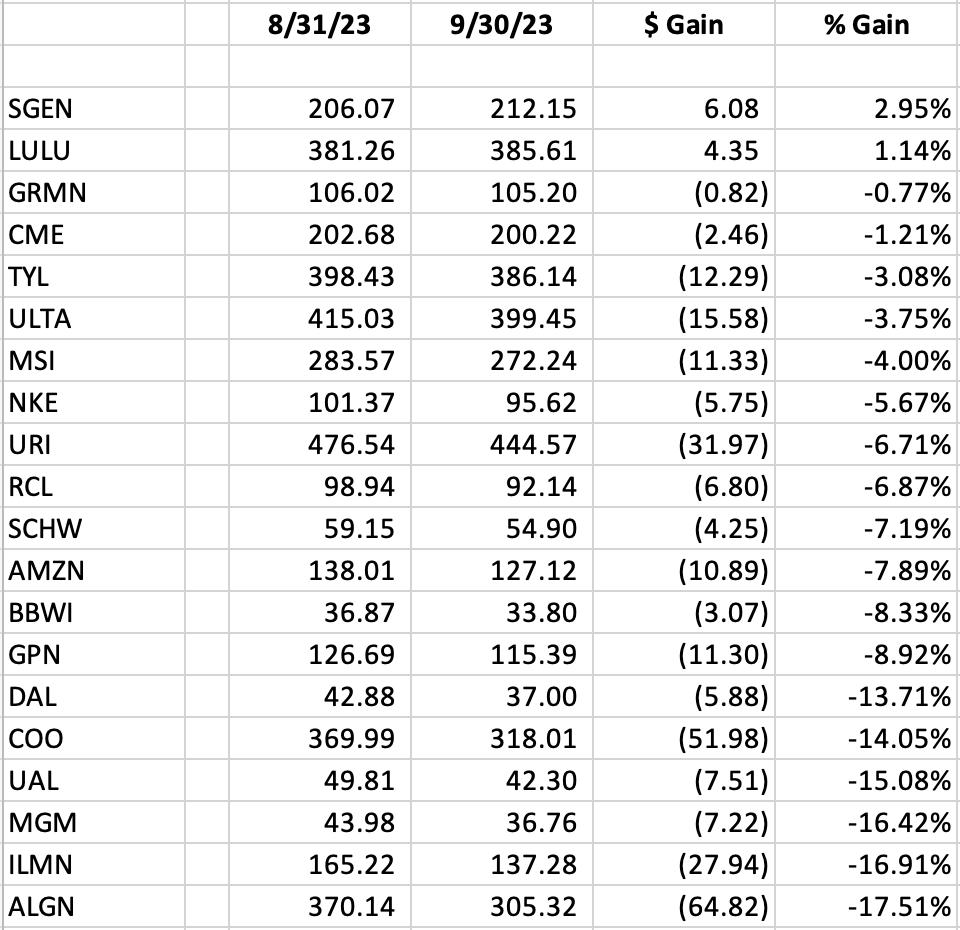
The percentages represent the returns from the August 31st close to the September 30th close. The average performance of all 20 stocks (-7.70%) trailed both the S&P 500 performance (-4.74%) and the NASDAQ performance (-5.08%). Airlines did our Our Top 20 Seasonality stocks no favors as both DAL and UAL fell precipitously throughout the month.
S&P 500 October Performance
Here's a breakdown of the annualized performance of the S&P 500 (since 1950) during the month of August:
- October 1-6: +38.92%
- October 7-9: -33.47%
- October 10-21: +16.00%
- October 22-27: -41.06%
- October 28-31: +69.02%
October has a bad reputation, because of its very poor showing during the 1987 market crash and the 1929 market crash. If we look at this calendar month from a more recent perspective, however, it's actually been a very solid month, trailing only July, November, and April since 2004. October, in the aggregate, has gained ground 44 of 73 Octobers since 1950, which ranks 6th among all calendar months. October's annualized return since 1950 is +11.51% and that ranks it 7th among all calendar months.
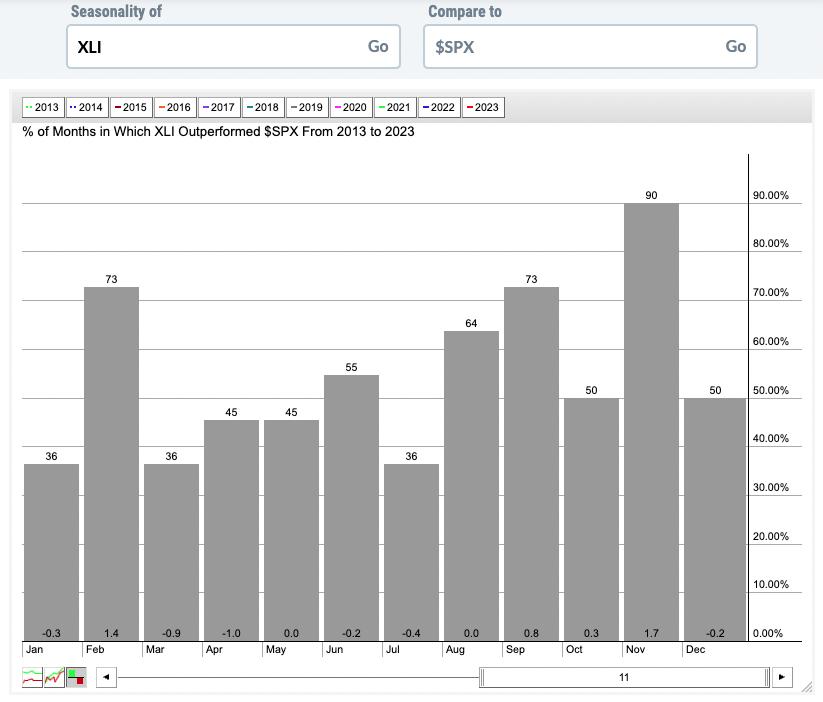
During the secular bull market, which began back in 2013, industrials (XLI) and financials (XLF) have been extraordinarily bullish on a relative basis in both October and November. Let's check out these two seasonality charts:
XLI:
XLF:
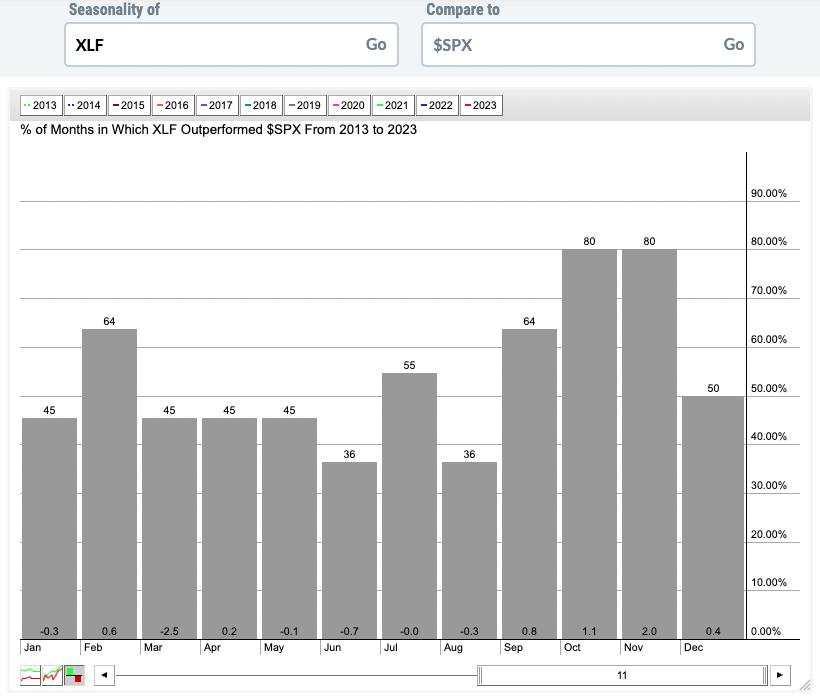
Clearly, November is the stronger relative month, but October has been a nice "leadoff hitter".
Sector Performance
Before we look at individual stocks, let's get an overview of how the various sectors and industries have performed during October (and November) over the past decade (during this secular bull market):
Sector Heat Map:
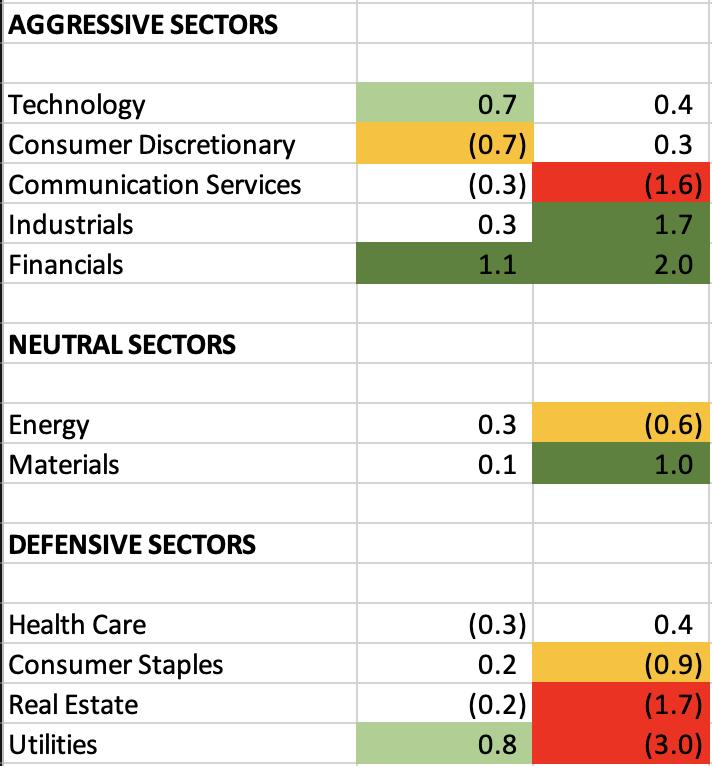
The numbers reflect how much a sector, on average, outperforms or underperforms the S&P 500 over the past 10 years. The dark green-shaded areas show significant outperformance (1.0 or greater). The light green-shaded areas show solid outperformance (from 0.5 to 1.0). The yellow-shaded areas show underperformance (-0.5 to -1.0). The red-shaded areas show significant underperformance (-1.0 or greater). Where there is no shading, there tends to be more neutral performance (-0.4 to 0.4).
Leadership in October has typically come from financials (XLF). Here's what the XLF looks like as we enter October this year:
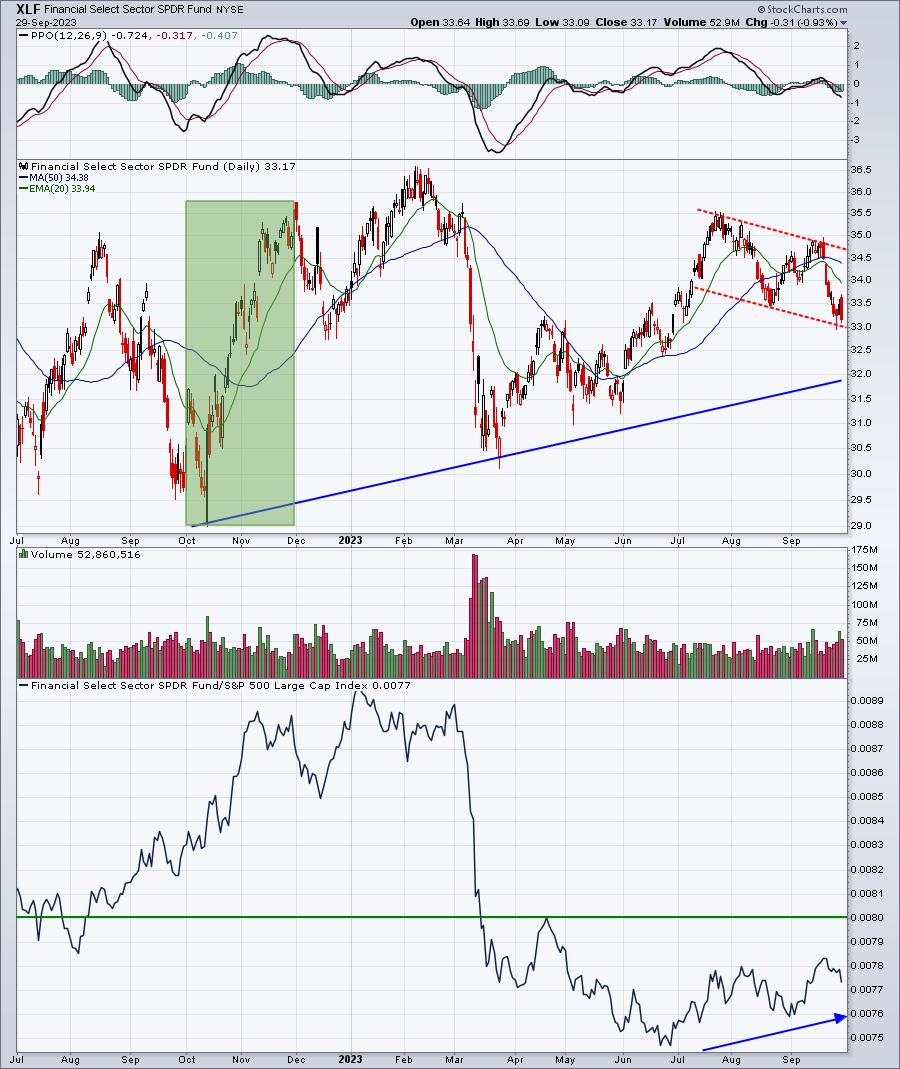
If you recall, the XLF was not looking very pretty as September 2022 came to an end. But you can see in the green-shaded area how the XLF performed in October and November. Also notice that the XLF was downtrending in August and September 2022, but its RELATIVE strength was actually strengthening. Check out what's happening this year. I once again see miserable absolute performance, but the RELATIVE performance in September has been strong. Are we setting up for another strong two-month advance in the XLF? Time will tell. In the meantime, what happens to the short-term downtrend? Do we break out, likely leading us back to the February price high? Or do we see a breakdown, which would most likely lead to an intermediate-term uptrend line test near 32?
Industry Performance
Let's take a look at the industry heat map within financials to drill down to the best seasonal strength in October and November over the past decade among the various industry groups (relative to the S&P 500):
Financials (XLF):
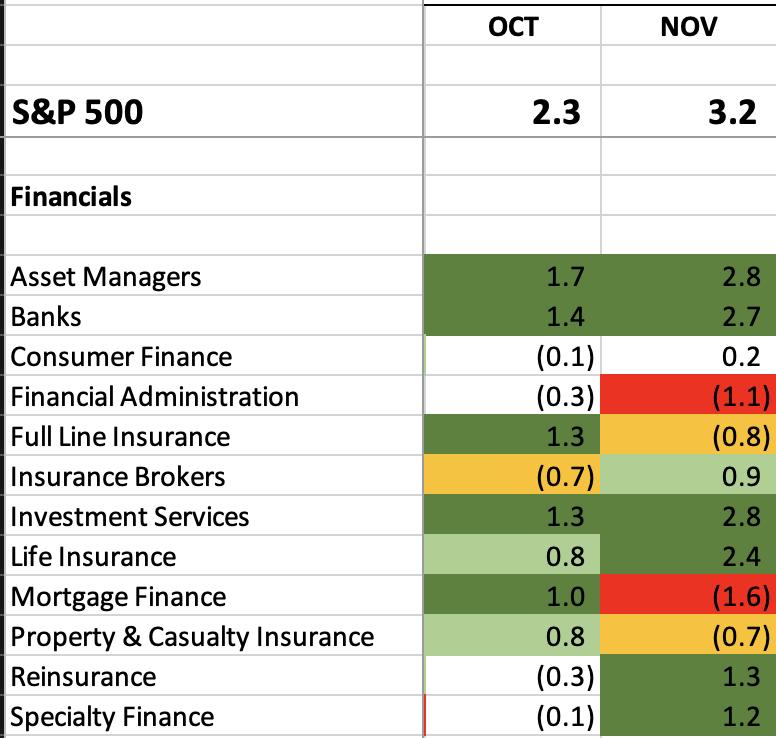
The October historical strength in financials has been led by three key industry groups, asset managers ($DJUSAG), banks ($DJUSBK), and investment services ($DJUSSB). On the long-term chart, the DJUSAG looks quite bullish right now:
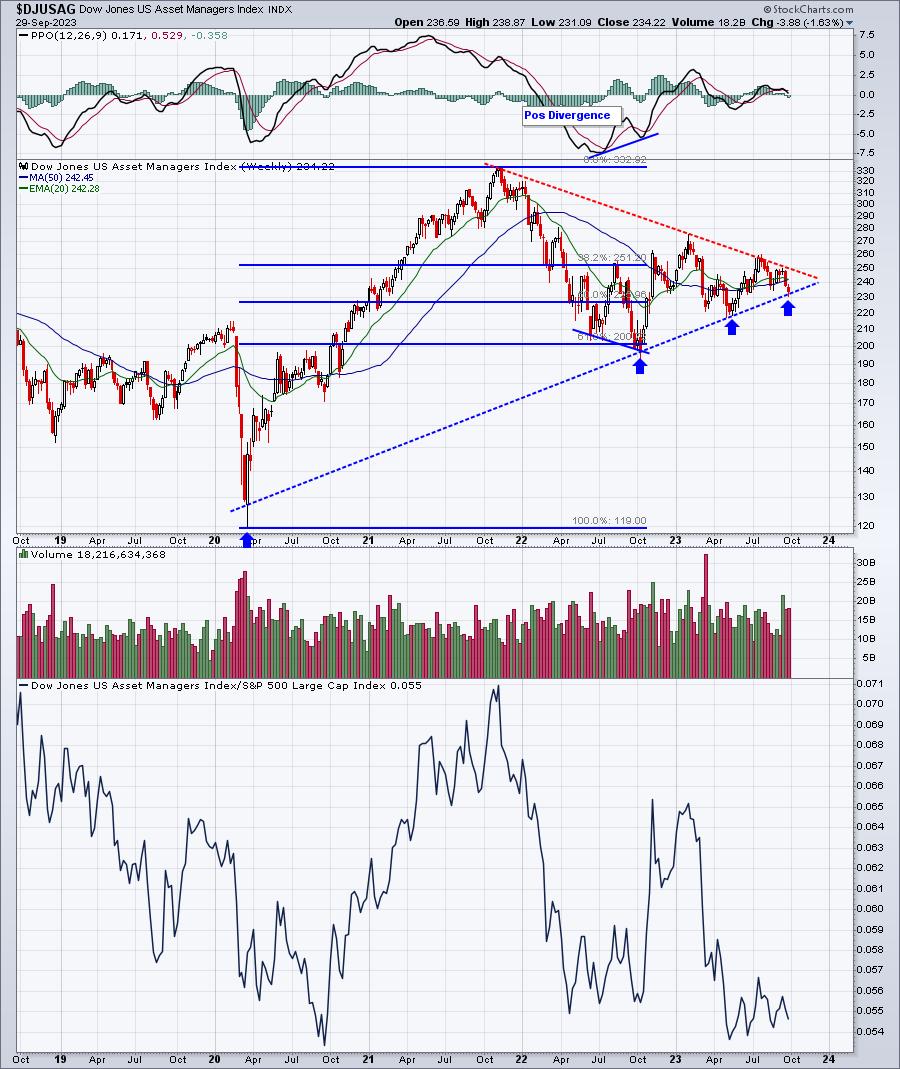
The October 2022 low was almost a perfect test of the 61.8% Fibonacci retracement line and it occurred simultaneously with a positive divergence. We now appear to be squeezing in a symmetrical triangle and it's very likely that this triangle breaks in Q4. Since it takes place AFTER a prior uptrend, the normal result is a breakout to the upside, so that's what I'd expect.
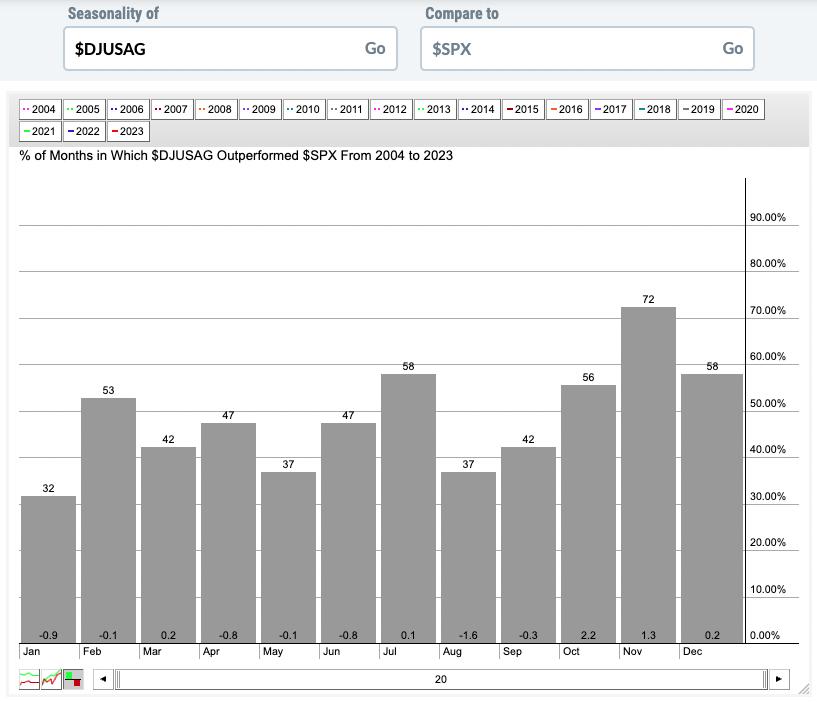
Over the past two decades, the DJUSAG has really only shown two months of relative strength - October and November - which is quite apparent from this seasonality chart:
Here are industry groups (within sectors other than financials) that tend to perform much better than the benchmark S&P 500 during October:
Technology (XLK):
- renewable energy, computer hardware, software
Consumer Discretionary (XLY):
- automobiles, auto parts
Communication Services (XLC):
- none
Industrials (XLI):
- airlines, diversified industrials, commercial vehicles & trucks, industrial machinery
Health care (XLV):
- health care providers
Consumer staples (XLP):
- tobacco
Real Estate (XLRE):
- none
Utilities (XLU):
- water
Energy (XLE):
- integrated oil & gas
Materials (XLB):
- steel, nonferrous metals, paper
Stocks for October
We've selected our Top 20 seasonal stocks for October. Several names represent sectors and industry groups that have been discussed above. Others simply stand out in October based on their own historical track record.
The stocks this month are as follows:
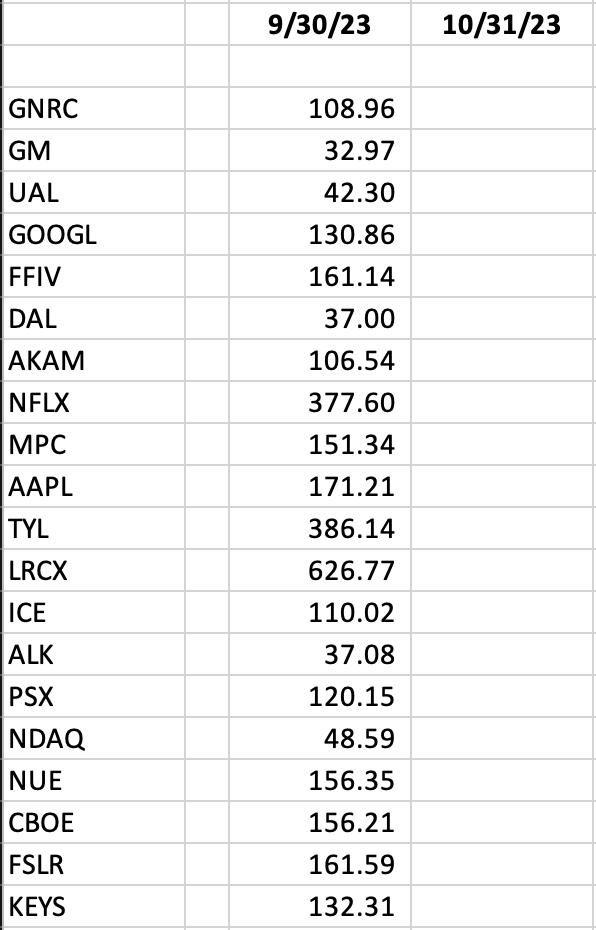
A "Seasonality - October 2023" ChartList (annotated with 1 or 2 support levels to watch) has been created and will be available for viewing/download on our website on Monday. You must be a StockCharts.com Extra or Pro member to download our ChartLists. Basic members and non-StockCharts.com members can view the charts one at a time.
Happy trading!
Tom