
EB Monthly Seasonality Report - October 2025
A Look Back At September Stocks:
Last month, we released our list of the Top 20 stocks that had strong historical track records during the month of September. Here are how they performed in September 2025, in order of best to worst performer:
- DELL: +16.06%
- ULTA: +10.96%
- JBL: +6.02%
- ALL: +5.51%
- DDOG: +4.18%
- CME: +1.87%
- URI: -0.18%
- SCHW: -0.39%
- GILD: -1.06%
- LYV: -1.86%
- LUV: -2.48%
- AXON: -3.97%
- UAL: -8.10%
- DAL: -8.14%
- NKE: -9.41%
- TTD: -10.34%
- RCL: -10.64%
- ALGN: -11.79%
- LULU: -12.00%
- FDS: -23.26%
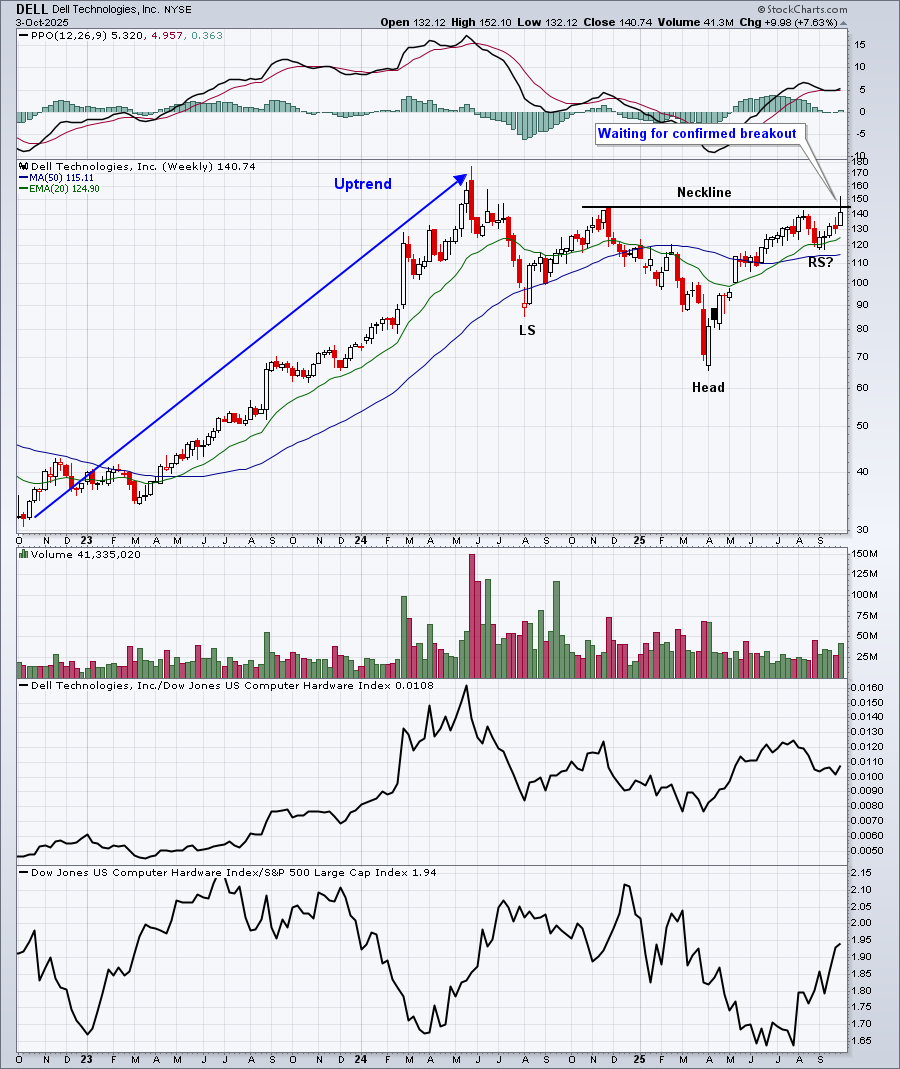
The percentages represent the returns from the August 31st close to the September 30th close. The average performance of all 20 stocks (-2.95%) was very weak relative to our major indices. Collectively, our September group trailed the S&P 500 (+3.56%) and performed even worse relative to the NASDAQ 100 (QQQ, +5.38%). Our biggest September winner was Dell Technologies (DELL), a computer hardware company ($DJUSCR), which actually is trying to bust through a key price resistance/neckline level that could trigger much further gains down the road. Check this out:
It was a rough month, however, for our strong seasonal performers in September.
S&P 500 October Performance
The annualized performance of the S&P 500 (since 1950) during the month of October improves from September - at least historically, before exploding higher in November. Check out this seasonal chart on the S&P 500:
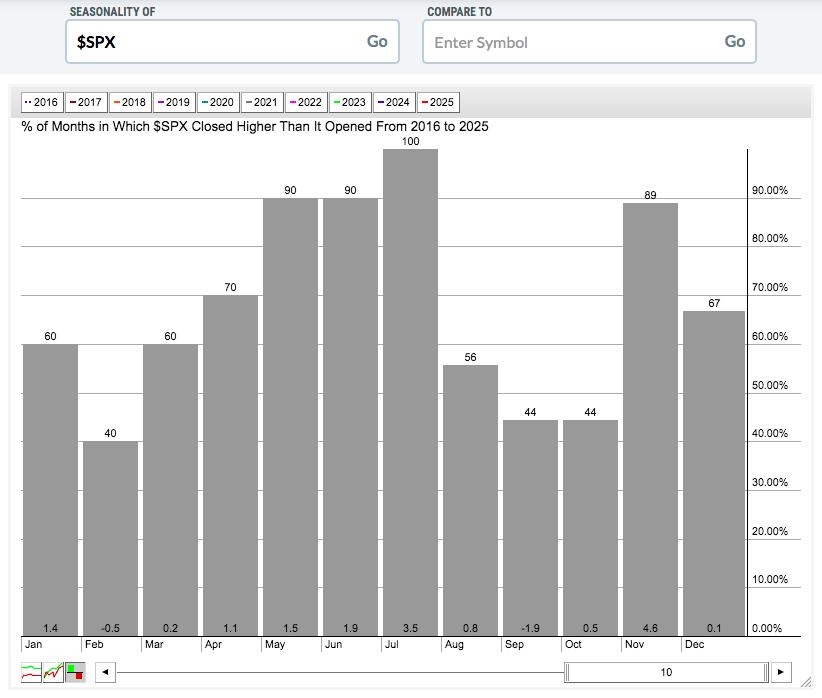
The really good news about October is that the absolute best period to be invested in the S&P 500 is from the close on October 27th through the close on January 18th. This period has closed higher than it began 65 of the last 74 years. That's a very strong historical track record. The annualized return of this period is +21.72%, more than double the average annual return of 9% of the S&P 500 over the same 75-year period.
Since 1950, October has produced an annualized return of +10.70% on the S&P 500, which ranks 7th among all calendar months. Here's a breakdown of the historically strong and weak performance periods throughout October on the S&P 500:
- October 1-6: +38.07%
- October 7-9: -30.42%
- October 10-18: +18.88%
- October 19-21: +3.16%
- October 22-27: -42.54%
- October 28-30: +67.15%
September turned out to be an anomaly where we saw mostly bullish action during a historically-bearish month. Clearly, anything goes. History does turn more bullish, though, in October and that seasonal strength only accelerates as we move into the very bullish month of November.
Sector Performance
Financials (XLF) love Q4. The seasonality chart below highlights the performance of the XLF over the past 12 years (since the start of the current secular bull market):
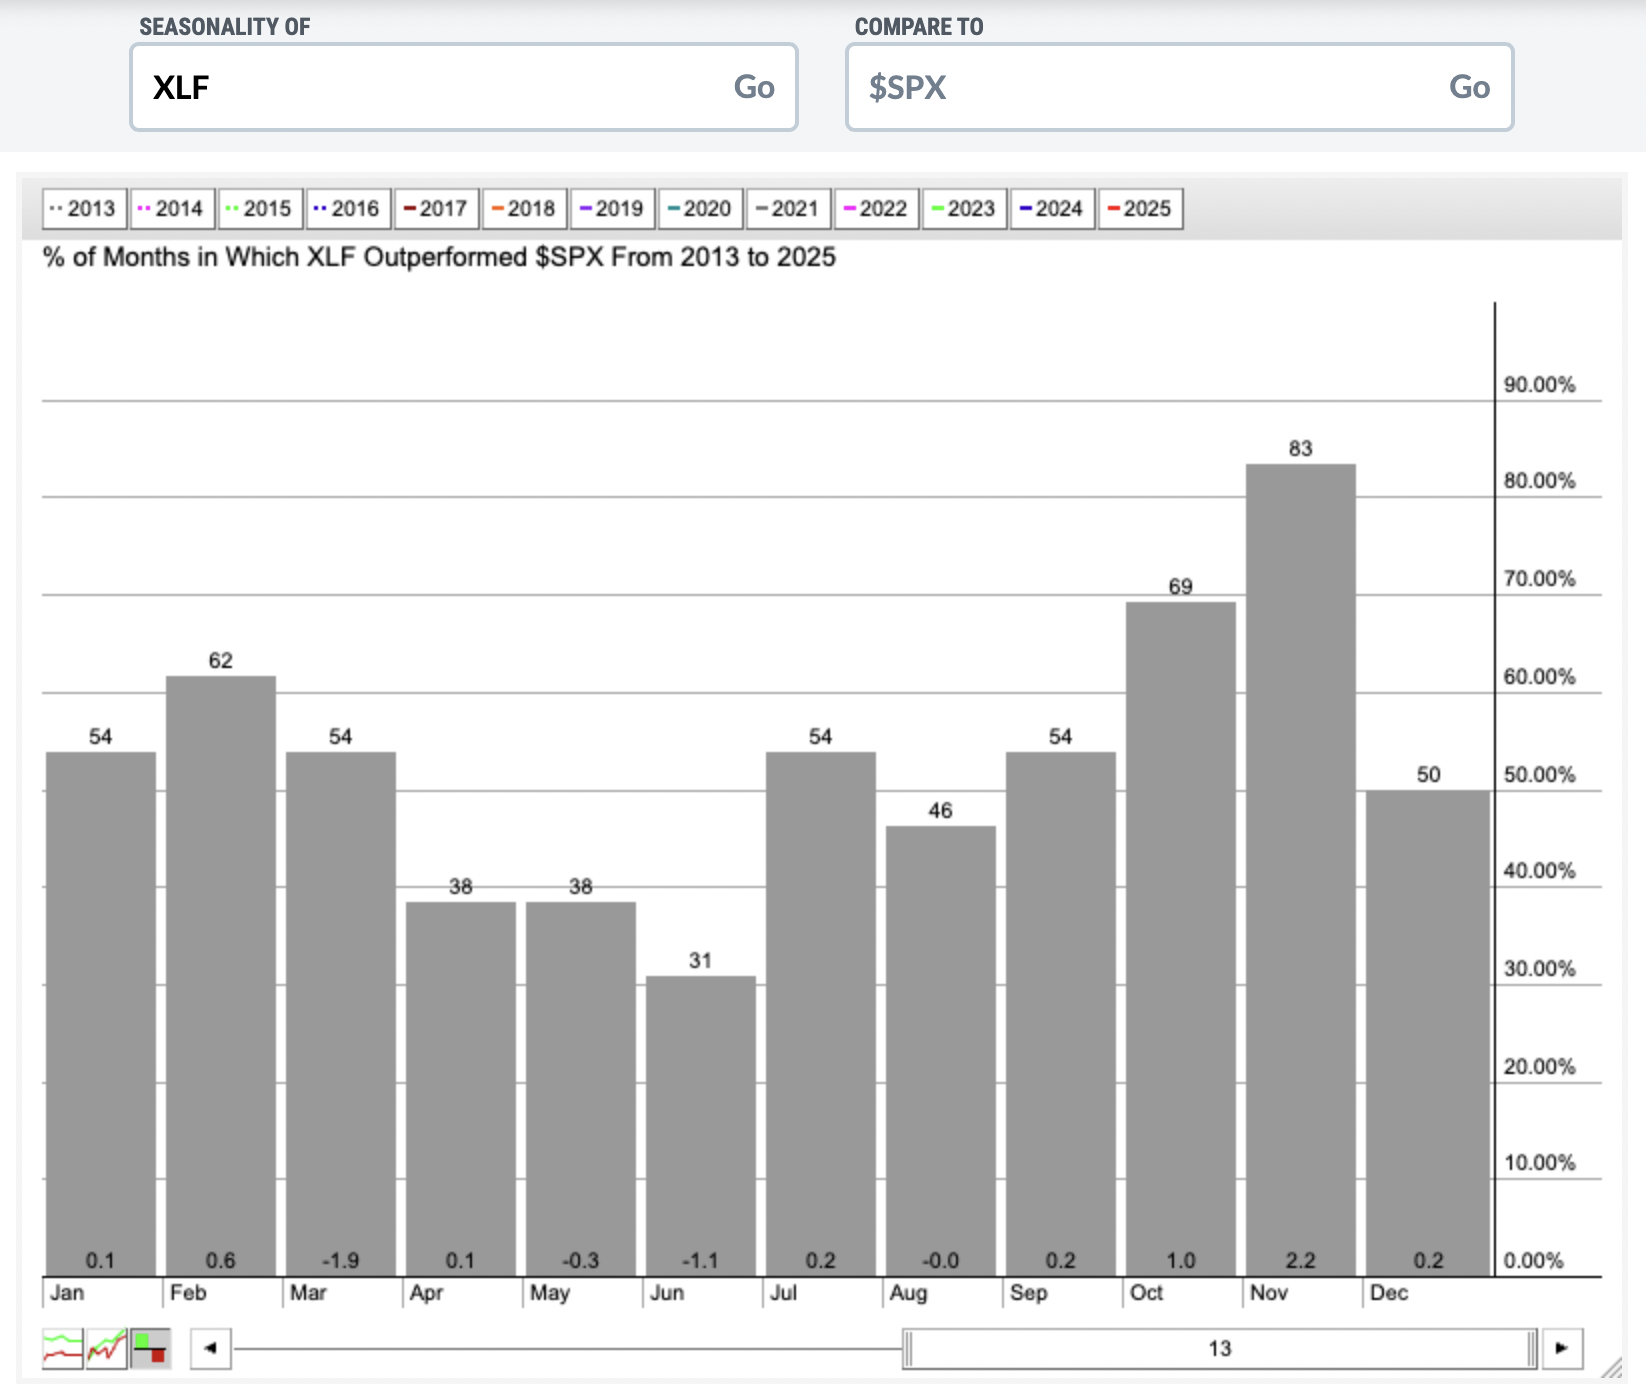
If you add up the average relative returns of each calendar month by calendar quarter, you'll get the following average quarterly returns on the XLF since 2013:
- Q1: +0.7%
- Q2: +2.6%
- Q3: +2.6%
- Q4: +8.9%
Technically, the XLF remains in a solid uptrend, so I look at it very bullishly, considering that historical tailwinds now support the group as well:
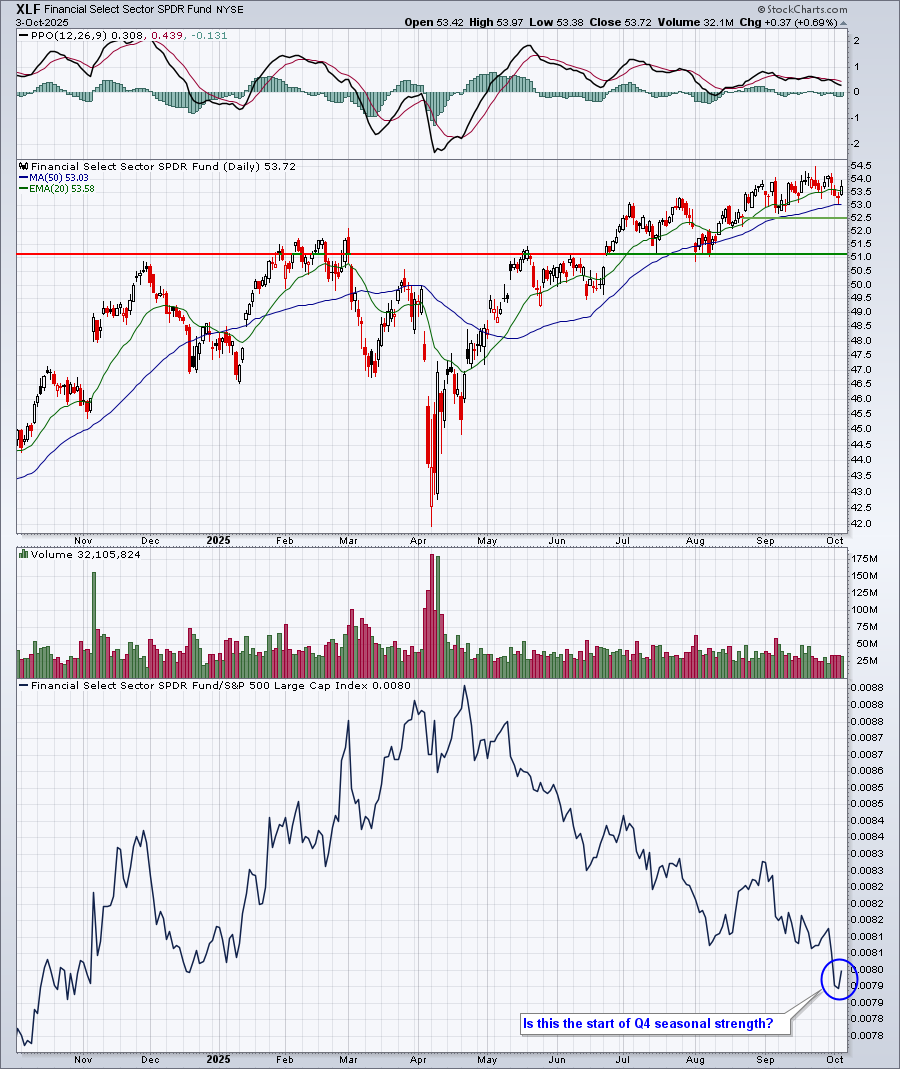
The XLF relative strength line in the bottom panel has been dropping for months, but keep two things in mind. First, the XLF doesn't have a history of outperforming throughout the year. Rather, it sees its strongest historical period during Q4, which just started. Second, the XLF encompasses a number of industry groups. The true Q4 strength results from a few key industries, which are spelled out in the next section.
Industry Performance
There are a number of industry groups within financials that love the month of October, but banks ($DJUSBK) and asset managers ($DJUSAG) lead the pack. While they both show similar bullish historical track records in October and Q4, I think the slight edge goes to banks based on their current technical outlook. Check out both groups on an absolute and relative basis:
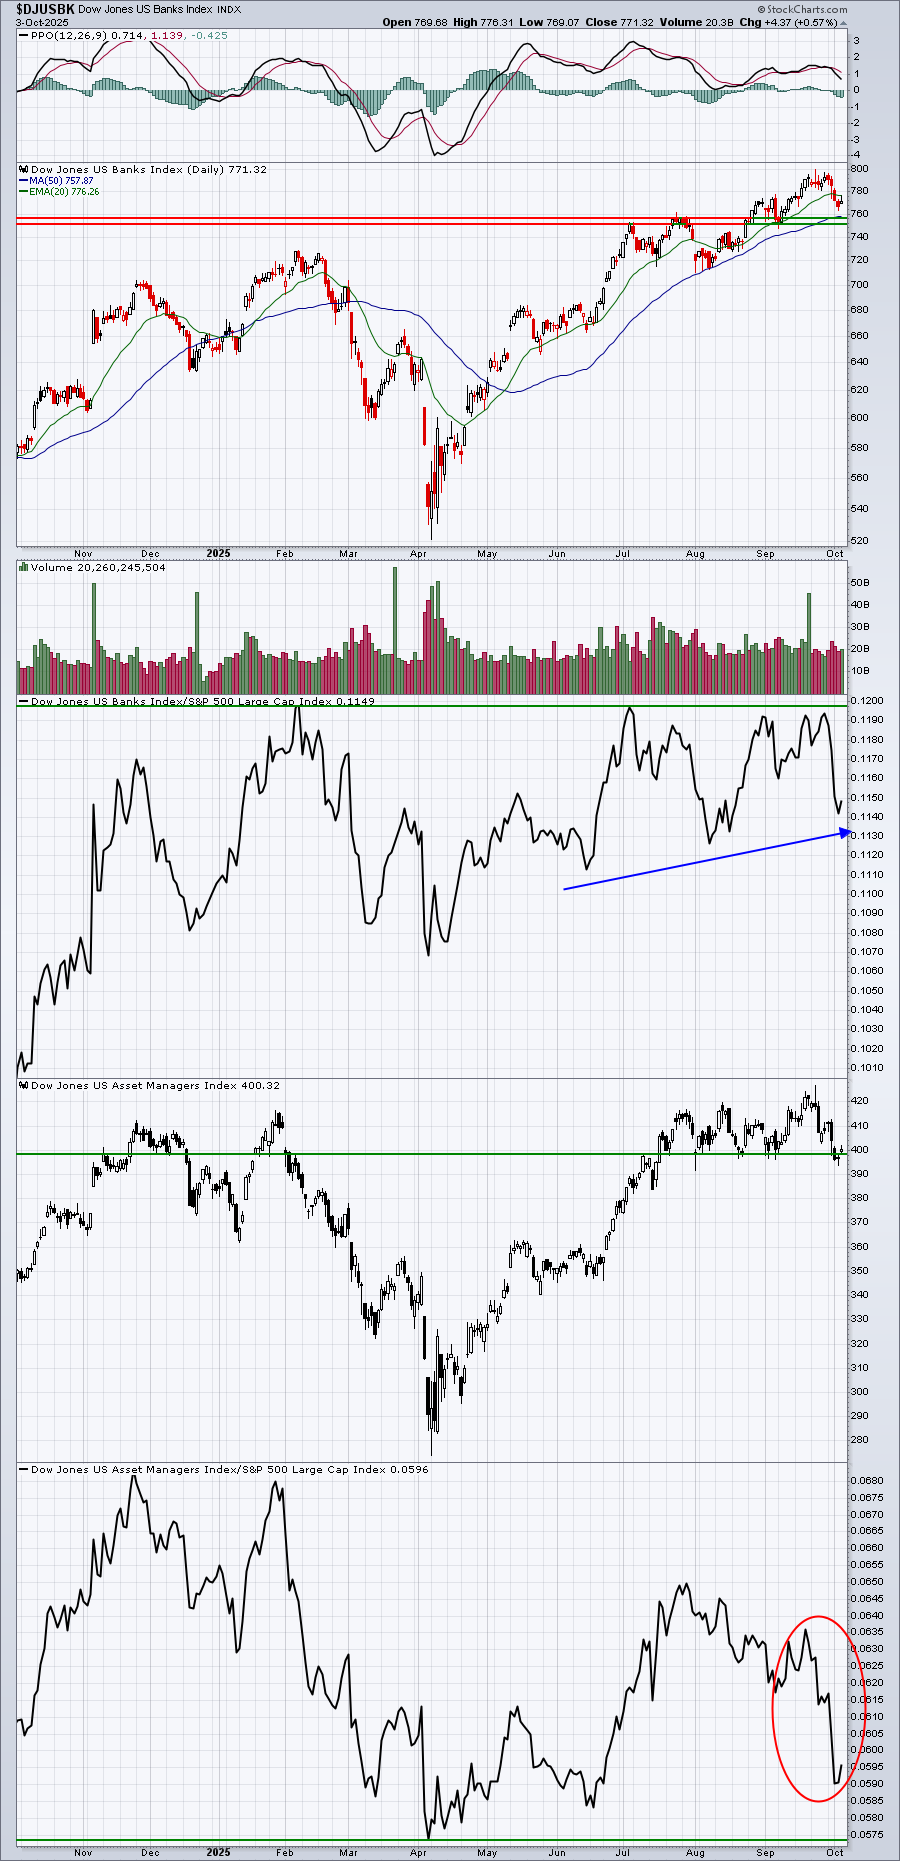
The banks appear to be in a healthier uptrend and their relative chart vs. the S&P 500 has been printing higher lows and equal highs. Asset managers, on the other hand, have been underperforming the S&P 500 recently by a country mile and there was a slight breakdown on the group's absolute chart as well.
Here are all industry groups that tend to perform much better than the benchmark S&P 500 during September, broken down by sector:
Technology (XLK):
- computer hardware, software, renewable energy
Consumer Discretionary (XLY):
- hotels, tires
Communication Services (XLC):
- none
Industrials (XLI):
- airlines, diversified industrials
Financials (XLF):
- banks, asset managers, investment services, property & casualty insurance
Health care (XLV):
- health care providers
Consumer staples (XLP):
- tobacco
Real estate (XLRE):
- none
Utilities (XLU):
- conventional electricity, water
Energy (XLE):
- exploration & production, integrated oil & gas
Materials (XLB):
- steel, paper, nonferrous metals
Stocks for October
A "Seasonality - October 2025" ChartList (annotated with 1 or 2 support levels to watch) has been created and will be added to our website this weekend.
You must be a StockCharts.com Extra or Pro member to download our ChartLists. Basic members and non-StockCharts.com members can view the charts one at a time.
Happy trading!
Tom