
EB Weekly Market Report - Monday, October 5, 2026
ChartLists/Spreadsheets
The following ChartLists have been updated as of the Wednesday, September 30 close, and have been posted to our website:
- Strong Earnings (SECL)
- Strong Future Earnings (SFECL)
- Raised Guidance (RGCL)
- Bullish Trifecta (BTCL)
- Short Squeeze (SSCL)
- Leading Stocks (LSCL)
- Matt's Hot Stocks (HTCL)
- October Seasonality (SEASCL)
The Key Manipulation spreadsheet has been updated through Friday, October 2, 2026. You can view and/or download this spreadsheet from our website.
Upcoming Earnings ChartLists will be provided again starting next week.
Weekly Market Recap
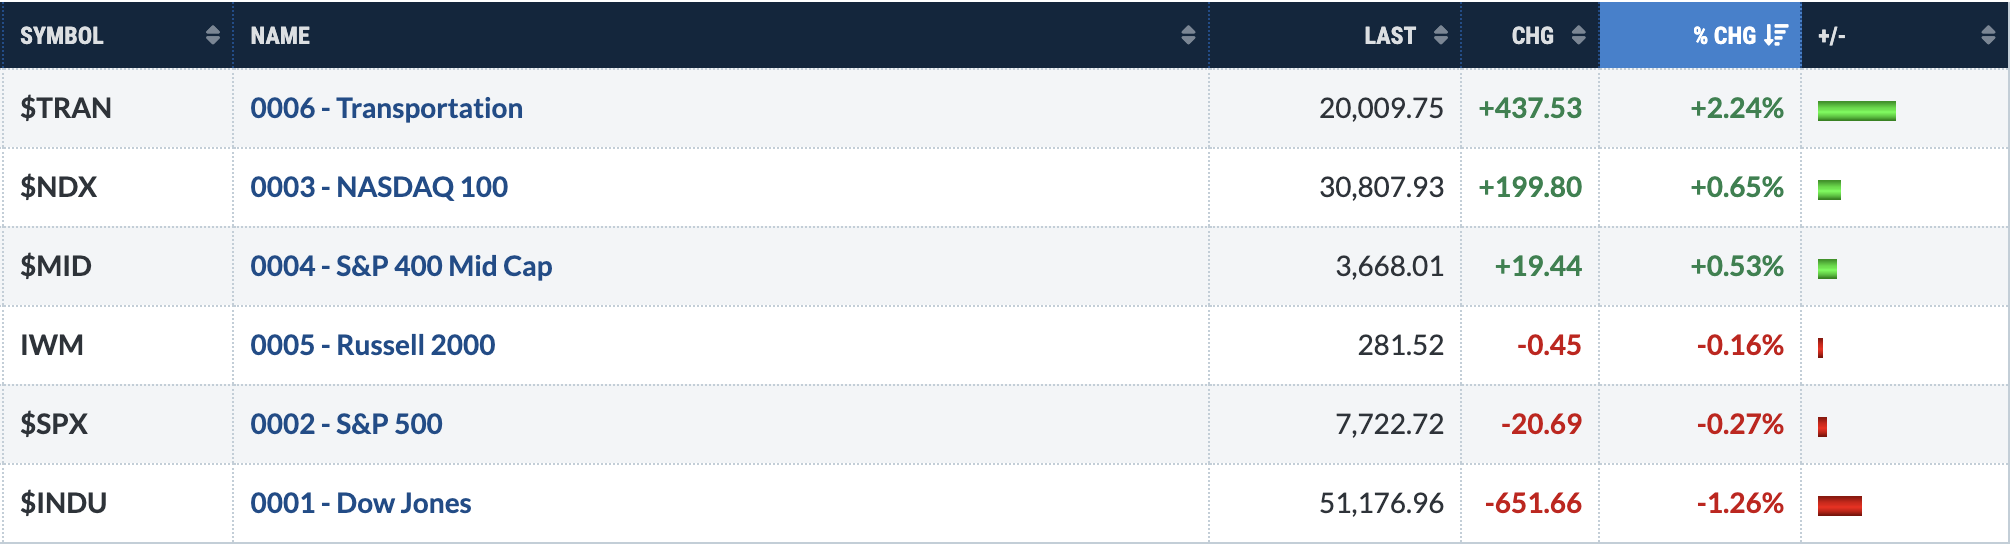
Major Indices
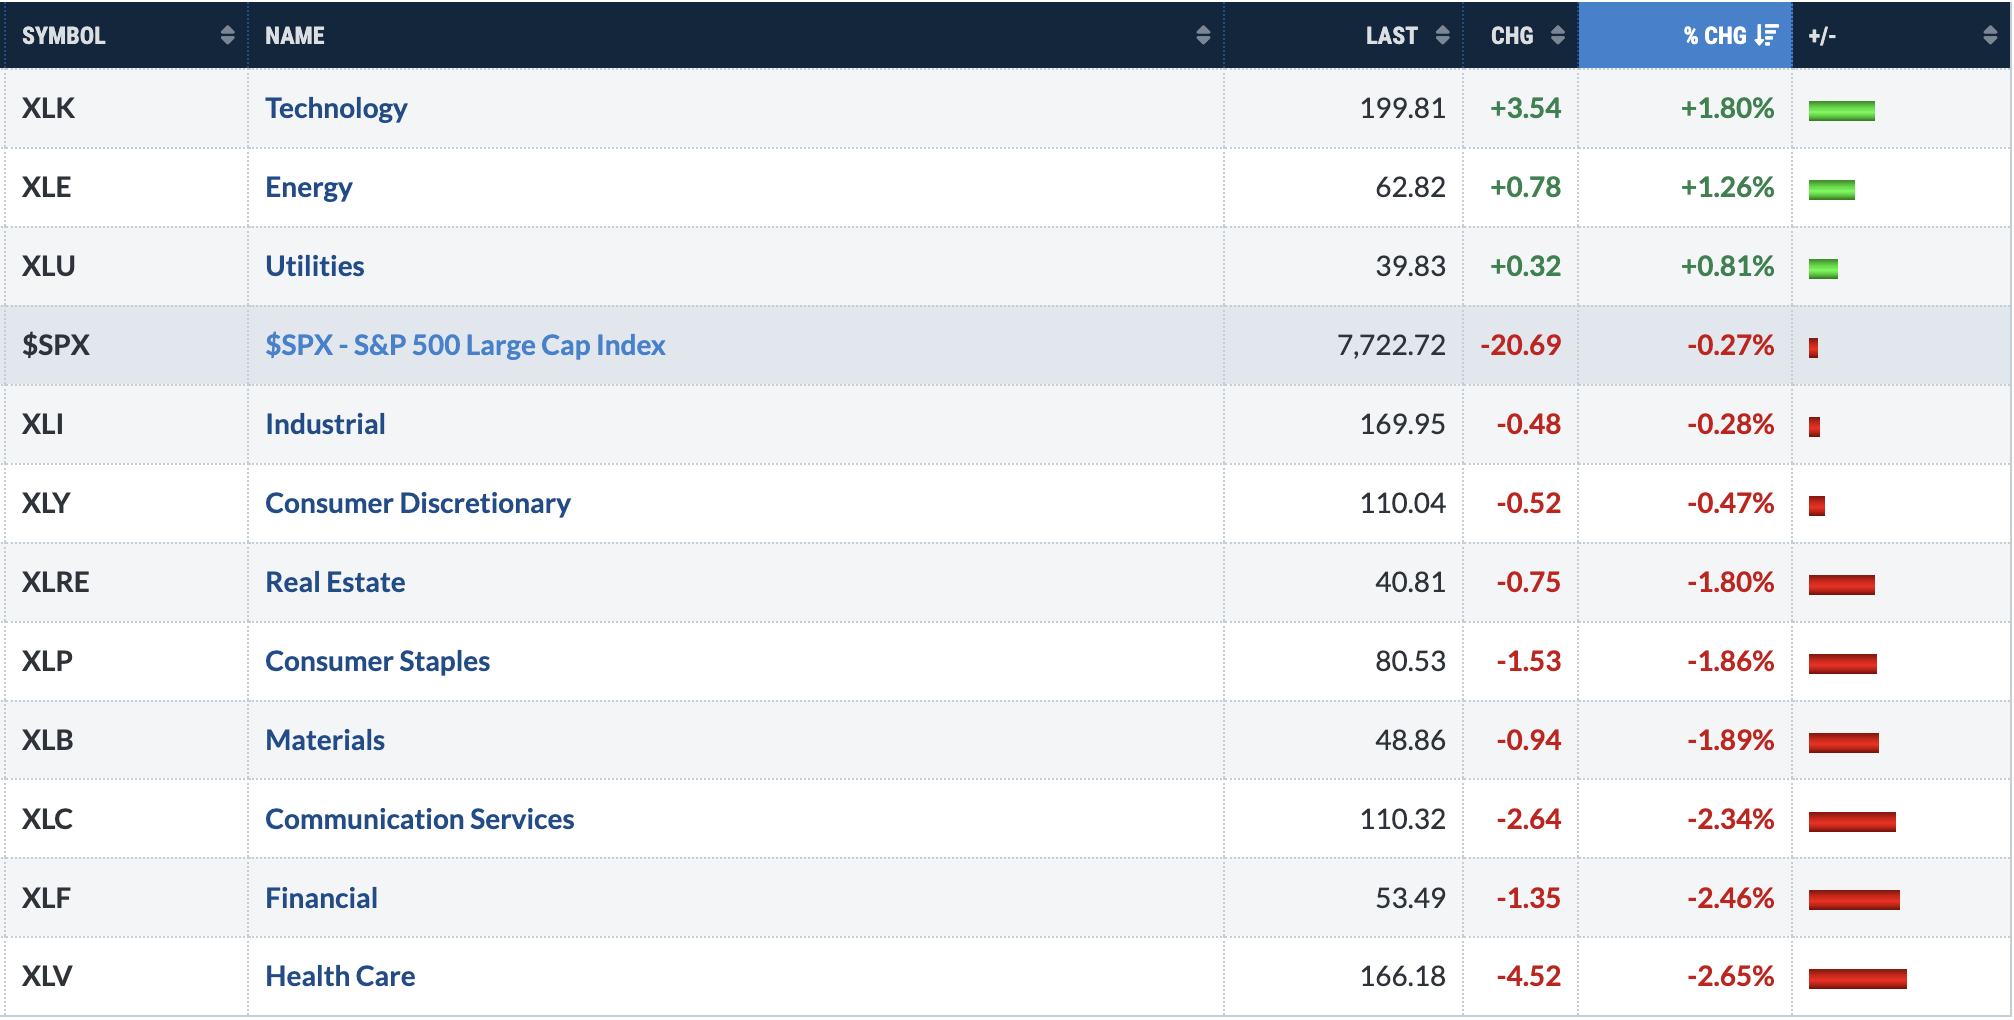
Sectors
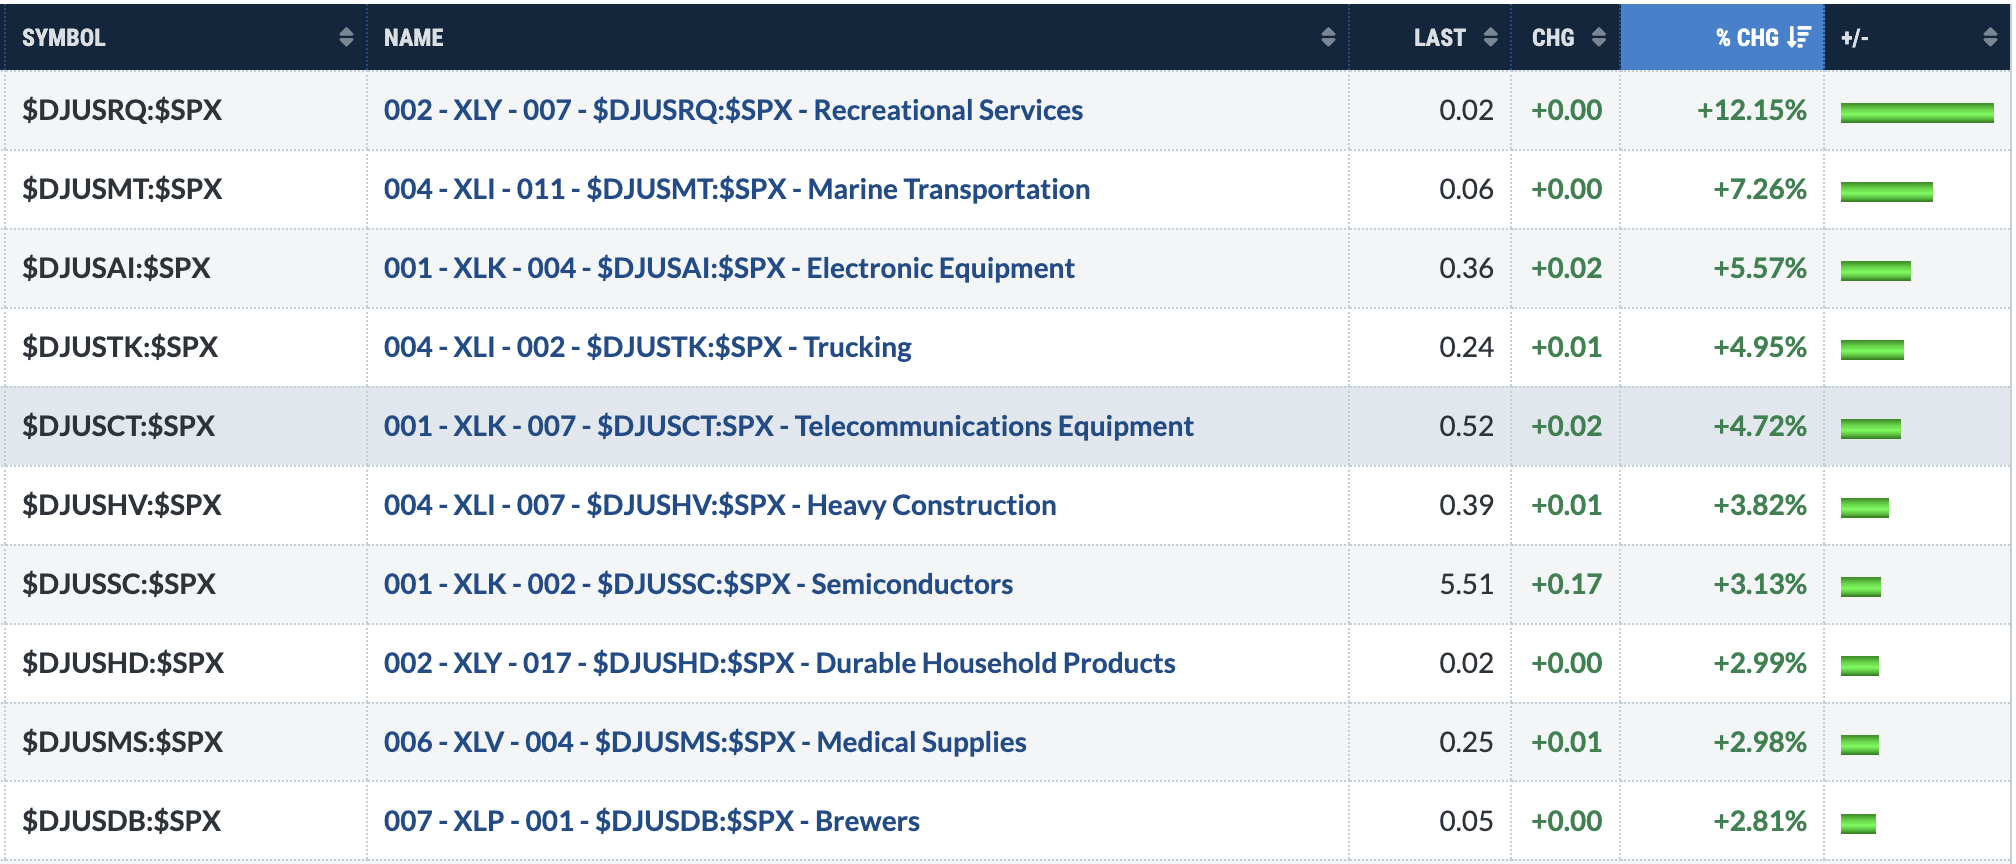
Top 10 Industries Last Week
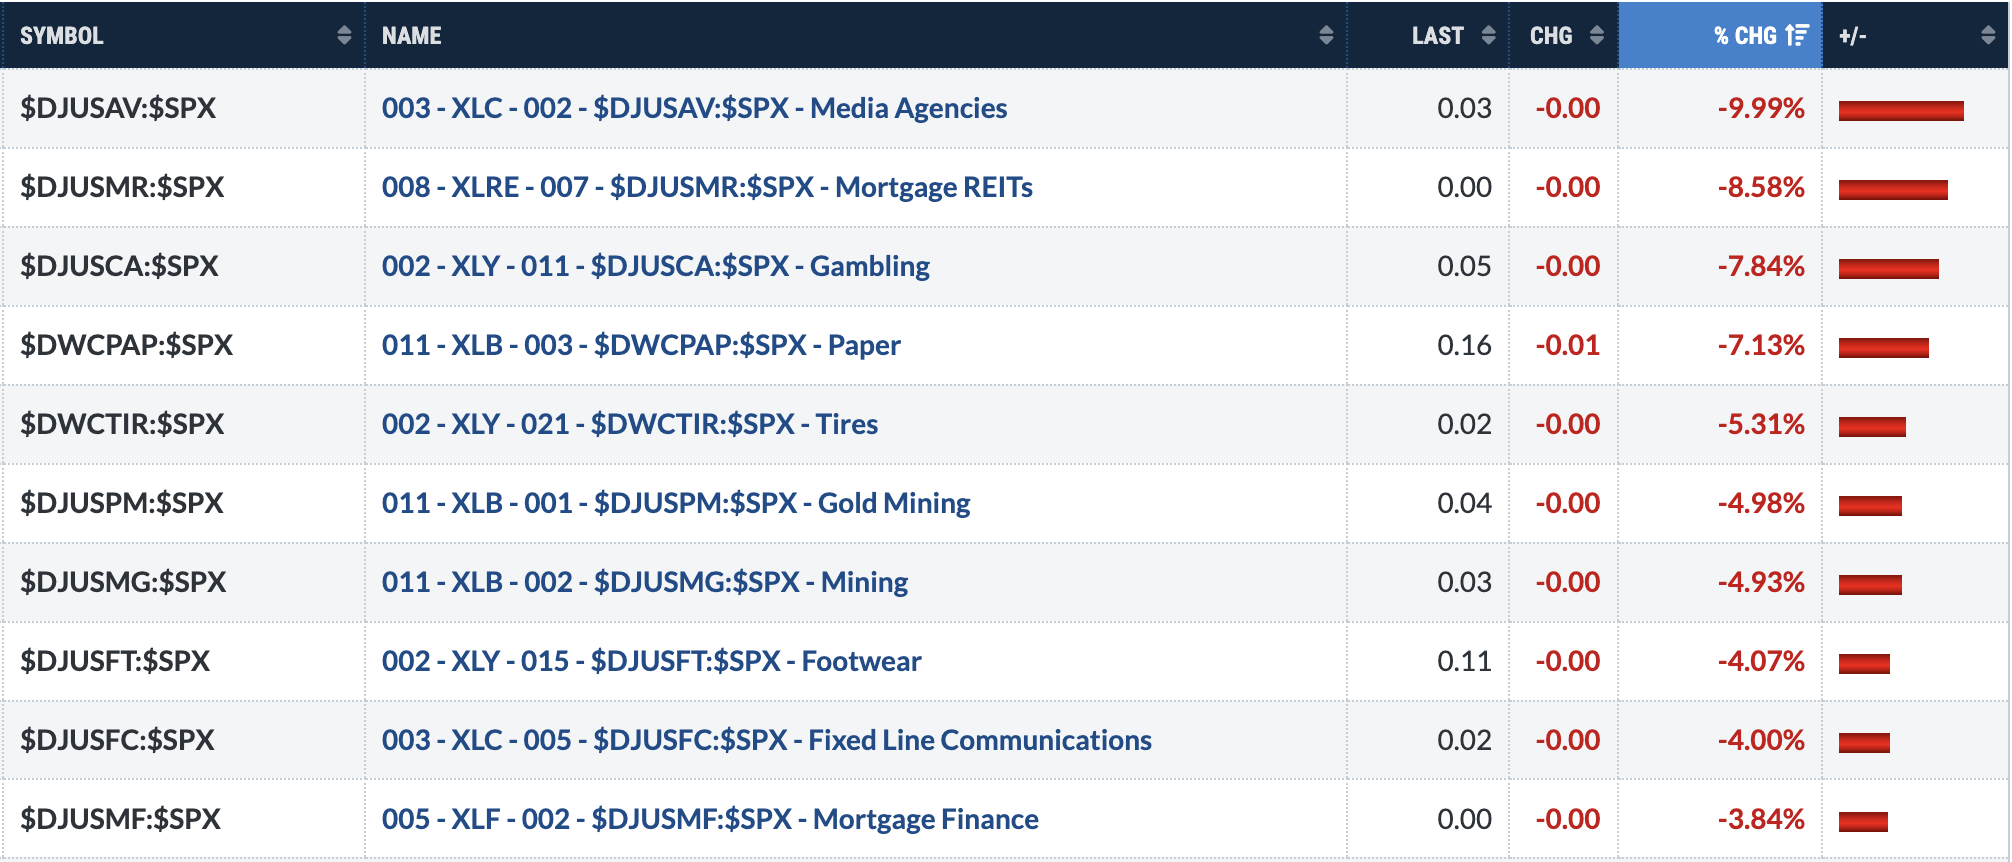
Bottom 10 Industries Last Week
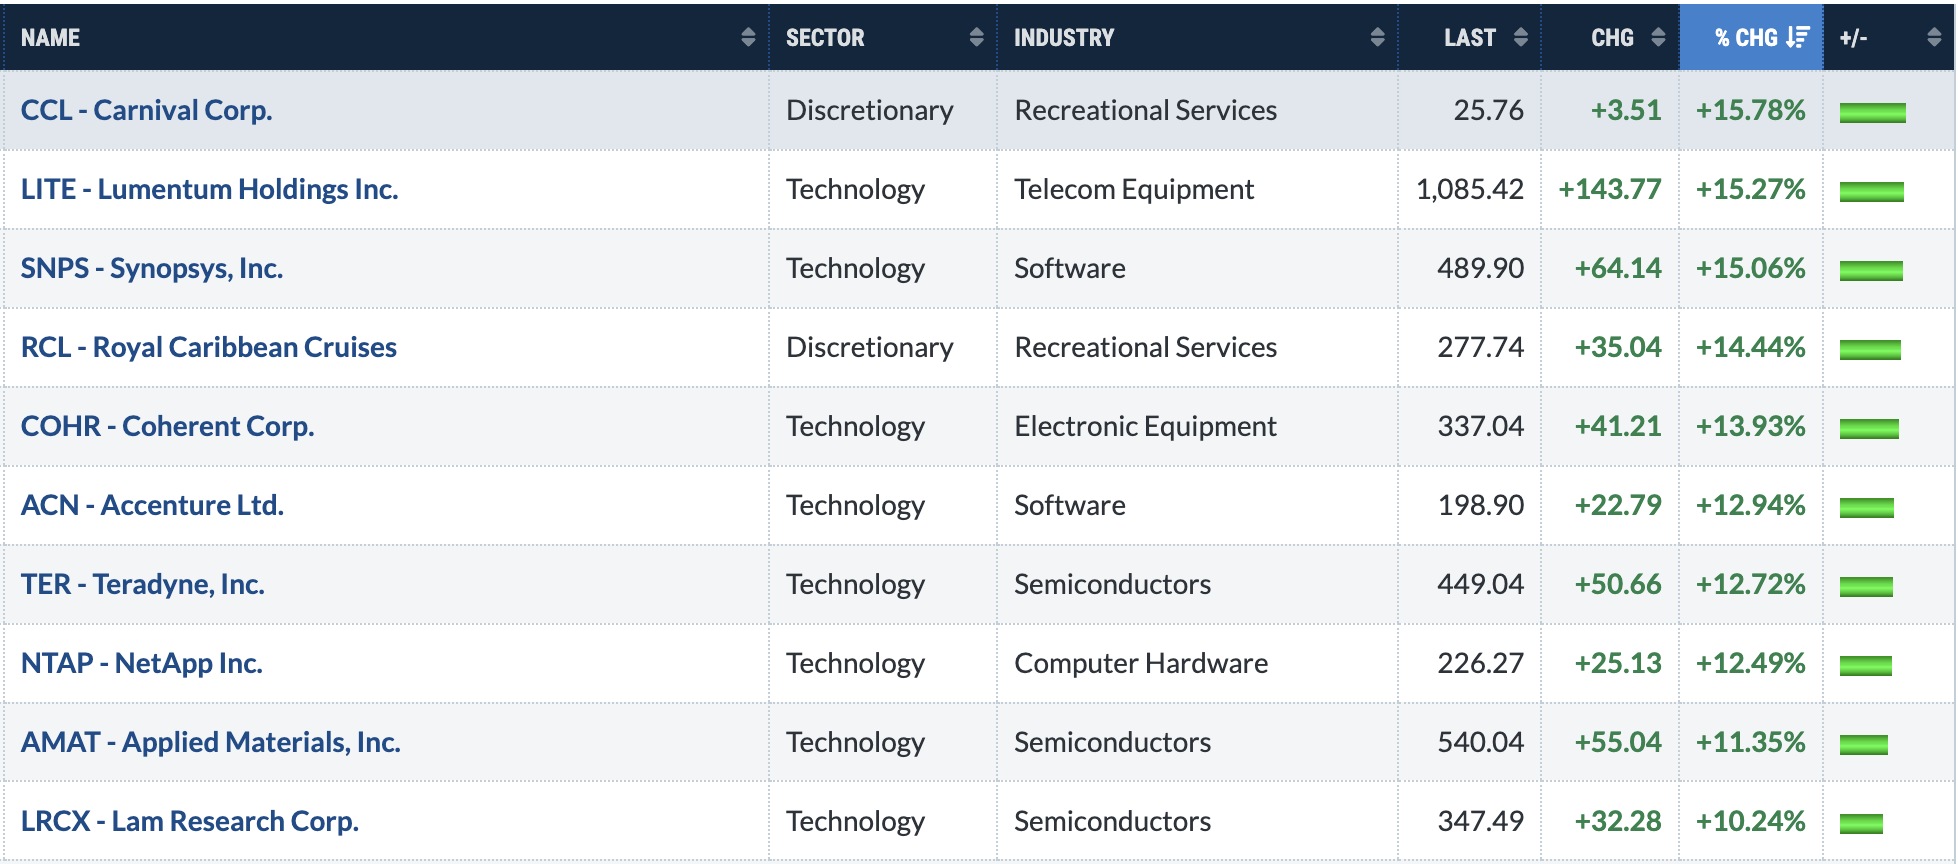
Top 10 Stocks - S&P 500/NASDAQ 100
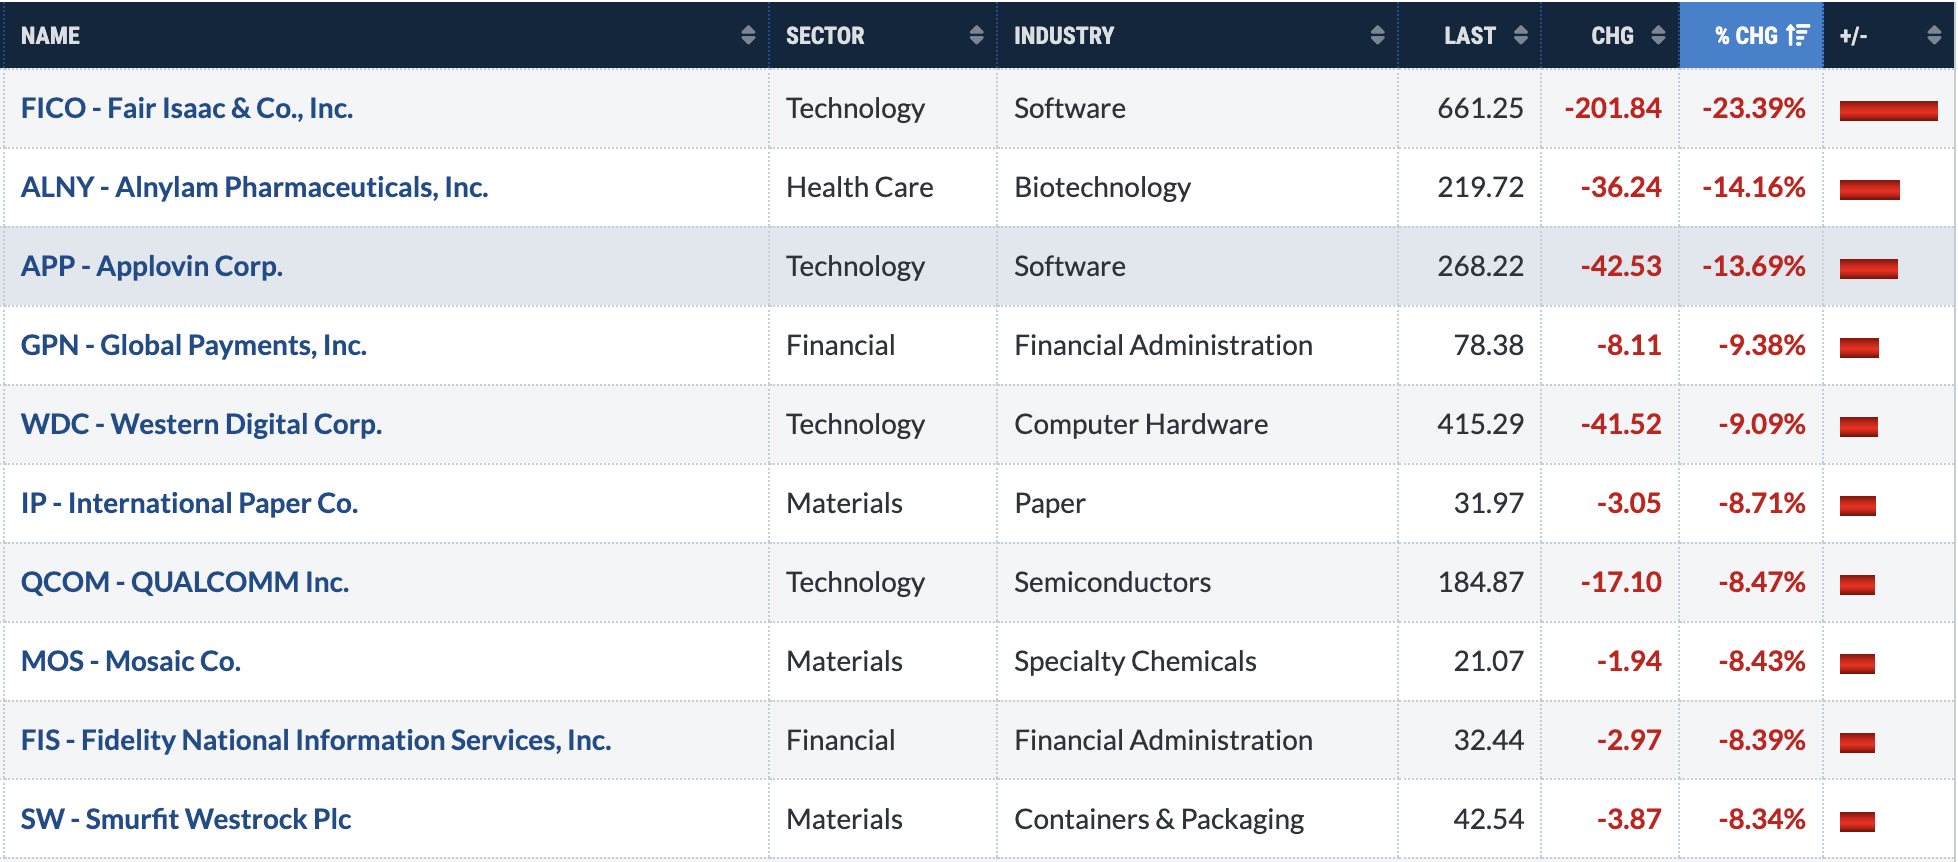
Bottom 10 Stocks - S&P 500/NASDAQ 100
Big Picture
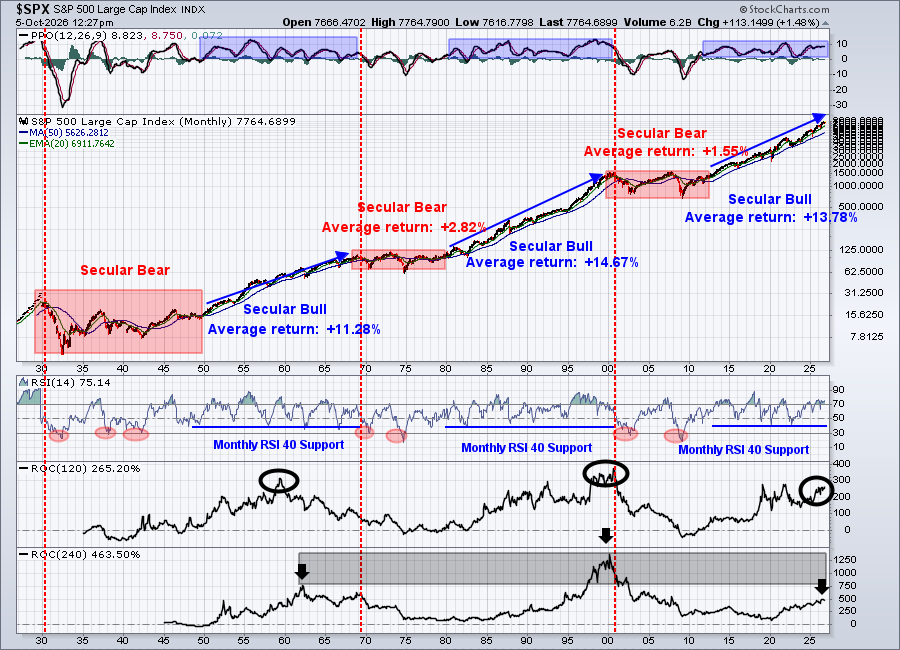
Jobs came in weak last week, helping to drive the 10-year treasury yield ($TNX) lower.....temporarily. Unfortunately, they came roaring back to set another multi-decade high.
The beauty of this chart for long-term investors, however, is that everything moves so slowly. The impacts of day-to-day or even week-to-week trading has almost zero impact on this monthly chart. That makes it much easier to sleep at night, not worrying about every news story and up-or-down move.
Sustainability Ratios
Here's the latest look at our key intraday ratios as we follow where the money is traveling on an INTRADAY basis (ignoring gaps):
QQQ:SPY
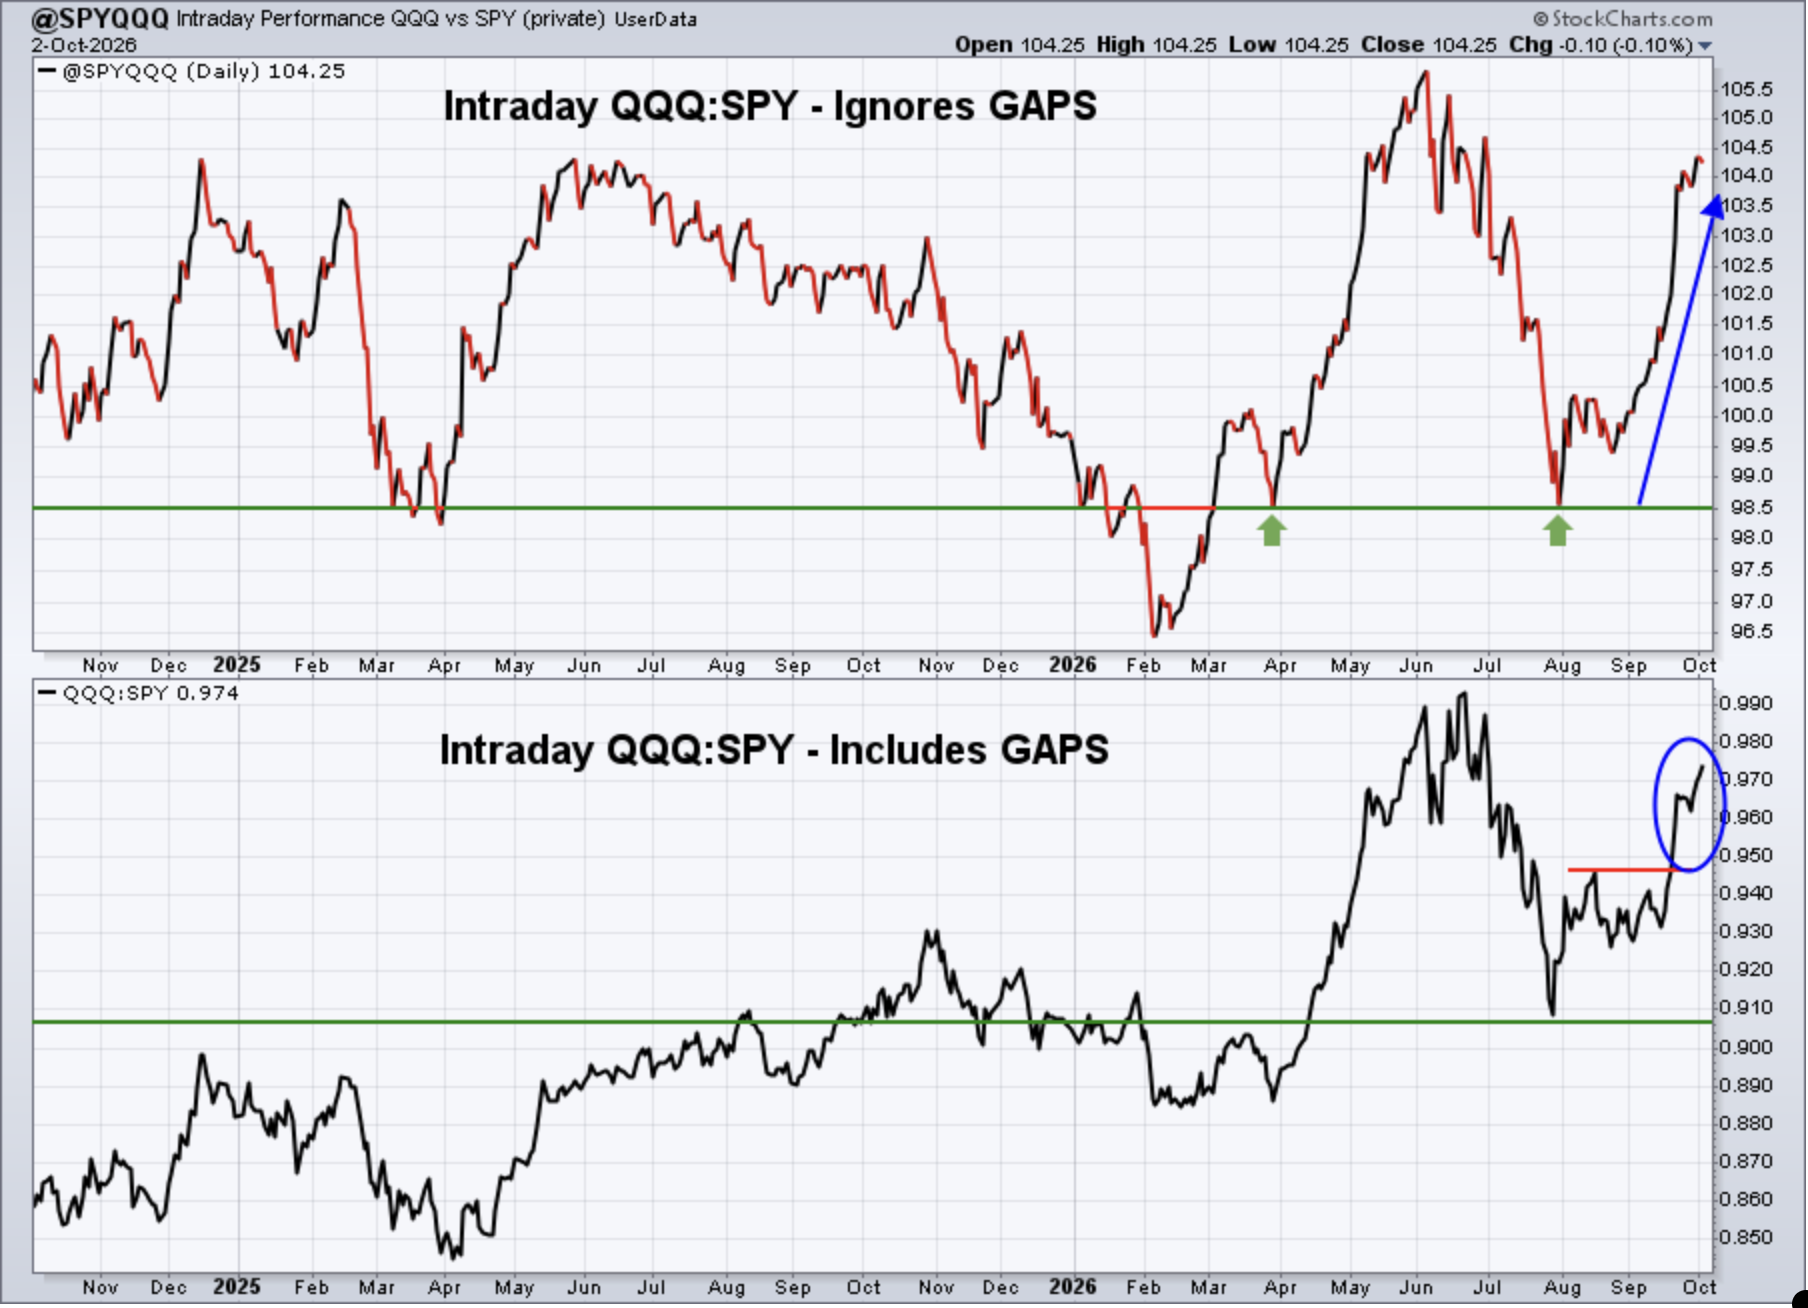
Keep in mind that the intraday analysis provided is a "work in progress". I continue to analyze this data to see if it helps provide us clues about calling market direction. It makes common sense to me that it should help in some sense, but it'll require a much longer-term study to determine its worth.
September was a very strong month for rotation from the SPY to the QQQ, underscoring the heavy rotation from value to growth. That is not what we see at significant market tops.
IWM:QQQ
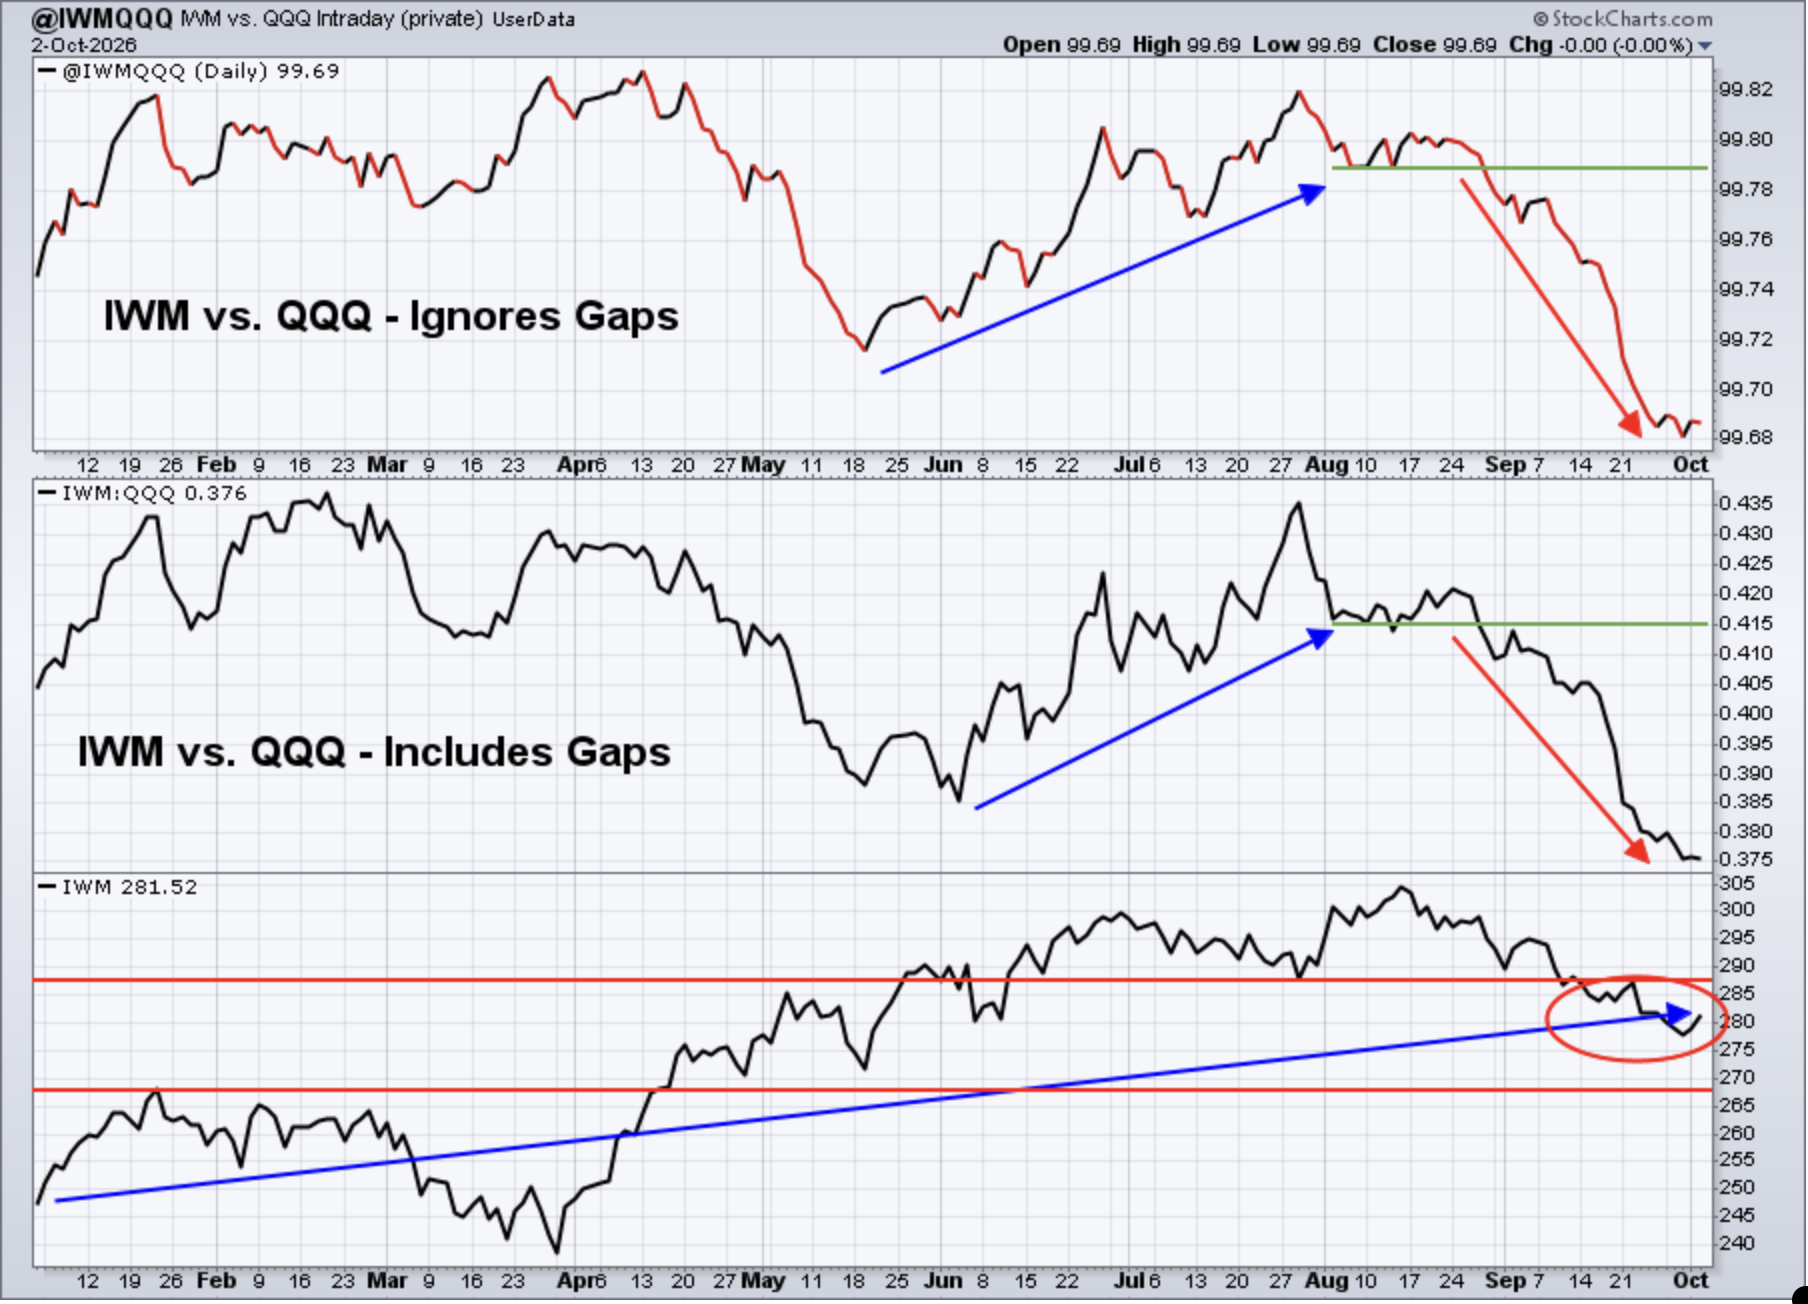
Higher 10-year treasury yields have impacted small caps as intensely as just about any other asset class. As I've said previously, I believe this will set up nicely for the group at some point down the road. I haven't seen any definitive clues that the TNX has topped, and as I write this, the TNX is back up to 5.31%, threatening yet another new multi-decade high. That is very likely to continue to weigh on the IWM. I do really like the IWM from a longer-term perspective, but the perfect short-term entry point is difficult to predict, because of the current continuing underperformance.
XLY:XLP
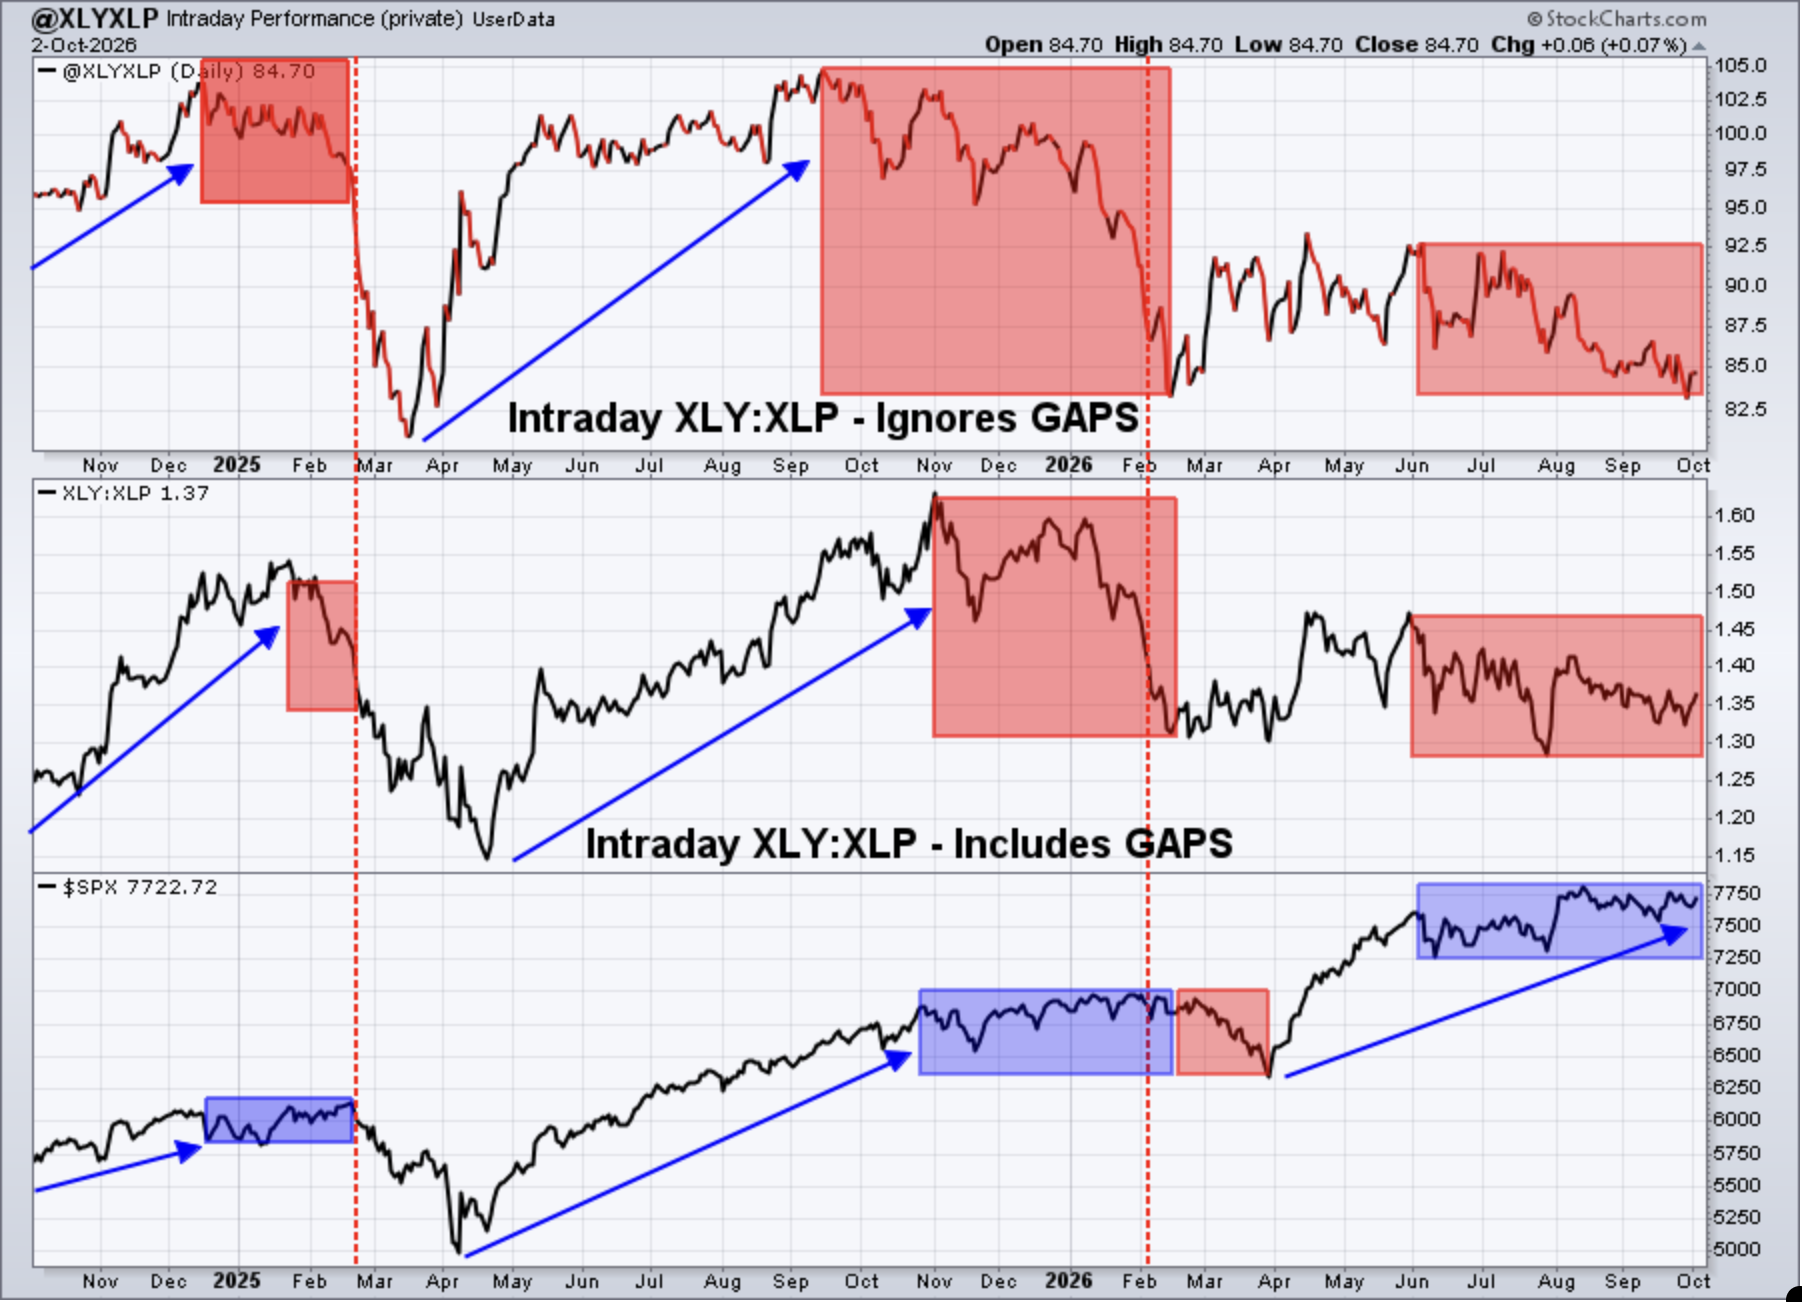
I will just reiterate what I mentioned last week. Consumer stocks have been weak in 2026 and they continue to be weak. I do believe, however, that when the TNX tops, money will rotate back into consumer names. In fact, that rotation into consumer stocks might just be the clue that the TNX is topping or has topped. It's going to require some patience.
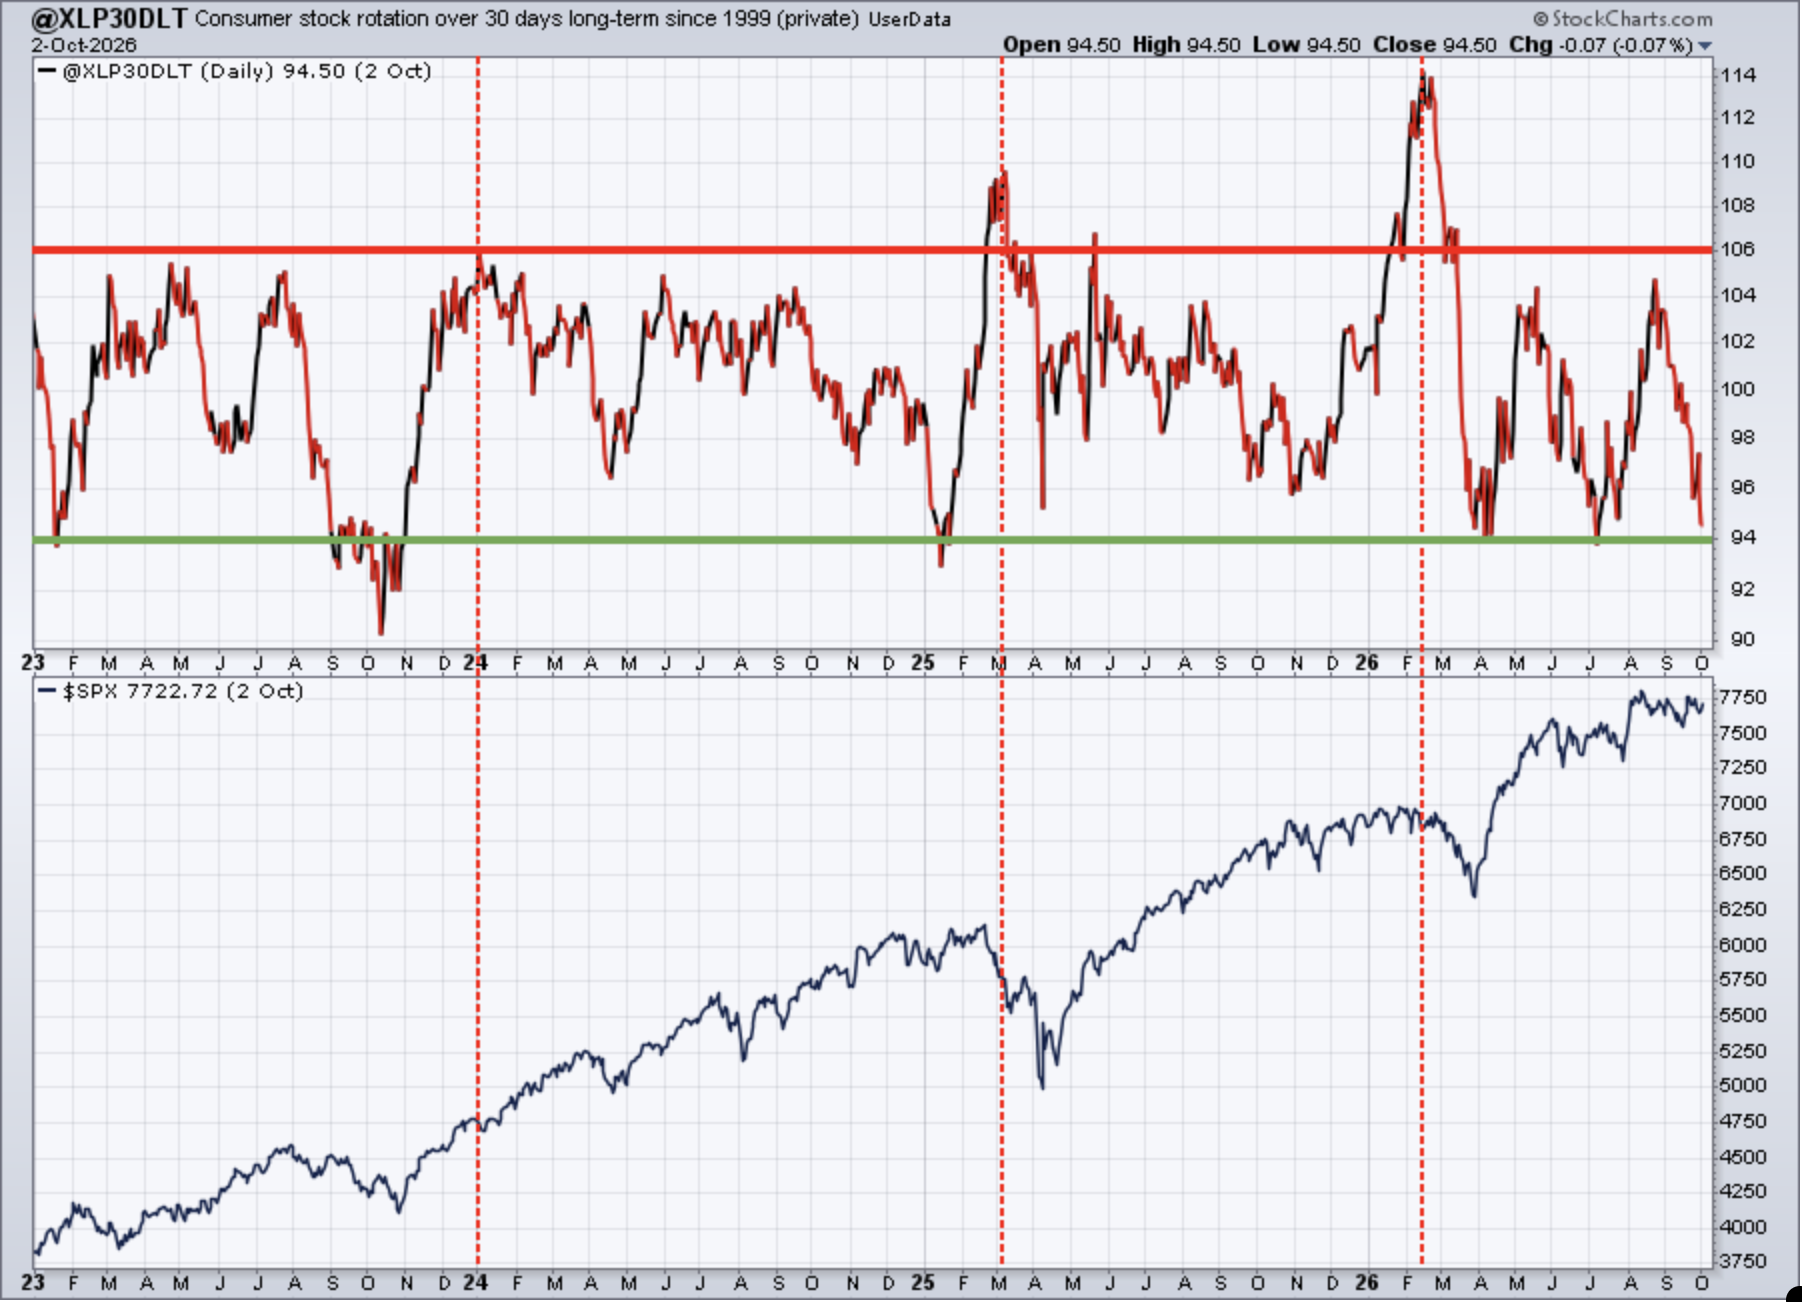
XLP 30-Day Cumulative Signal
I think it's a good idea to watch this signal regularly (weekly), which is why it's on this Weekly Market Report and will continue to be. One thing is absolutely certain at the moment. Wall Street is NOT pouring into staples stocks. And that should happen at ANY significant market top. I'm not saying we couldn't pull back in our key indices temporarily, but I'm convinced we will not see a significant market selloff at least into Q1 2027. I'm not saying we'll have one then either, but we can re-evaluate at that time.
The above paragraph is what I wrote last week and nothing has changed.
Here's where this signal currently resides:
Sentiment
5-day SMA ($CPCE)
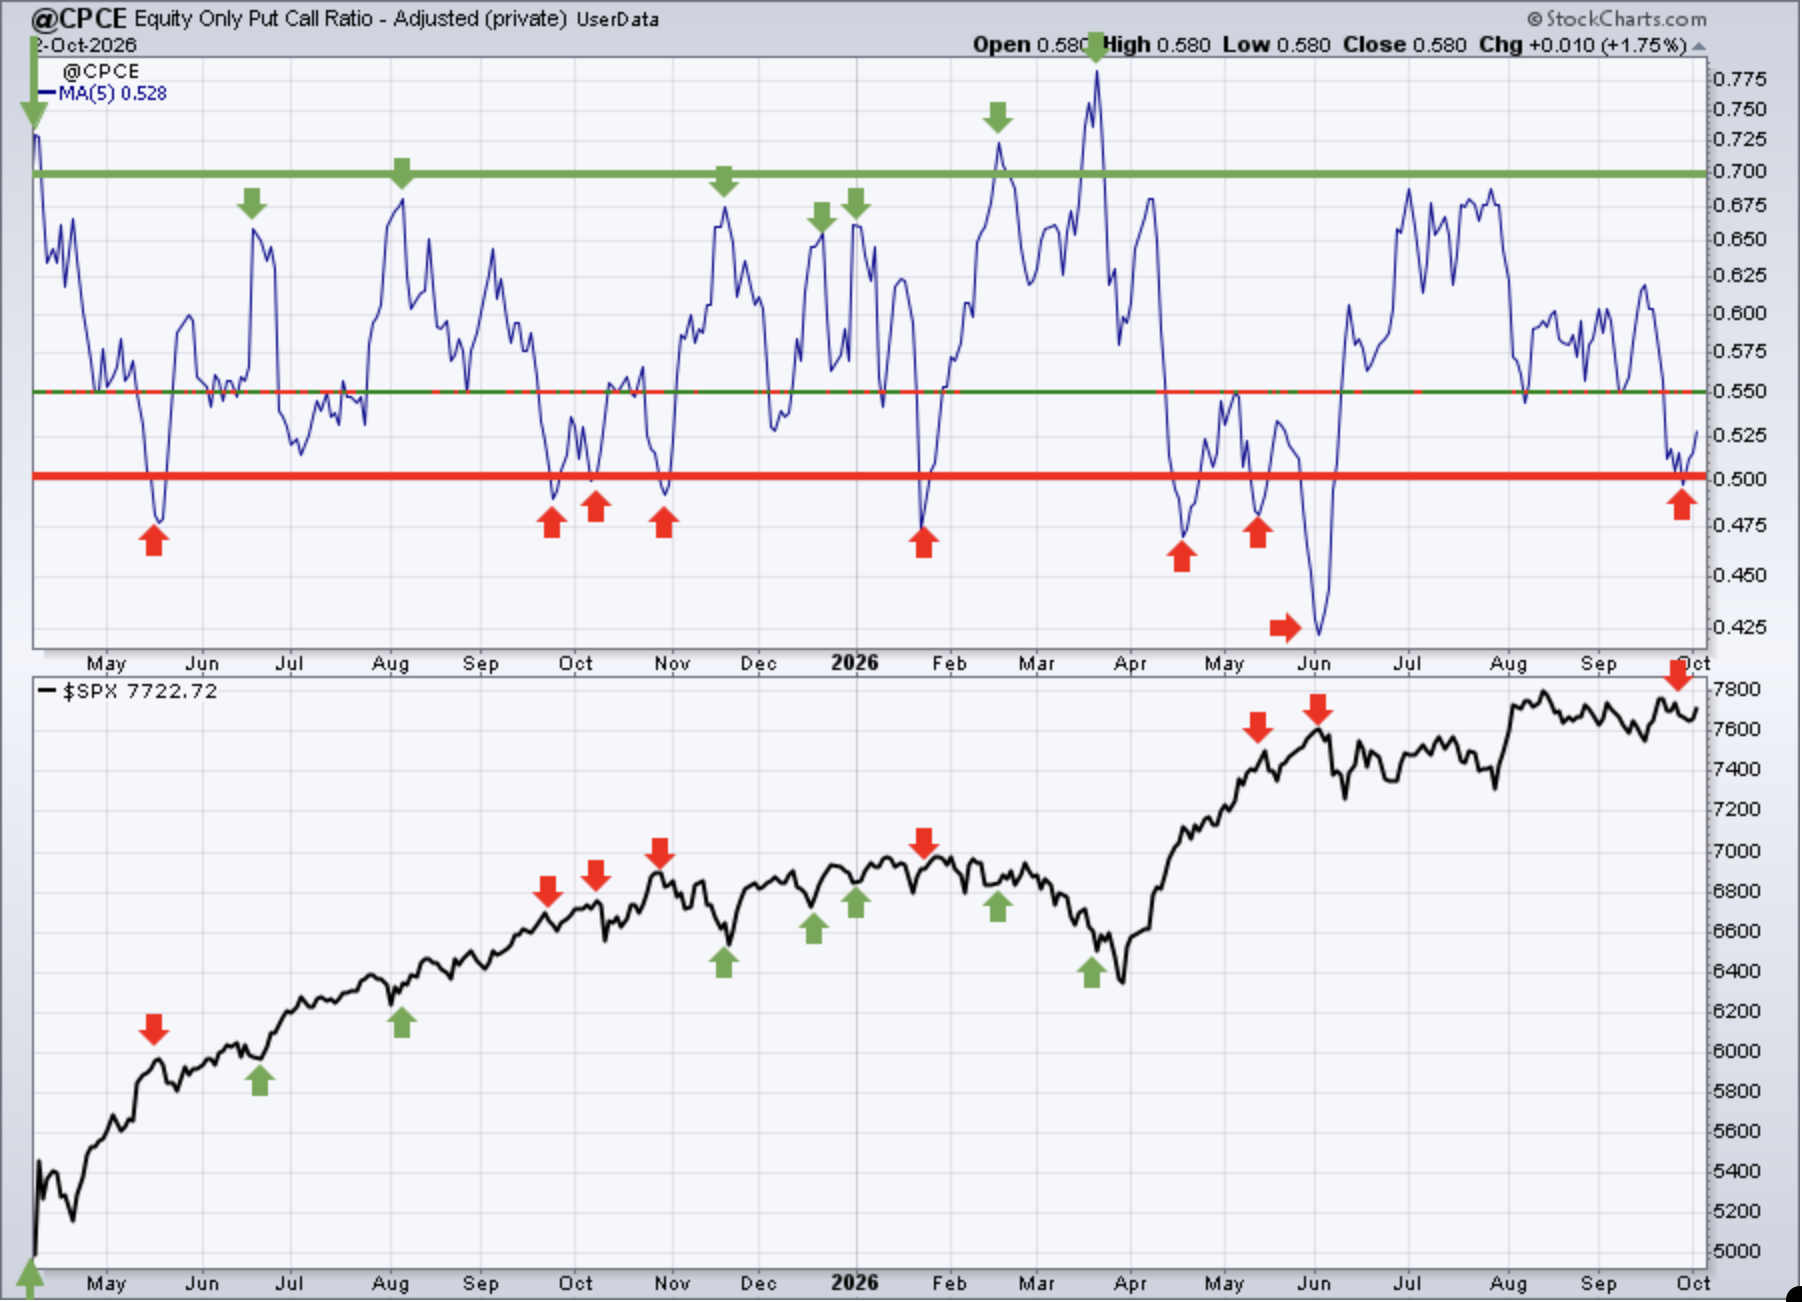
Sentiment indicators are contrarian indicators. When they show extreme bullishness, we need to be a bit cautious and when they show extreme pessimism, it could be time to become much more aggressive. Major market bottoms are carved out when pessimism is at its absolute highest level.
The 5-day CPCE is cause for concern near-term. Any time this signal hits 0.50 or lower, we've had tendencies to run into short-term market issues. Last week, we dipped just slightly beneath 0.50. That shows a bit of complacency on the part of options traders and CAN help to mark a short-term market top. The S&P 500 is up today and above 7750, so it's less than 1% from another breakout to an all-time high. Most of my signals remain bullish, so I won't grow bearish at this time, that's for sure. But further consolidation shouldn't be ruled out either.
253-day SMA ($CPCE)
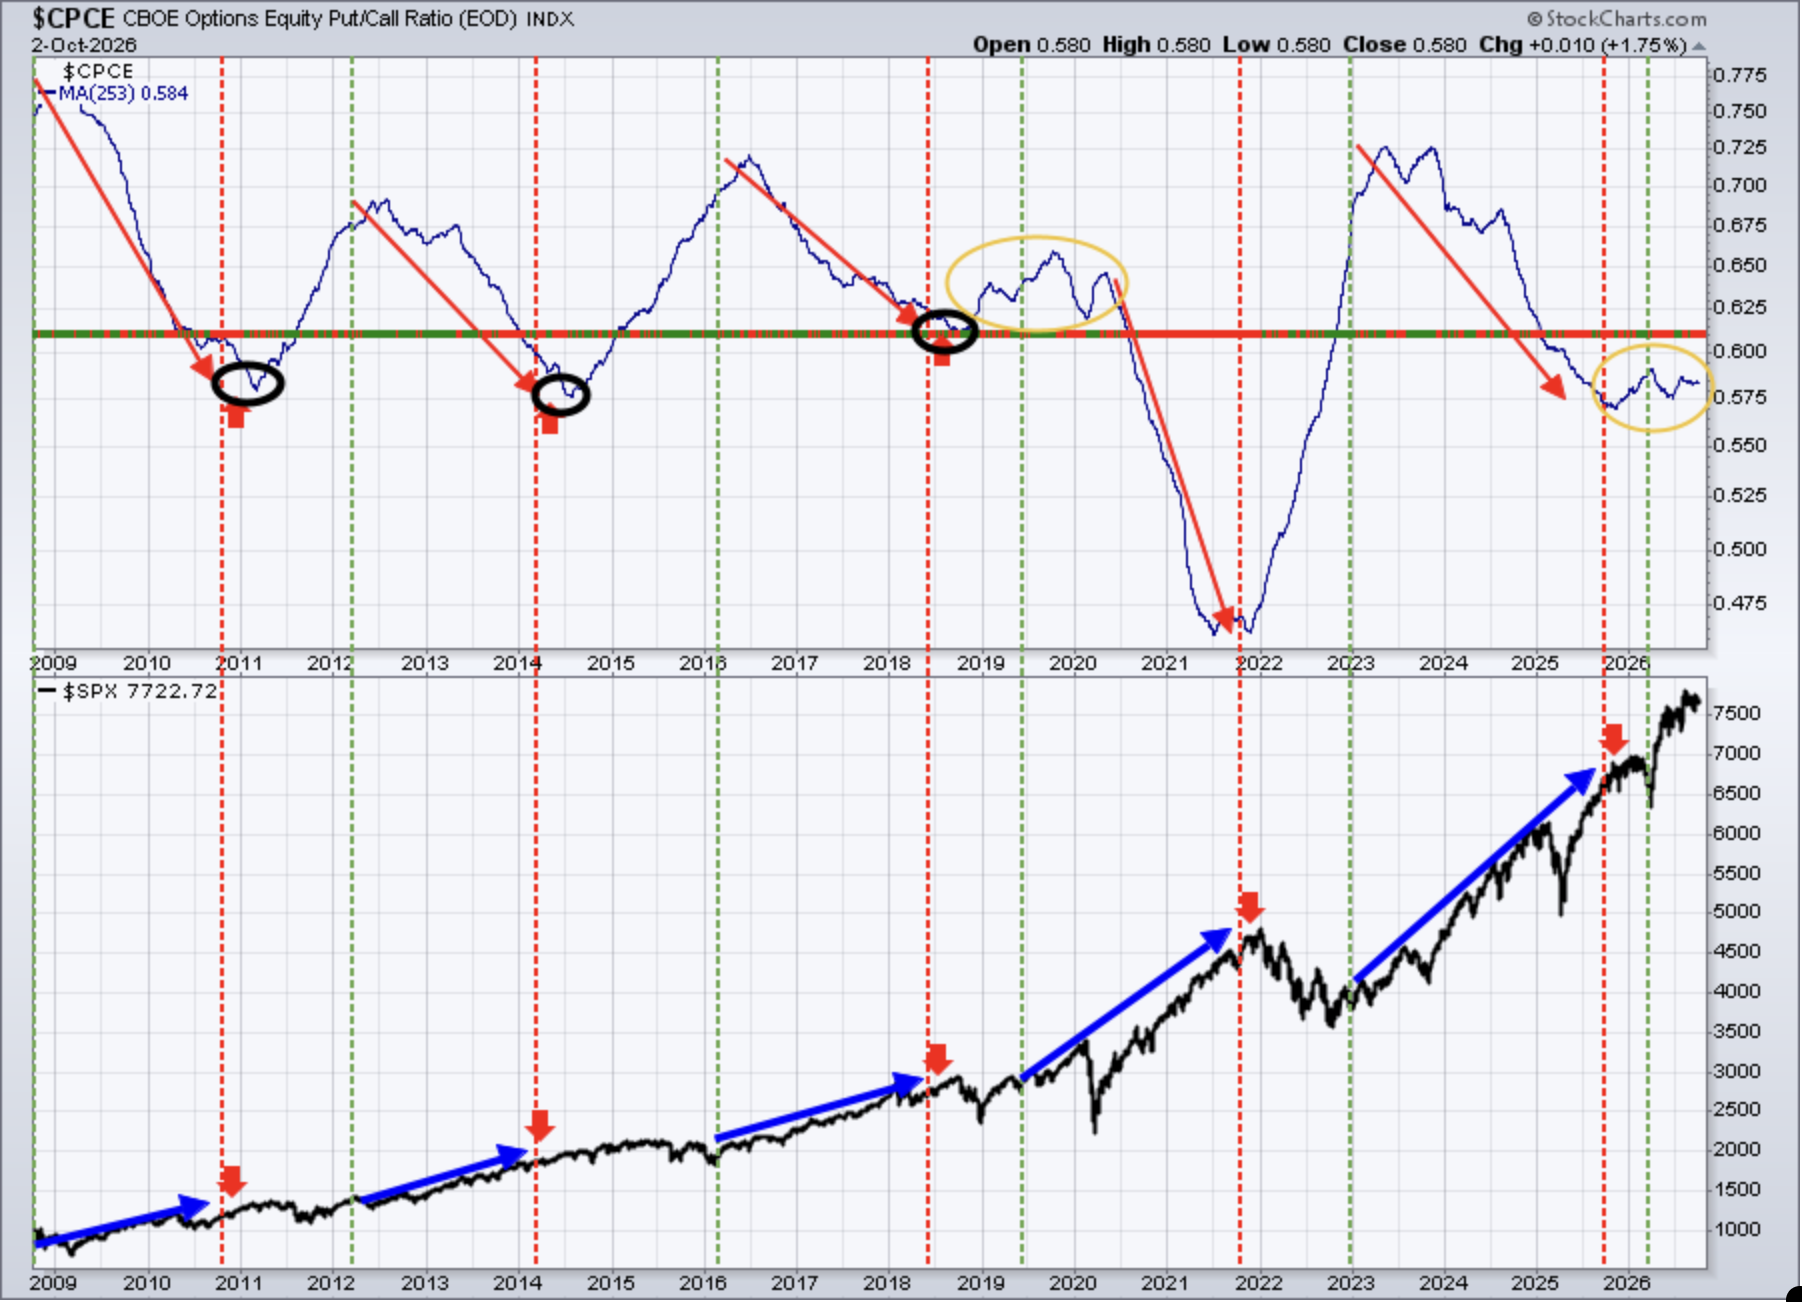
This longer-term 253-day SMA of the CPCE is our "ocean-liner" signal, unlike our short-term speedboat indicator. Any significant change in direction in this 253-day CPCE, in the past, has had profound effects on the S&P 500.
The yellow circle illustrates the total lack of conviction and the hesitation that traders have right now. A downtrend in this ratio generally accompanies a large secular bull market rally in the S&P 500, while an uptrend can spell trouble or, at the very least, lots of back and forth action in this benchmark index. That's been its history. Over the past year, this 253-day SMA can't make up its mind. I view this as neutral currently.
Again, the above is what I wrote last week and nothing at all has changed.
Long-Term Trade Setups
Since beginning this Weekly Market Report in September 2023, I've discussed the long-term trade candidates below that I really like. Generally, these stocks have excellent long-term track records, and many pay nice dividends that mostly grow every year. Only in specific cases (exceptions) would I consider a long-term entry into a stock that has a poor or limited long-term track record and/or pays no dividends. I try to review the long-term picture once a month, and below is how I viewed each MONTHLY chart as of Monday, October 5th:
- JPM - pulling back with neg divergence, let's watch 20-month EMA at 300
- BA - monthly RSI has been between 40 and 60 for 4 years. Enough said.
- FFIV - more new highs being reached, bullish
- MA - mentioned last month handle could form to 500, just about there
- GS - neg divergence suggested caution in Sept and GS fell 10%, watch 830 level
- FDX - excellent long-term support from 240-265
- AAPL - now slightly overbought, but uptrend is very strong
- CHRW - losing 20-month EMA support, so could see drop to 110
- JBHT - recent selling should find support/buyers around 215
- STX - consolidation continuing after massive rally, remains bullish
- HSY - drop below 170 now brings 140 support into play potentially
- DIS - every move up for past decade seems to get little follow through
- MSCI - very lengthy consolidation, excellent support in 500-520 range
- SBUX - 5-year consolidation still in play, need break above 112 or so
- KRE - on 2-month losing streak, but still trades comfortably above 20-mo EMA
- ED - currently trading in uptrend, near both price support and 20-month EMA
- AJG - September reversal lower now suggesting further consolidation ahead
- NSC - cup with handle breakout still bullish, but look for 20-month EMA test
- RHI - never quite reached 250 resistance, now rolling over again
- ADM - hit 2022 resistance, expect downside to 20-month EMA closer to 70
- BG - pullback to 20-month EMA looks like solid long-term entry point
- CVS - given strong monthly PPO, further selling to 20-day EMA buyable
- HRL - monthly pos divergence, which suggests selling momentum slowing
- DE - gaining strength and momentum, looks to head higher
- LULU - something just isn't right here, no relief; look to 80 for next support
- TTD - removing TTD going forward, renewed selling below 13 very bearish
- META - challenged all-time high in September, regaining strength
- ADBE - 20-month EMA not quite reached, rolling over again
- KMB - 115 resistance stalled advance, now looking to hold 90 support
- ORCL - held major long-term support at 115, trading on its 50-month SMA
- ABBV - strengthening, rising 20-month EMA should continue to offer support
- MCD - monthly RSI now under 35, very oversold, could see trip to 210
- MKC - breaking below May low with yield now over 4.25%; interesting buy
- TSCO - monthly PPO very weak, bounce short-lived, could 20 be possible?
Keep in mind that our Weekly Market Reports favor those who are more interested in the long-term market picture. Therefore, the list of stocks above are stocks that we believe are safer (but nothing is ever 100% safe) to own with the long-term in mind. Nearly everything else we do at EarningsBeats.com favors short-term momentum trading, so I wanted to explain what we're doing with this list and why it's different.
Also, please keep in mind that I'm not a Registered Investment Advisor (and neither is EarningsBeats.com nor any of its employees) and am only providing (mostly) what I believe to be solid dividend-paying stocks for the long term. Companies periodically go through adjustments, new competition, restructuring, management changes, etc. that can have detrimental long-term impacts. Neither the stock price nor the dividend is ever guaranteed. I simply point out interesting stock candidates for longer-term investors. Do your own due diligence and please consult with your financial advisor before making any purchases or sales of securities.
Looking Ahead
Upcoming Earnings
The following list of companies is NOT a list of all companies scheduled to report quarterly earnings, however, just key reports, so please be sure to check for earnings dates of any companies that you own. Any company in BOLD represents a stock in one of our portfolios and the amount in parenthesis represents the market capitalization of each company listed:
- Monday: None
- Tuesday: STZ ($19 billion)
- Wednesday: None
- Thursday: PEP ($171 billion)
- Friday: DAL ($55 billion)
Key Economic Reports
- Monday: September PMI services, September ISM services
- Tuesday: None
- Wednesday: FOMC minutes
- Thursday: Initial jobless claims
- Friday: October consumer sentiment
Historical Data
I'm a true stock market historian. I am absolutely PASSIONATE about studying stock market history to provide us more clues about likely stock market direction and potential sectors/industries/stocks to trade. While I don't use history as a primary indicator, I'm always very aware of it as a secondary indicator. I love it when history lines up with my technical signals, providing me with much more confidence to make particular trades.
Below you'll find the next two weeks of historical data and tendencies across the three key indices that I follow most closely. The percentage for each calendar day represents the annualized return for that day. An example of how this is calculated is reflected next to the first day under the S&P 500 and in parenthesis:
S&P 500 (since 1950)
- Oct 5: +66.17% (Ex: cumulative gains =
+14.12% over 54 trading days since 1950. +14.12% x 253/54 = +66.17%) - Oct 6: +36.20%
- Oct 7: -36.76%
- Oct 8: +9.31%
- Oct 9: -61.11%
- Oct 10: -1.68%
- Oct 11: +28.18%
- Oct 12: +10.11%
- Oct 13: +73.05%
- Oct 14: +5.59%
- Oct 15: -11.44%
- Oct 16: -5.18%
- Oct 17: +2.16%
- Oct 18: +63.55%
NASDAQ (since 1971)
- Oct 5: +41.24%
- Oct 6: +5.37%
- Oct 7: -81.43%
- Oct 8: +10.81%
- Oct 9: -49.54%
- Oct 10: -7.89%
- Oct 11: +79.53%
- Oct 12: +38.25%
- Oct 13: +135.76%
- Oct 14: +20.05%
- Oct 15: +2.12%
- Oct 16: -1.41%
- Oct 17: -28.22%
- Oct 18: +32.51%
Russell 2000 (since 1987)
- Oct 5: +31.68%
- Oct 6: -23.34%
- Oct 7: -156.30%
- Oct 8: -63.96%
- Oct 9: -139.03%
- Oct 10: +98.17%
- Oct 11: +30.34%
- Oct 12: +8.61%
- Oct 13: +78.03%
- Oct 14: +40.68%
- Oct 15: +9.90%
- Oct 16: +138.15%
- Oct 17: -42.49%
- Oct 18: +6.10%
The S&P 500 data dates back to 1950, while the NASDAQ and Russell 2000 information date back to 1971 and 1987, respectively.
Final Thoughts
After a month of surging treasury yields, the September jobs report was released on Friday, showing that the jobs market is not nearly as strong as suggested by the August jobs report. That immediately had market participants thinking that the Fed would hold off on another rate hike later this month.
We all need to remember that what we see NOW in terms of economic news and inflationary pressures sometimes is in direct conflict with what the stock market sees 6-9 months from now. The stock market is THE leading economic indicator, in my opinion, so we need to respect the messages sent via the charts, not the messages sent via CNBC.
Here's what I'll be thinking about this week:
Interest Rates. Despite the weak jobs report, the TNX has resumed its climb. After a significant drop in the TNX at Friday's open, and after the September jobs report was released, the TNX has surged once again. It hit a low of 5.16% on Friday morning, but has been rising ever since, nearly touching 5.34% just moments ago. Money is NOT rotating to support inflationary concerns, but it IS rotating to support economic strength ahead.
Growth vs Value. I don't question where the money is going. Rather, I listen to it. The large cap growth ETF (IWF) crushed the large cap value ETF (IWD) during the month of October, while yields were surging. If yields were rising due to inflationary concerns, the exact opposite should have been happening and growth stocks should have been beaten up on a relative basis.
Earnings. It's hard to believe, but we're just a week away from the start of another earnings season. JP Morgan (JPM) has been showing renewed relative strength in the banking area, though most probably don't see it, because the entire group has been selling due to the Fed's shift towards hiking the fed funds rate. What will Jamie Dimon, CEO of JPM and Professor of Banking Doom, have to say about the economy? Given his history, I'm sure it won't be a rosy forecast. Still, it represents the kickoff of earnings season and stocks generally outperform estimates. For me, it's just a matter of when the S&P 500 breaks to a fresh all-time high, not IF.
Technical Conditions. Well, we escaped September without any significant damage on either the S&P 500 ($SPX) or the NASDAQ 100 ($NDX). In fact, the latter hit a new all-time high as growth stocks powered forward during the seasonally-weak month of September. I'm not sure if the recent consolidation continues on the S&P 500 or if we see a breakout. The number I'm watching on the SPX, though, is 7807 on a candle body (opens and closes) basis and 7817 on an intraday basis.
Happy trading!
Tom