
EB Monthly Seasonality Report - November 2021
A Look Back At October 2021
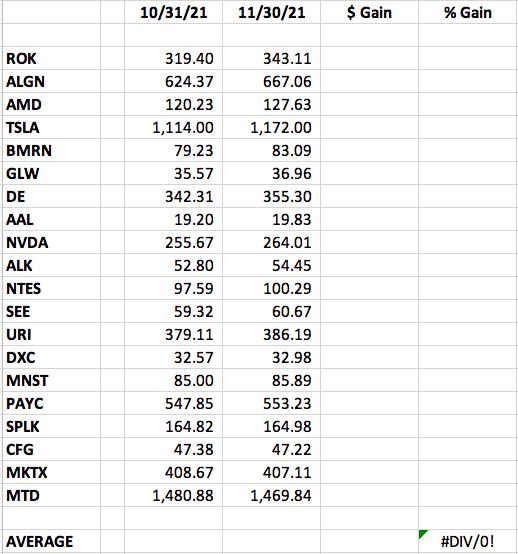
Below are the 20 stocks that were favored for the month of October and how they performed:
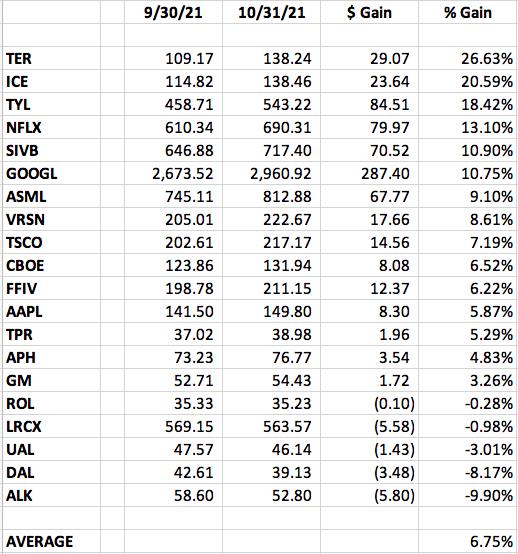
9 of the 20 stocks provided outperformed the S&P 500's return of +7.02% during October. The average return of +6.75% was just shy of the S&P 500 return.
The best performer from our October group was Teradyne, Inc. (TER), which surged more than 26%. That, combined with its early-November strength, has sent TER shares up to test overhead price resistance:
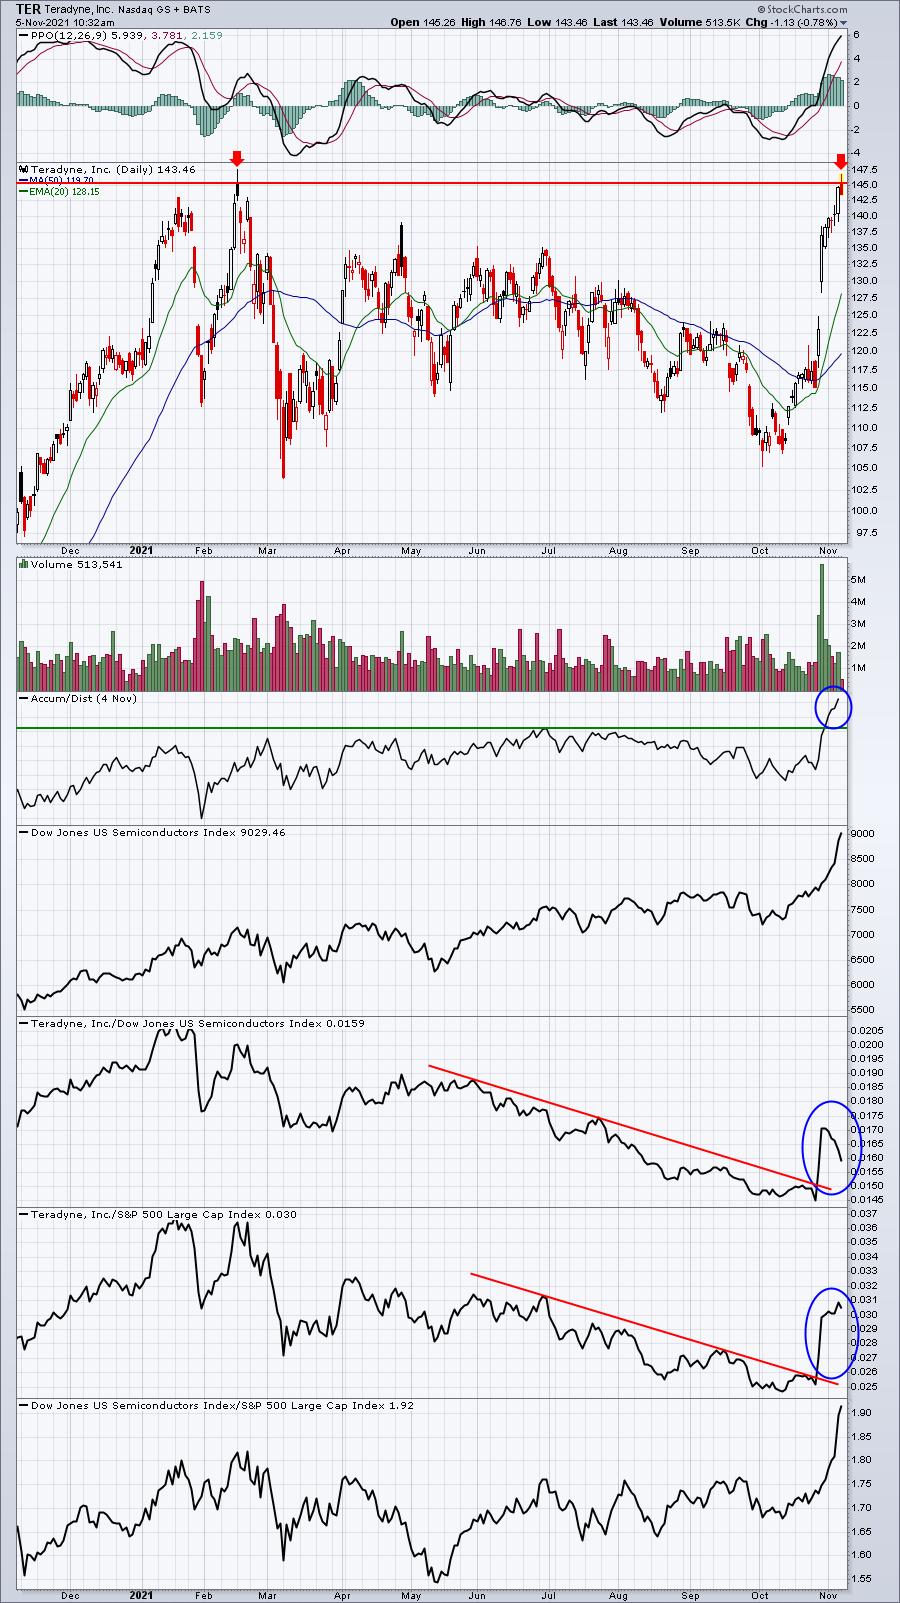
There's no doubt that TER being part of the semiconductor group ($DJUSSC) added to its October performance as semiconductors soared during October. But TER did some very good things technically, such as breaking its relative downtrend vs. both the DJUSSC and the S&P 500. Also, the AD line broke to a new high. Therefore, a future price breakout would be confirmed by that accumulation signal.
A Look Ahead To November 2021
S&P 500 Performance
Here's a breakdown of the annualized performance of the S&P 500 (since 1950) during the month of October:
November 1-5: +69.93%
November 6-20: -6.07%
November 21-30: +43.27%
November is an extremely bullish month. Over the past decade, the S&P 500 has advanced during EVERY November. Yep, it's 10 for 10. If we look back 20 years, the S&P 500 has gone higher 80% of all Novembers. Only April matches that level of success. Here's the 2 decade seasonality chart:
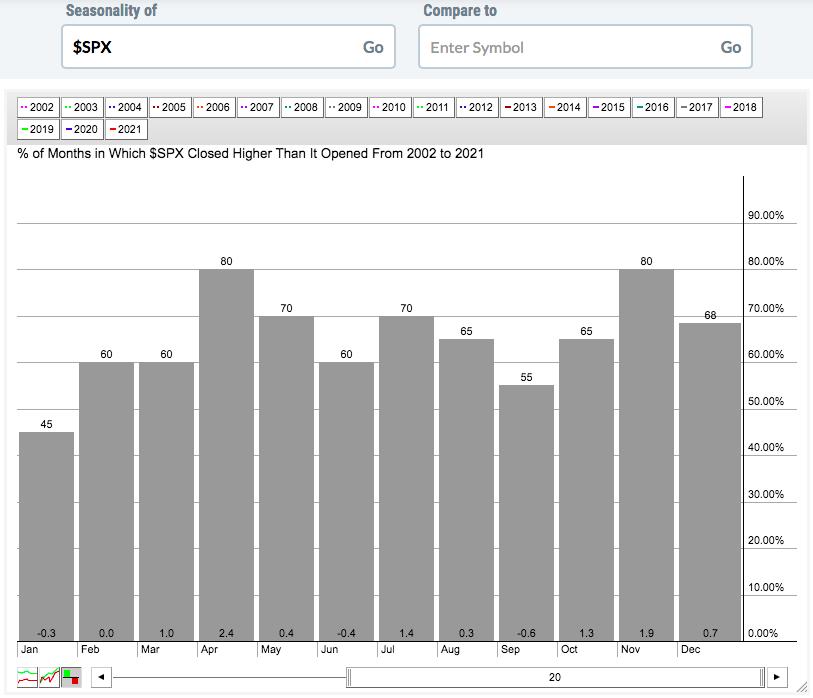 If you look at the average monthly return of the S&P 500, which appears at the bottom of each of those gray monthly bars, only April shows a higher average monthly return than November. Clearly, we're in a sweet spot historically for U.S. equities.
The breakdown of strength during November, however, is somewhat strange. The first week goes according to most calendar months' plans. That first week is extremely bullish. The November 6th to 20th period, however, is neutral to slightly weak. Normally, we have another bullish period mid-month, but not really in November. Then, after options expiration, we tend to see weakness in most calendar months, but not in November. The 21st through 30th is quite bullish.
Sector Performance
Before we look at individual stocks, let's get an overview of how the various sectors and industries have performed during November (and December) over the past decade (during this secular bull market):
Sector Heat Map:
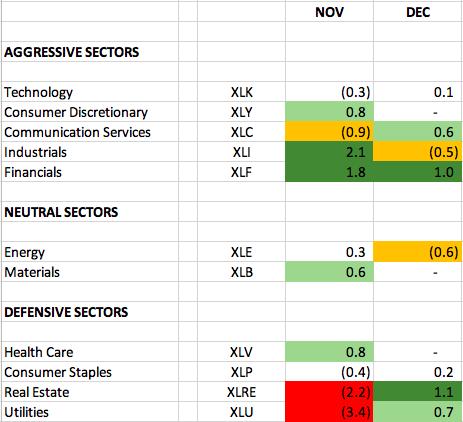
The numbers reflect how much a sector, on average, outperforms or underperforms the S&P 500 over the past 10 years. The dark green-shaded areas show significant outperformance (1.0 or greater). The light green-shaded areas show solid outperformance (from 0.5 to 1.0). The yellow-shaded areas show underperformance (-0.5 to -1.0). The red-shaded areas show significant underperformance (-1.0 or greater). Where there is no shading, there tends to be more neutral performance (-0.4 to 0.4).
When I look at these historical November numbers, I can't help but notice the huge relative strength in industrials (XLI). The reason I say this is that we're seeing a major price breakout on the XLI today:
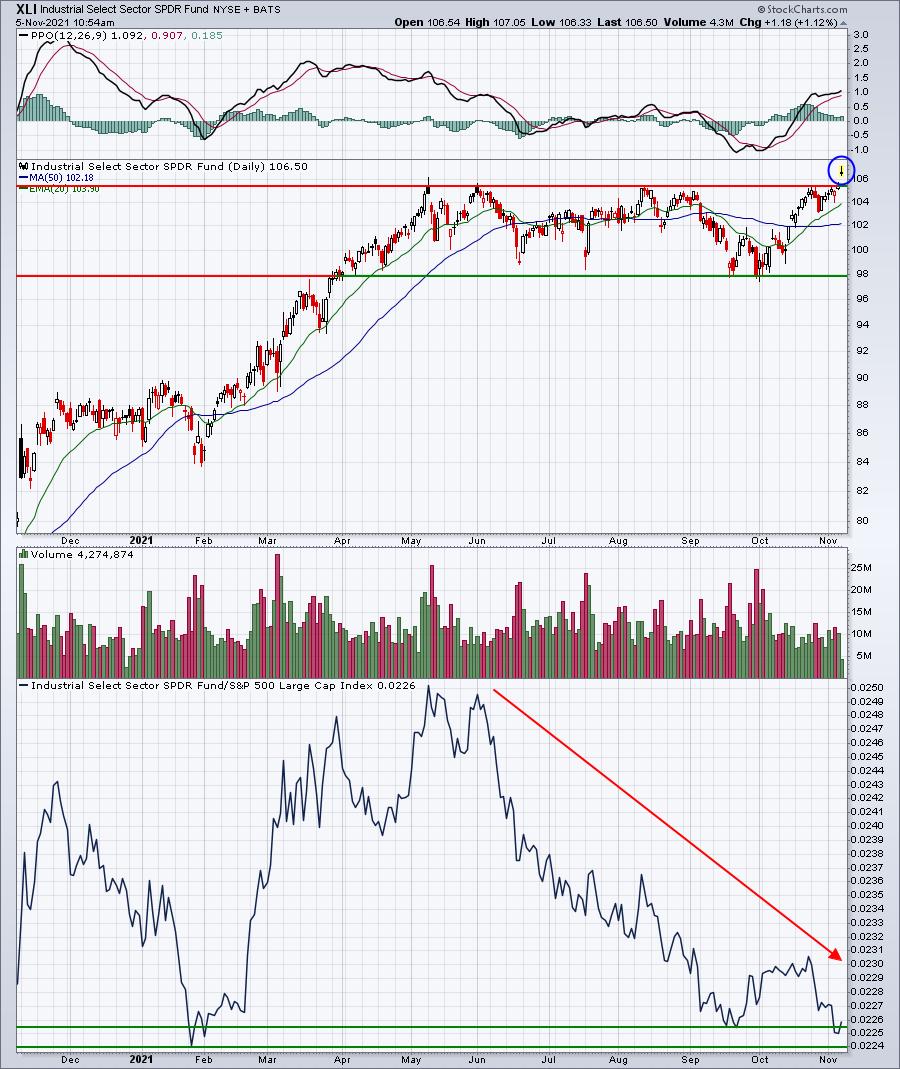
The combination of the XLI breakout and the historical relative strength suggests we should be overweight industrial stocks this month.
Industry Performance
Let's take a look at the industry heat map within industrials to drill down to the best seasonal strength among the various industry groups:
Industrials:
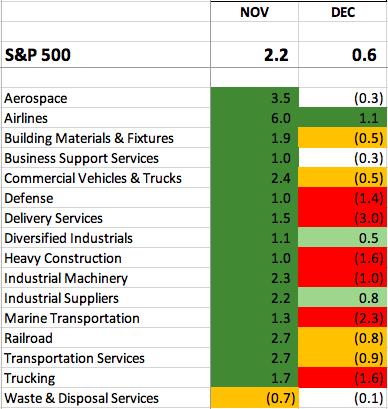
While nearly every industry group within industrials LOVES the month of November, two industries really stand out - airlines ($DJUSAR) and aerospace ($DJUSAS):
DJUSAR:
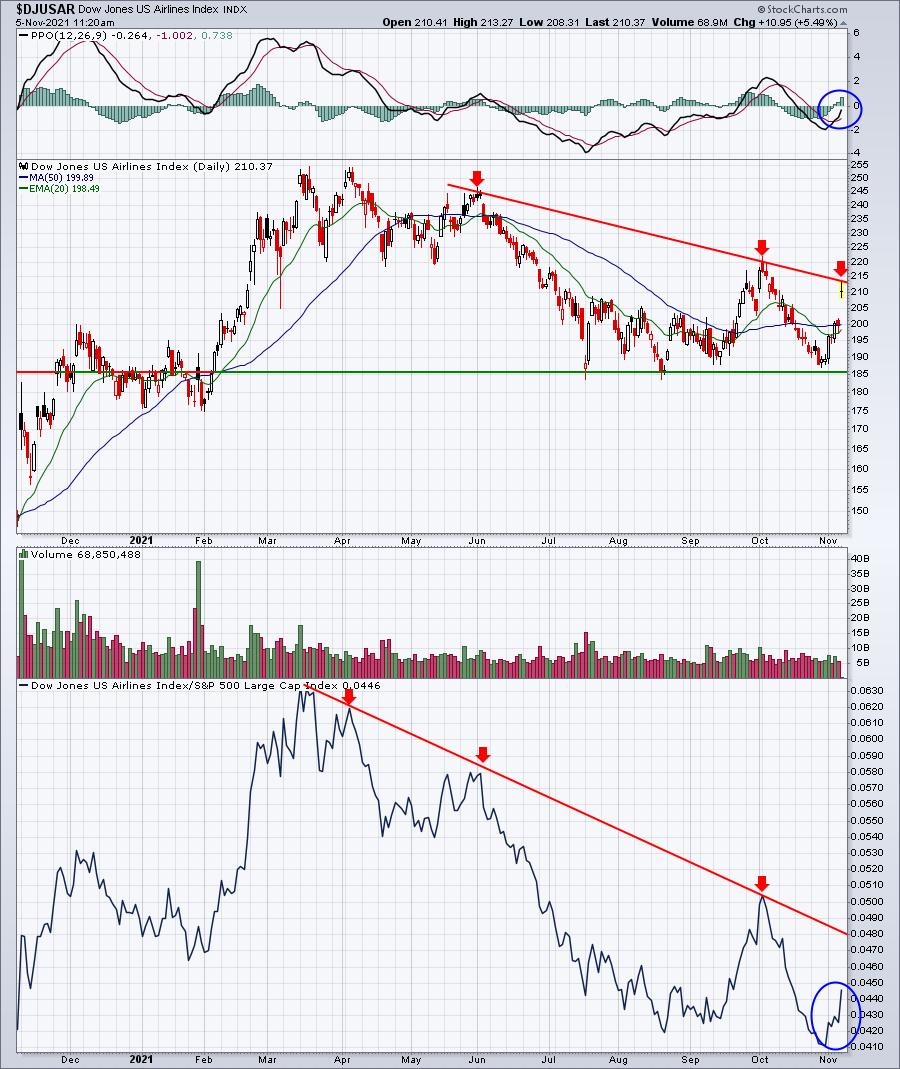
Let me be clear. Airlines are not a healthy group, but they love November. On the bottom panel of the chart above, you can see there's plenty of room for relative strength before a key relative trendline test takes place. On an absolute price basis, however, airlines are now testing key trendline resistance. If the group can break out above this downtrend line, the chance for further November relative strength increases significantly.
DJUSAS:
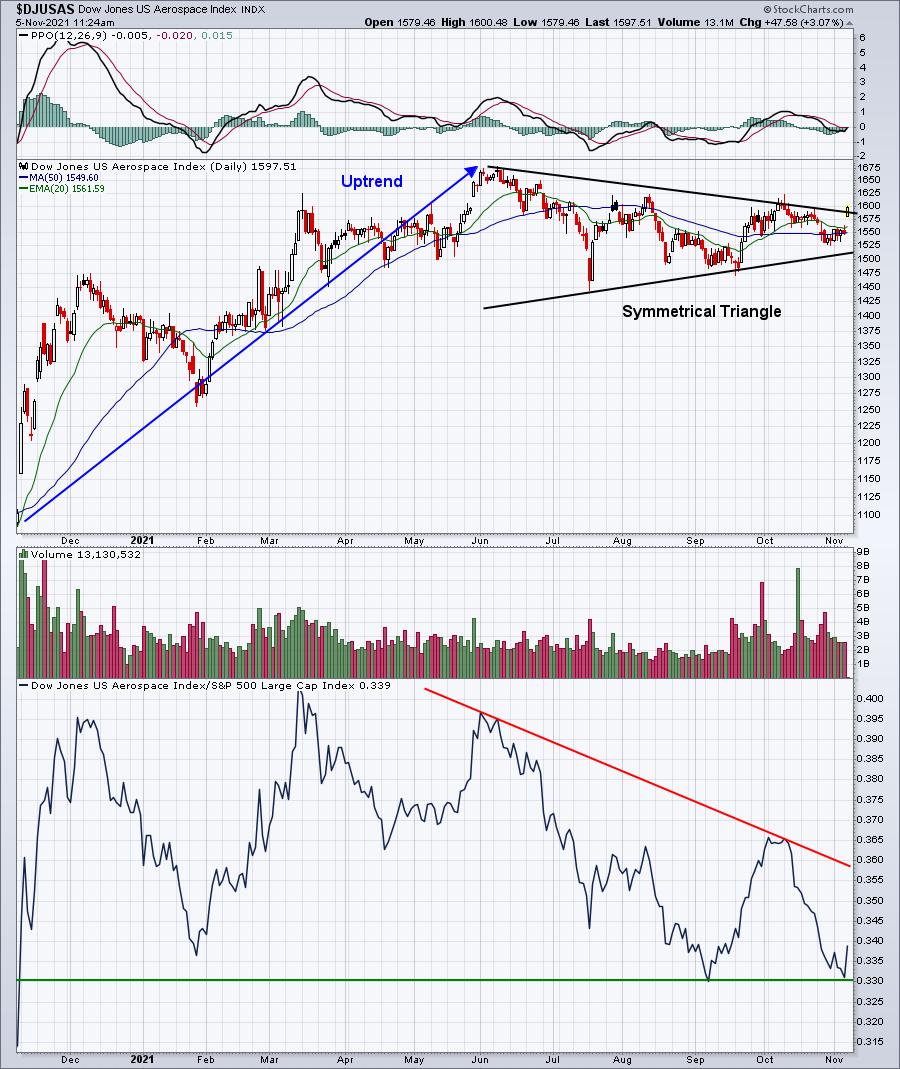
Are we seeing the start of a bullish symmetrical triangle continuation pattern breakout? If so, I'd be looking for much further strength in aerospace the balance of November.
Here are industry groups (within the other sectors) that tend to perform much better than the benchmark S&P 500 during November:
Technology (XLK):
- electronic equipment, electrical components & renewable energy
Consumer Discretionary (XLY):
- hotels, home construction, automobiles, durable household products, gambling, footwear, home improvement
Communication Services (XLC):
- broadcasting & entertainment, media agencies, publishing
Financials (XLF):
- asset managers, banks, life insurance, investment services
Health care (XLV):
- health care providers, biotechnology
Consumer staples (XLP):
- tires, drug retailers
Real estate (XLRE):
- real estate services, hotel & lodging REITs
Utilities (XLU):
- multiutilities, water, conventional electricity, gas distribution
Energy (XLE):
- none
Materials (XLB):
- aluminum, nonferrous metals, steel
Stocks for November
We've selected our Top 20 seasonal stocks for November from the S&P 500 and NASDAQ 100 and we passed these along to our members earlier this week. Several names represent sectors and industry groups that have been discussed above. Others simply stand out in November based on their own track record.
The stocks this month are as follows:
A "Seasonality - November 2021" ChartList has been created and is available for viewing/download on our website. You must be a StockCharts.com Extra or Pro member to download our ChartLists. Basic members and non-StockCharts.com members can view the charts one at a time. The charts will be annotated with a key support level (or two) to watch.
While the above 20 stocks are clearly strong November performers, there are plenty of others that show very strong seasonality traits, but simply weren't quite good enough to make our Top 20. Boeing (BA), for instance, is showing higher volume today and breaking back above its 50-day SMA. It's in that strong seasonal aerospace group and November has been BA's best month historically:
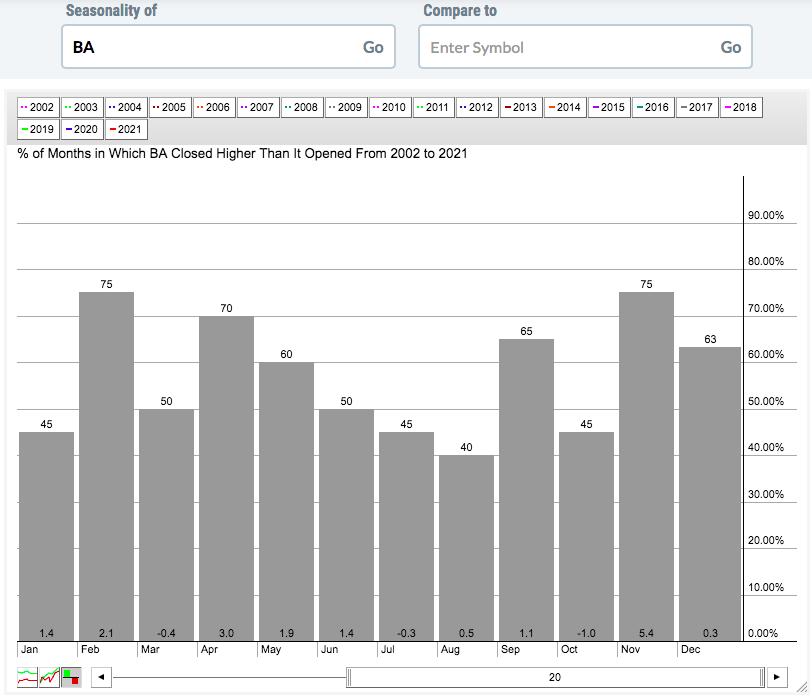
BA's average November gain over the past two decades has been 5.4%, almost doubling its second best seasonal month - April (+3.0%). My point is that if you like stocks breaking out (or pulling back to support) in the favorable sectors and industry groups discussed above, you might consider checking their seasonal behavior for further confirmation of the trade.
Happy trading!
Tom