
EB Weekly Market Report - Monday, November 27, 2023
Weekly Market Recap
Major Indices
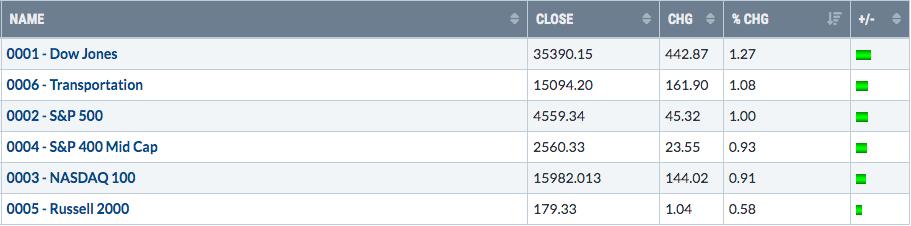
It was a fairly boring week last week as all of our major indices gained ground, but barely so. We should probably get used to this type of market behavior as we move forward. Bull markets are characterized by lower volatility and smaller daily and weekly moves. Yes, we saw a big move rather quickly earlier in November, but history tells us that when the Volatility Index ($VIX) falls below 17, and especially 13, mostly bullish action takes place and percentage moves are much less drastic. For instance, the lowest the VIX has been during the last 10 1/2 years when the S&P 500 falls 3% in a day, was just below 16. The VIX closed at 12.46 on Friday, its lowest level since the pandemic low in March 2020.
I wrote an article at StockCharts on Sunday regarding the VIX and key S&P 500 stats based on the level of the VIX. If you haven't had a chance to read it, you should check it out HERE.
Here's a quick glance at the S&P 500 daily chart and the key aggressive sectors and their relative performance in the panels below:
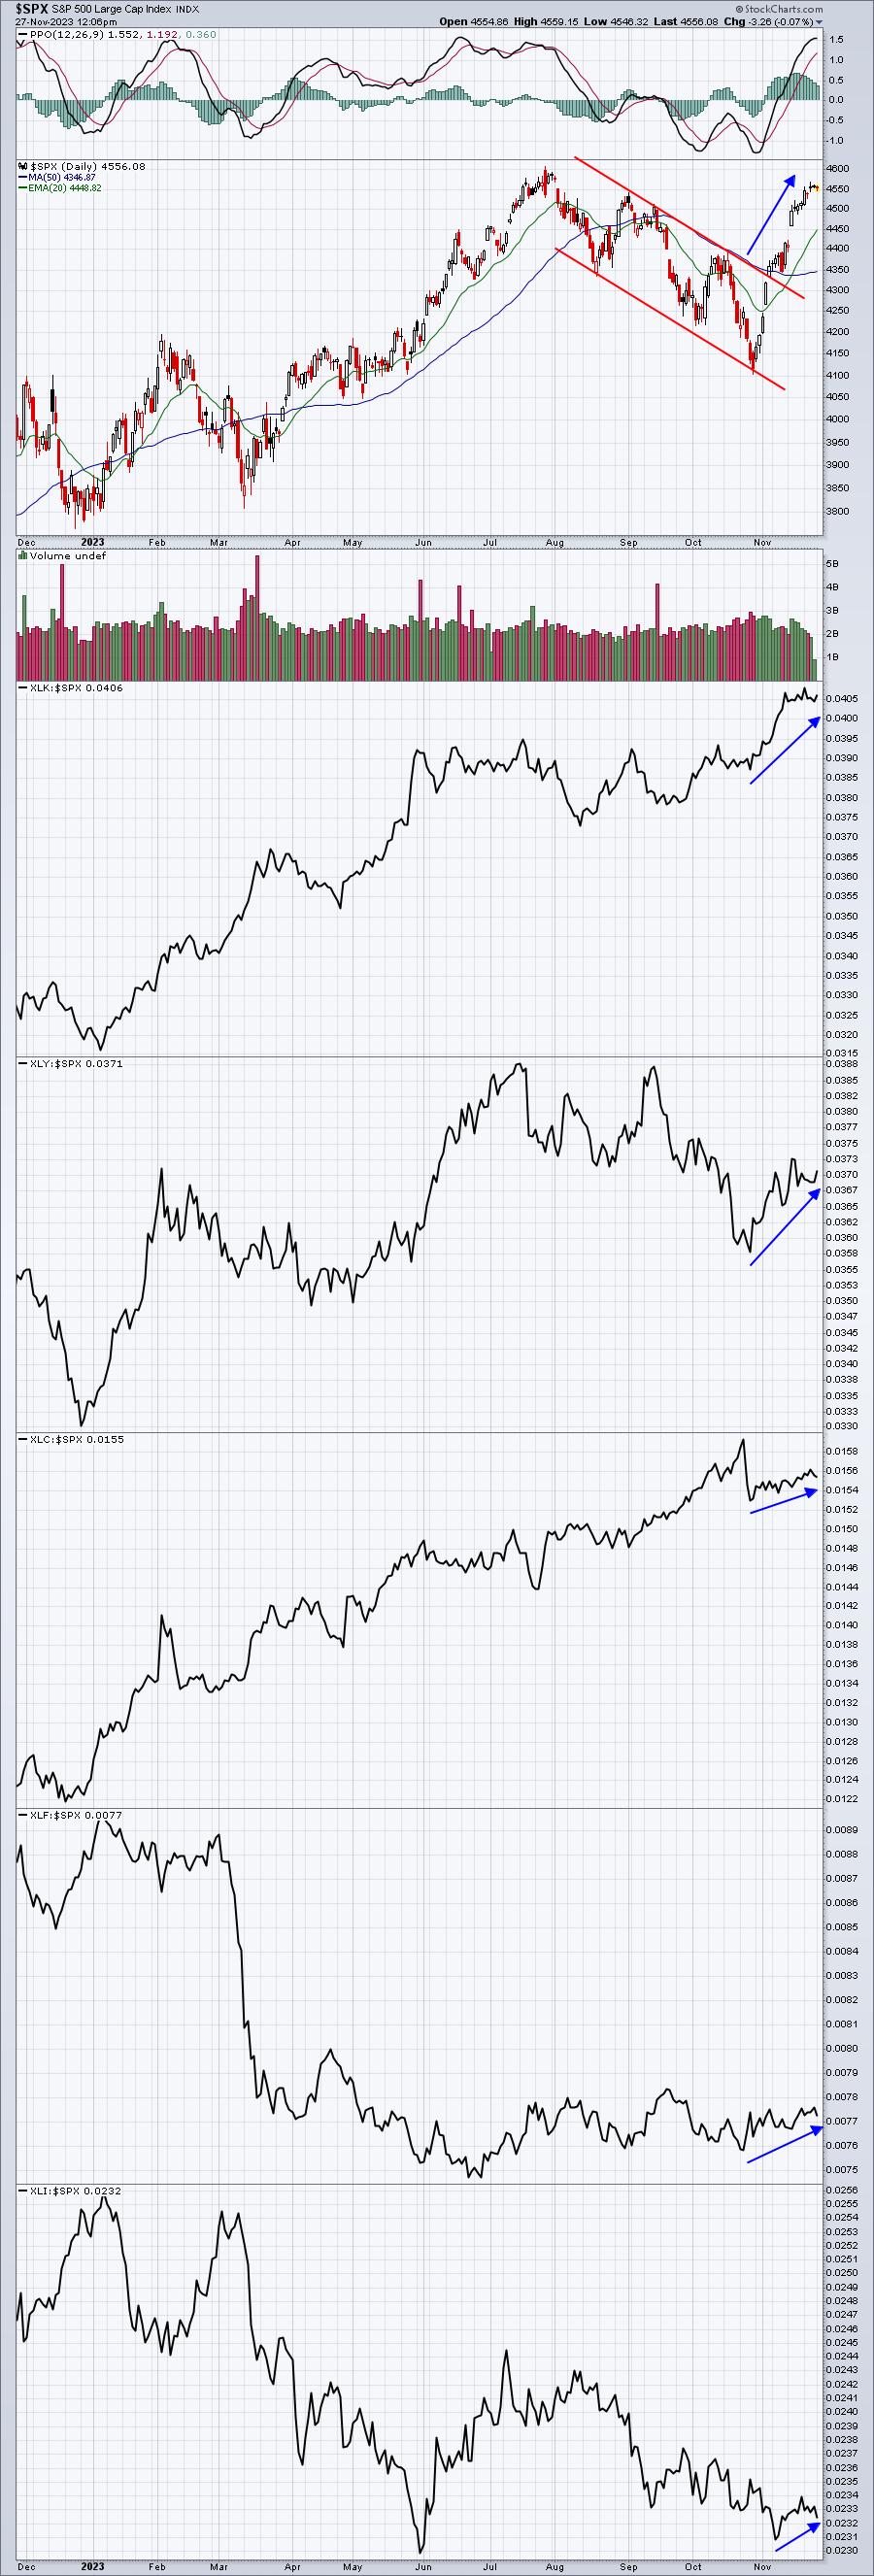
The November breakout from the July through October correction and down channel has been accompanied by money flowing heavily into aggressive sectors. My 3 key aggressive sectors - XLK, XLY, and XLC - have been particularly strong. Wall Street firms are NOT bracing for any kind of meaningful selloff, so nor should we.
I always talk about perspective. Here's another S&P 500 chart, this one a 15-year weekly chart that highlights the history of 3 different rates of change (ROC) in the bottom panels - 13-week ROC, 26-week ROC, and 52-week ROC. While many market "experts" have said this market has run too far too fast, I completely disagree. If we step back away from just November performance, these 3 ROCs visually show us that the current bullish, if anything, has more room to the upside. Check it out:
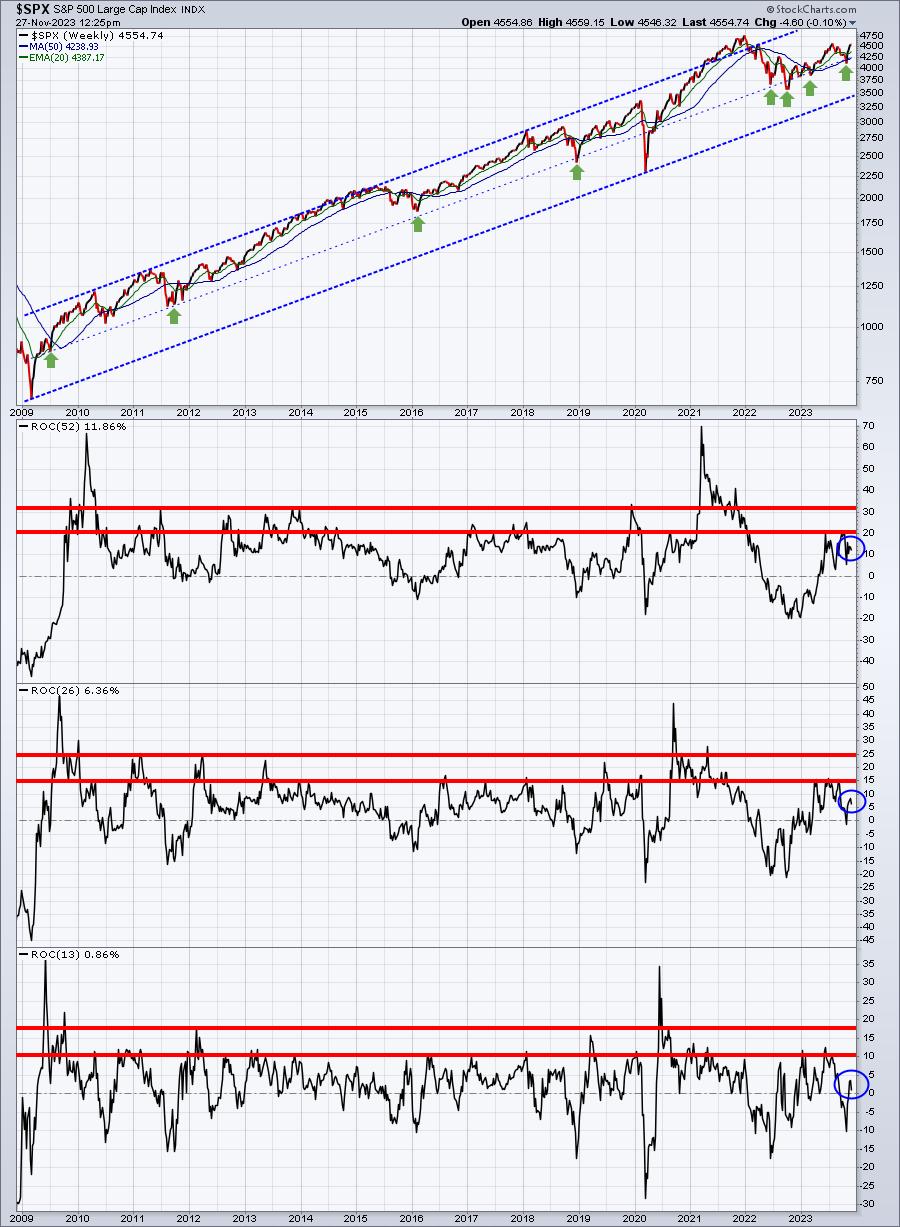
If you didn't believe we were in a solid uptrend, I hope the above chart puts that to rest. We've had two major lows in 2009 and 2020. When you connect those panicked lows and then "drag" the same sloped line up to connect the highs, you highlight the 15-year up channel that we've enjoyed. Now check out those ROCs in the bottom 3 panels. We've still got room to the upside before we move into a more overbought situation historically. It's why I will remain long, despite short-term overbought conditions on the daily chart.
Sectors
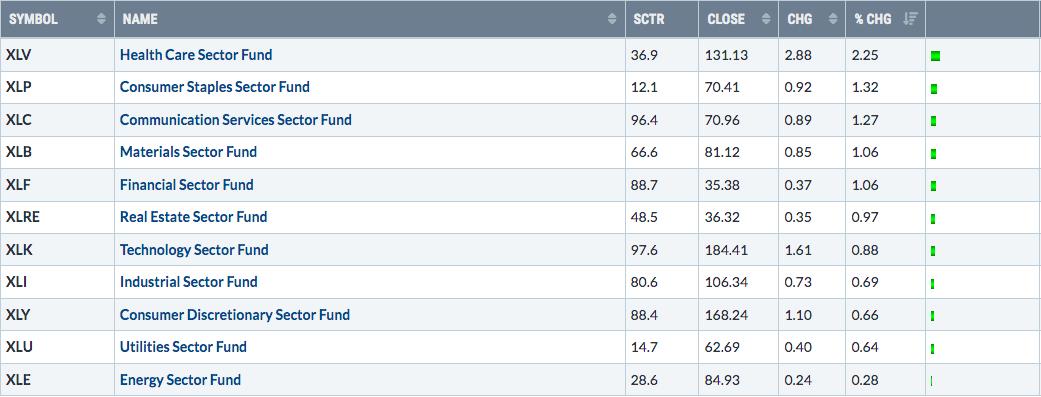
It wasn't exactly a "scream higher" type of advance last week. Any time that we see a more value-oriented upside move, it's a little bit of a "risk off" environment. That's not necessarily a bad thing. Leaders don't lead every day, or even every week or month for that matter. A bull market is a journey, with plenty of ups and downs. I think it's pretty clear that relative strength of our aggressive sectors remains excellent and certainly suggests that this current market rally is sustainable. Check out the relative strength in the S&P 500 chart earlier. Again, I find that strength very bullish in the bigger picture.
Top 10 Industries Last Week
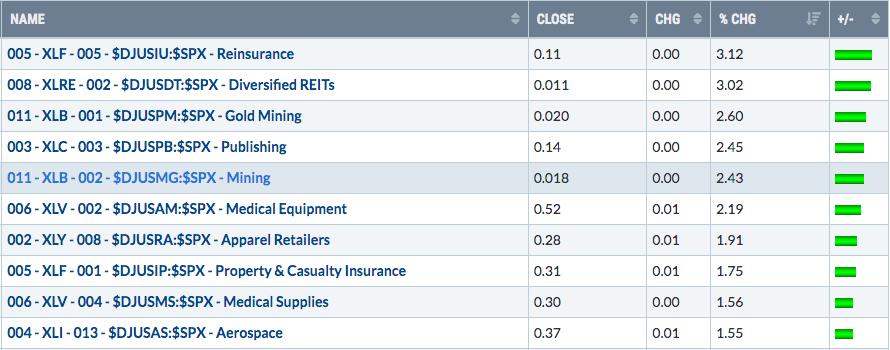
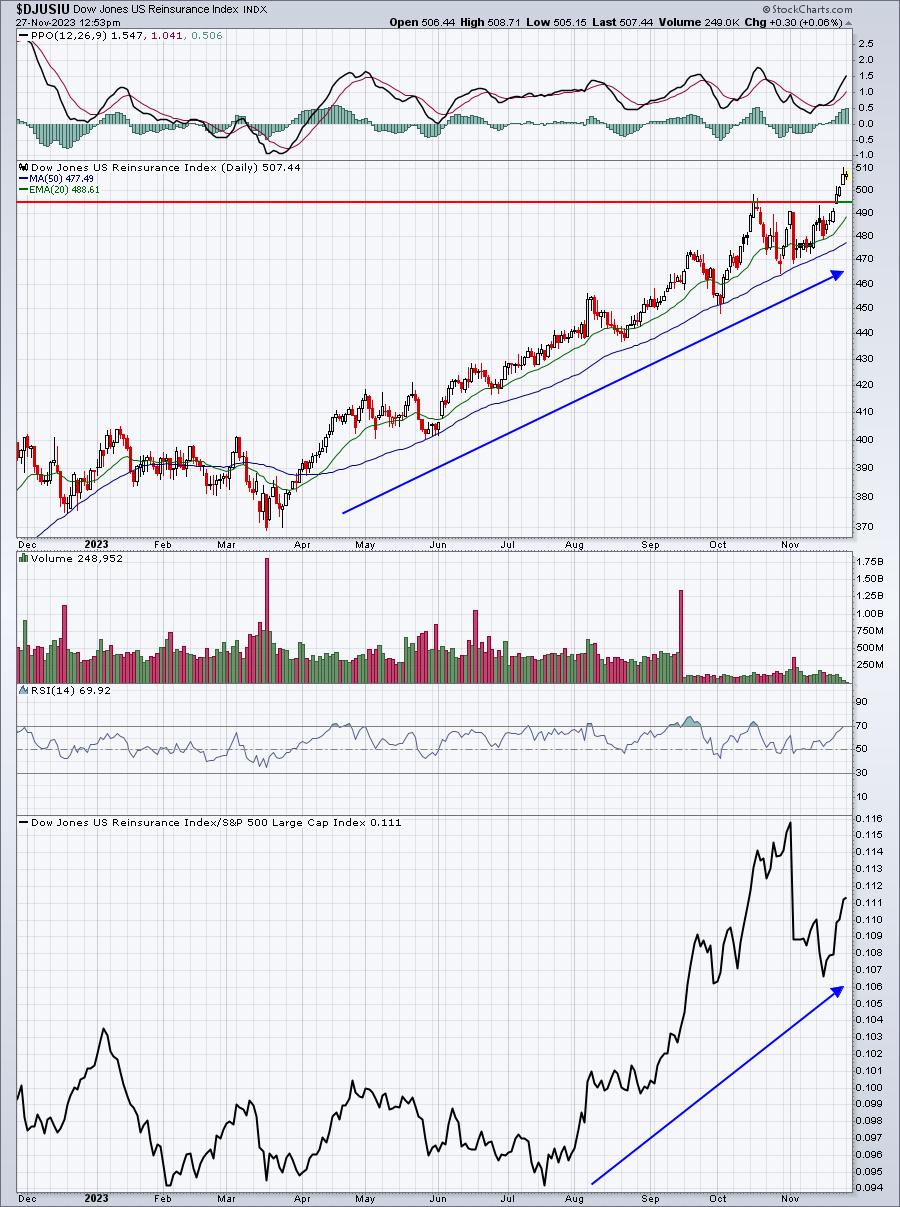
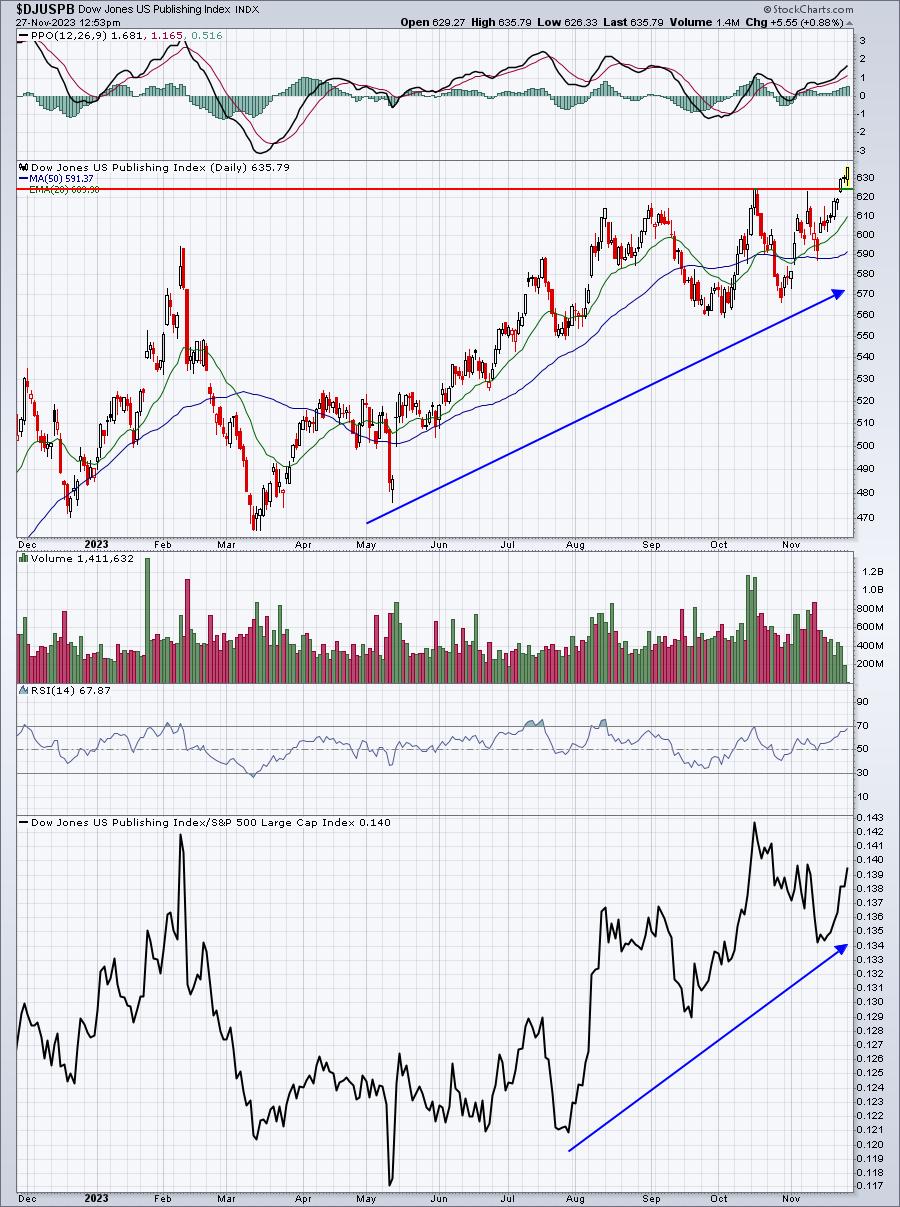
We have 3 key breakouts on this list above. Here are the groups above that have recently printed 2023 highs and are now seeking to become market leaders into year end and, perhaps, beyond:
Reinsurance
Publishing
Property & Casualty
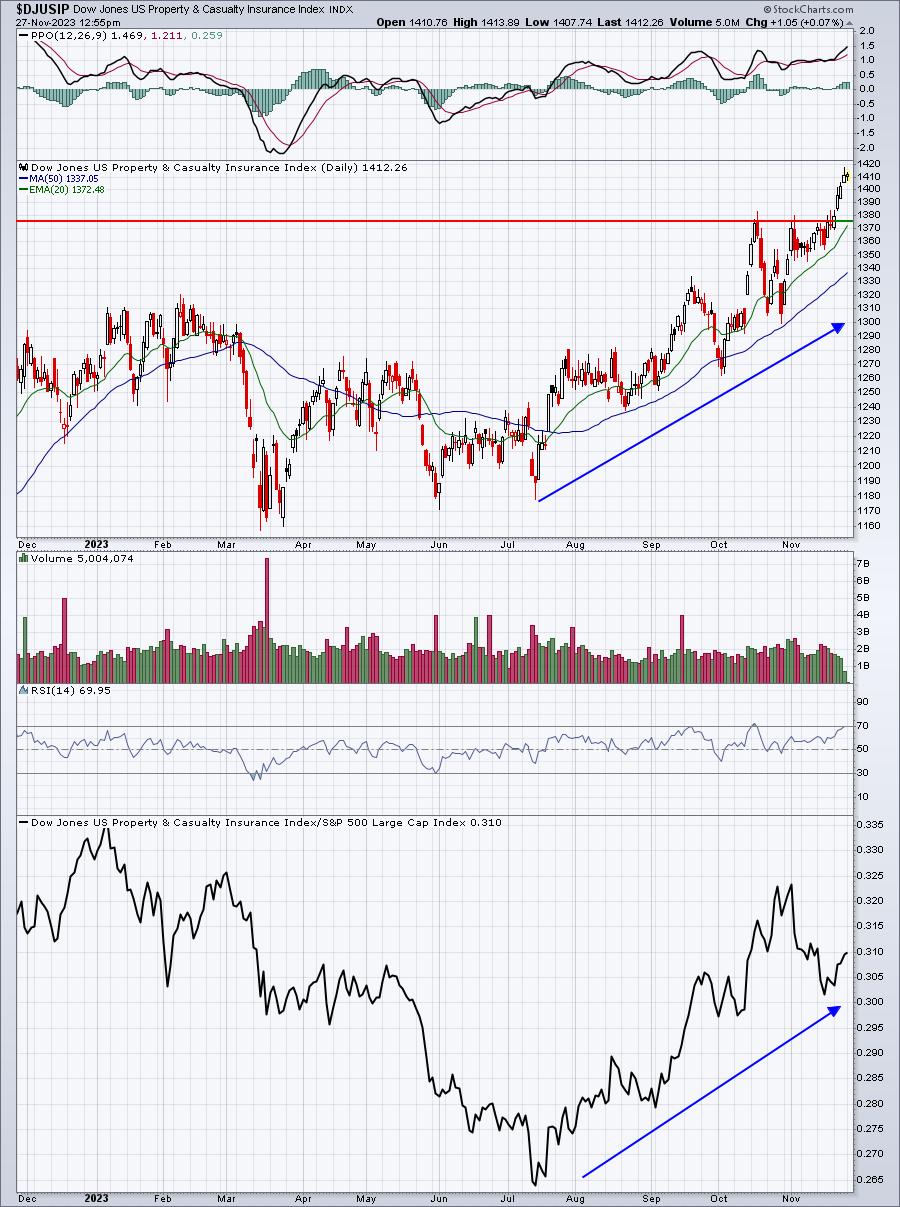
I believe all 3 of these industry groups are safer to place trades in now as they show relative strength vs. the S&P 500.
Bottom 10 Industries Last Week
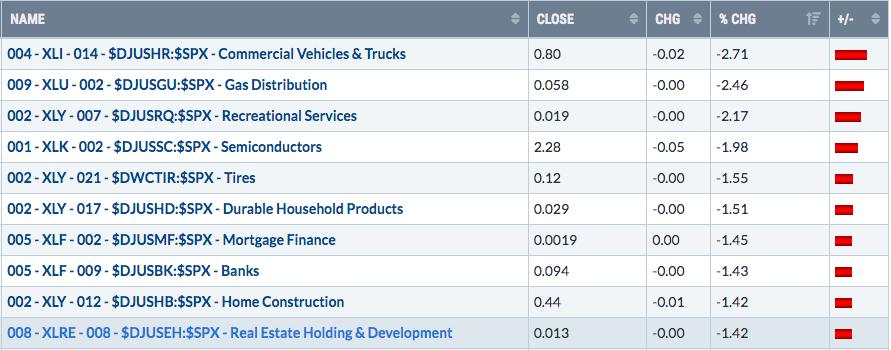
Semiconductors have been strong all year. Home construction has also been strong, but this one is now up against solid price resistance. Eventually, I see a breakout coming, especially given this group's seasonal strength during the winter months. Check out the DJUSHB:
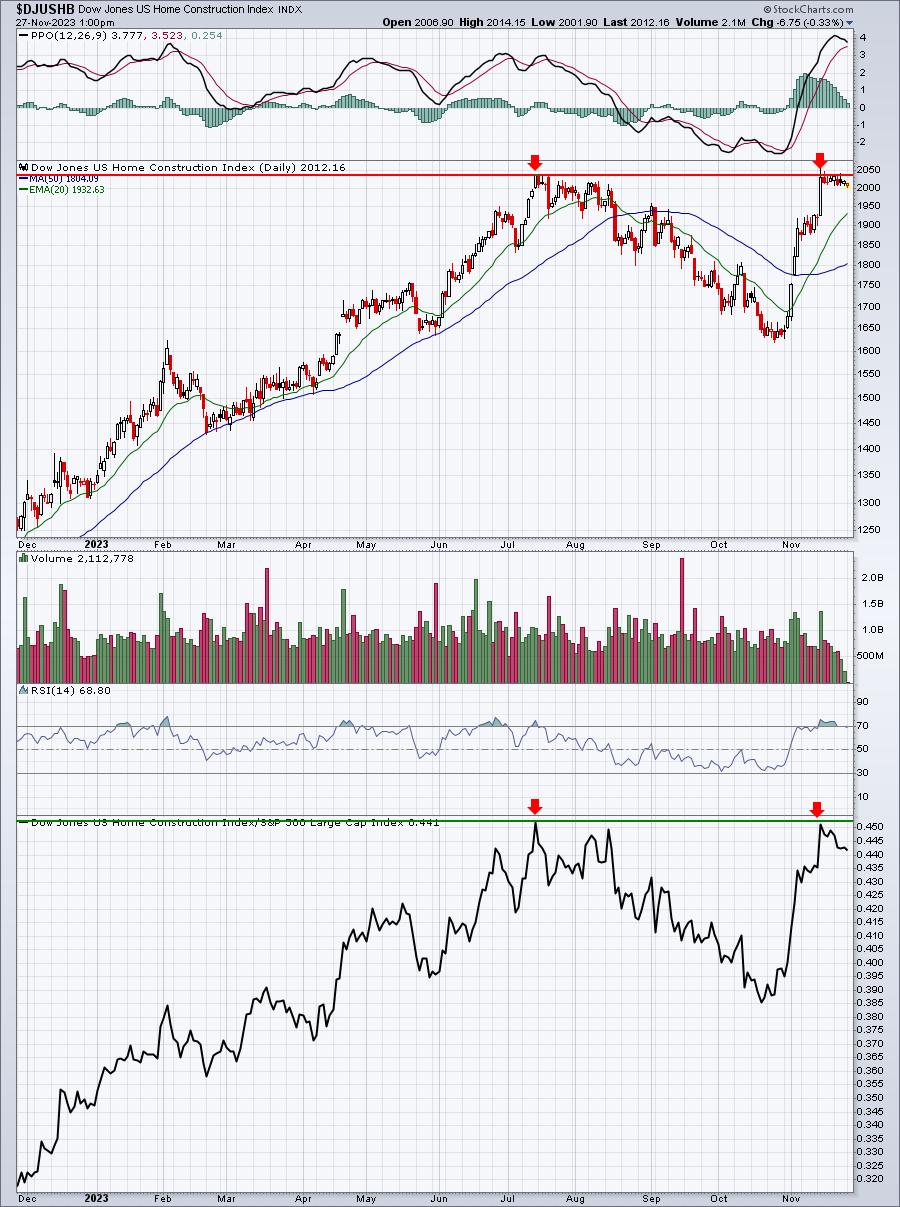
A breakout on both absolute and relative prices would be a strong signal heading into this bullish seasonal pattern:
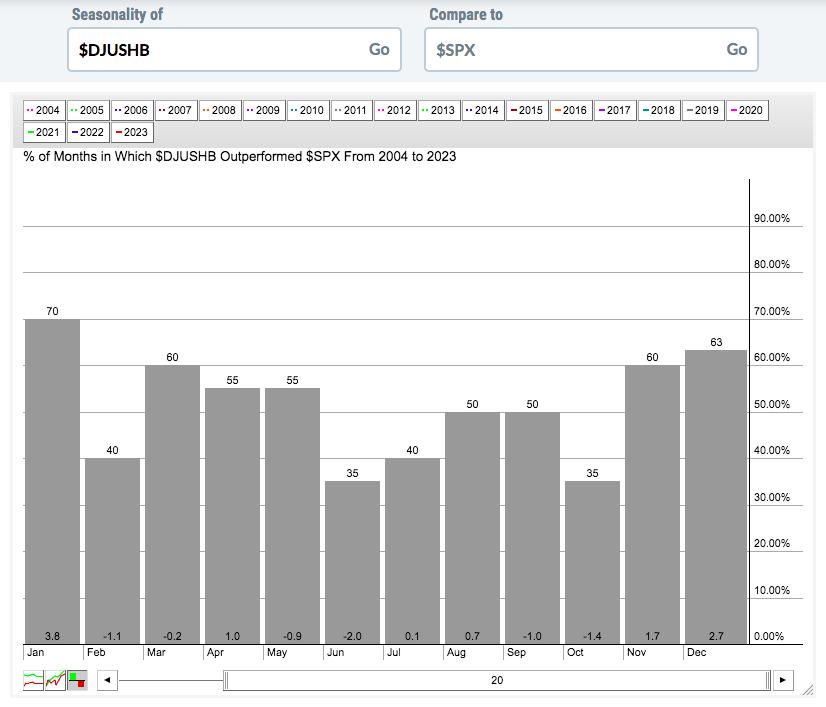
Home construction's best 3-months of relative price action over the last two decades is November, December, and January. Respect a breakout.
Top 10 Stocks - S&P 500/NASDAQ 100
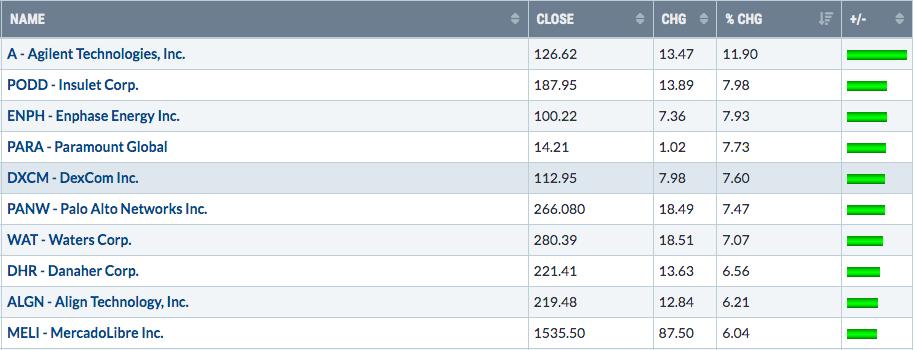
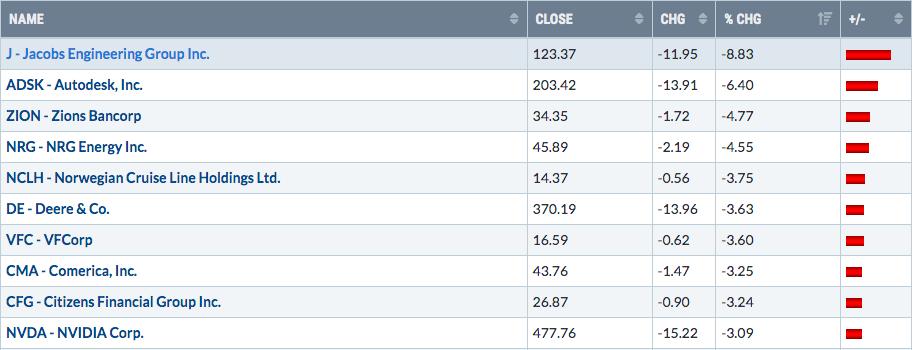
Bottom 10 Stocks - S&P 500/NASDAQ 100
Big Picture
We're still awaiting our next S&P 500 breakout at the 4600 level, but that level really has little meaning on this 100-year Big Picture chart:
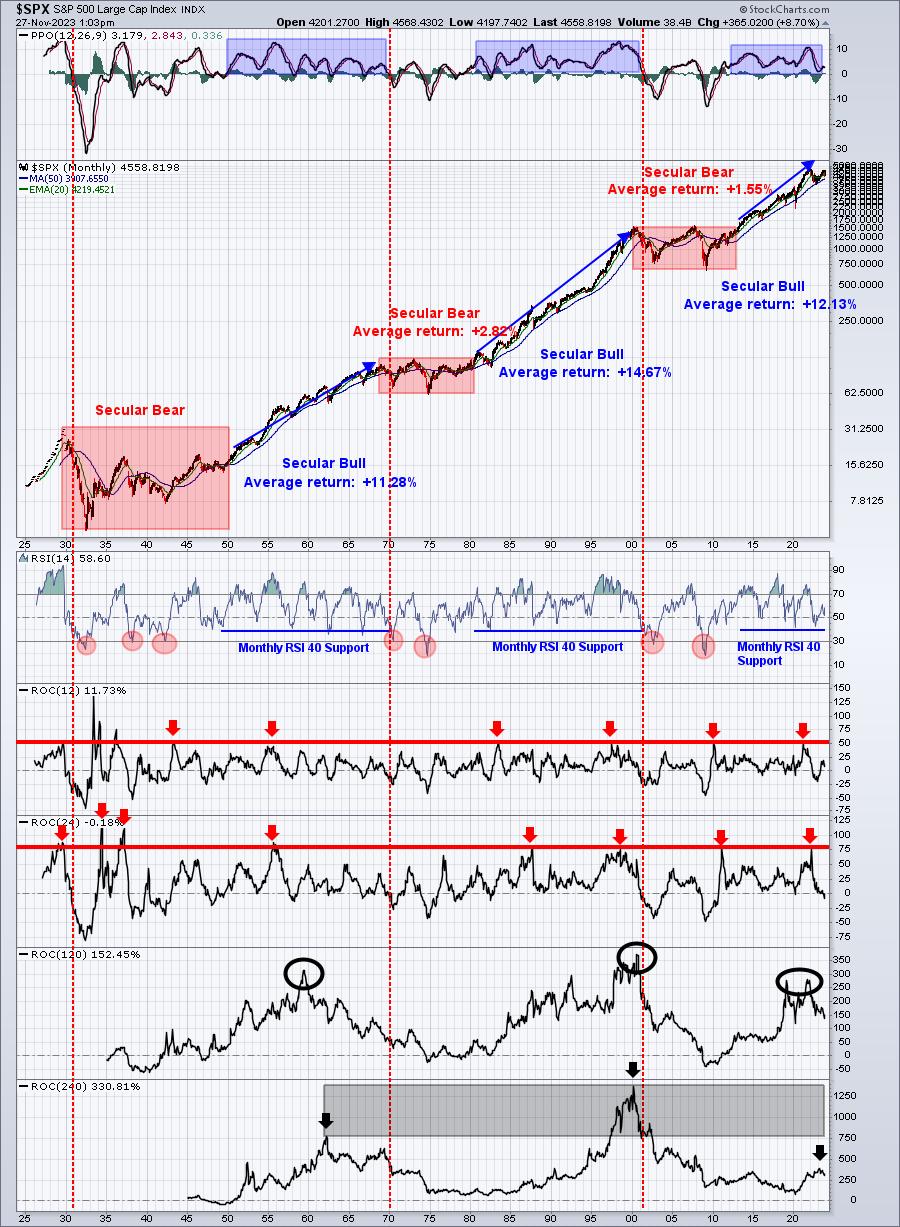
It's interesting that the 2-year rate of change (ROC) on the S&P 500 is currently below zero. If you look at history, we normally see a big spike in this 2-year ROC after falling back to test the zero line. The only exceptions have been during secular bear markets - and I've discussed on many occasions why I don't believe we're in that type of market environment. I believe this bull has MUCH further to run to the upside.
Commodities
I don't trade commodities, but I still pay attention to a few key commodities, because of their historical tendency to positively correlate with the benchmark S&P 500. My two favorites are copper ($COPPER) and crude oil ($WTIC) as they've both shown strong positive correlation with U.S. equities, particularly the S&P 500, over a very long period of time. Let's get an update of both:
Copper
Copper is tied to global economies, much more so than either gold or silver. Copper is used in so many applications that its price is driven mostly by global economic strength. When the price of copper turns lower, it could be telling us something about the global economic environment. While copper is well off its
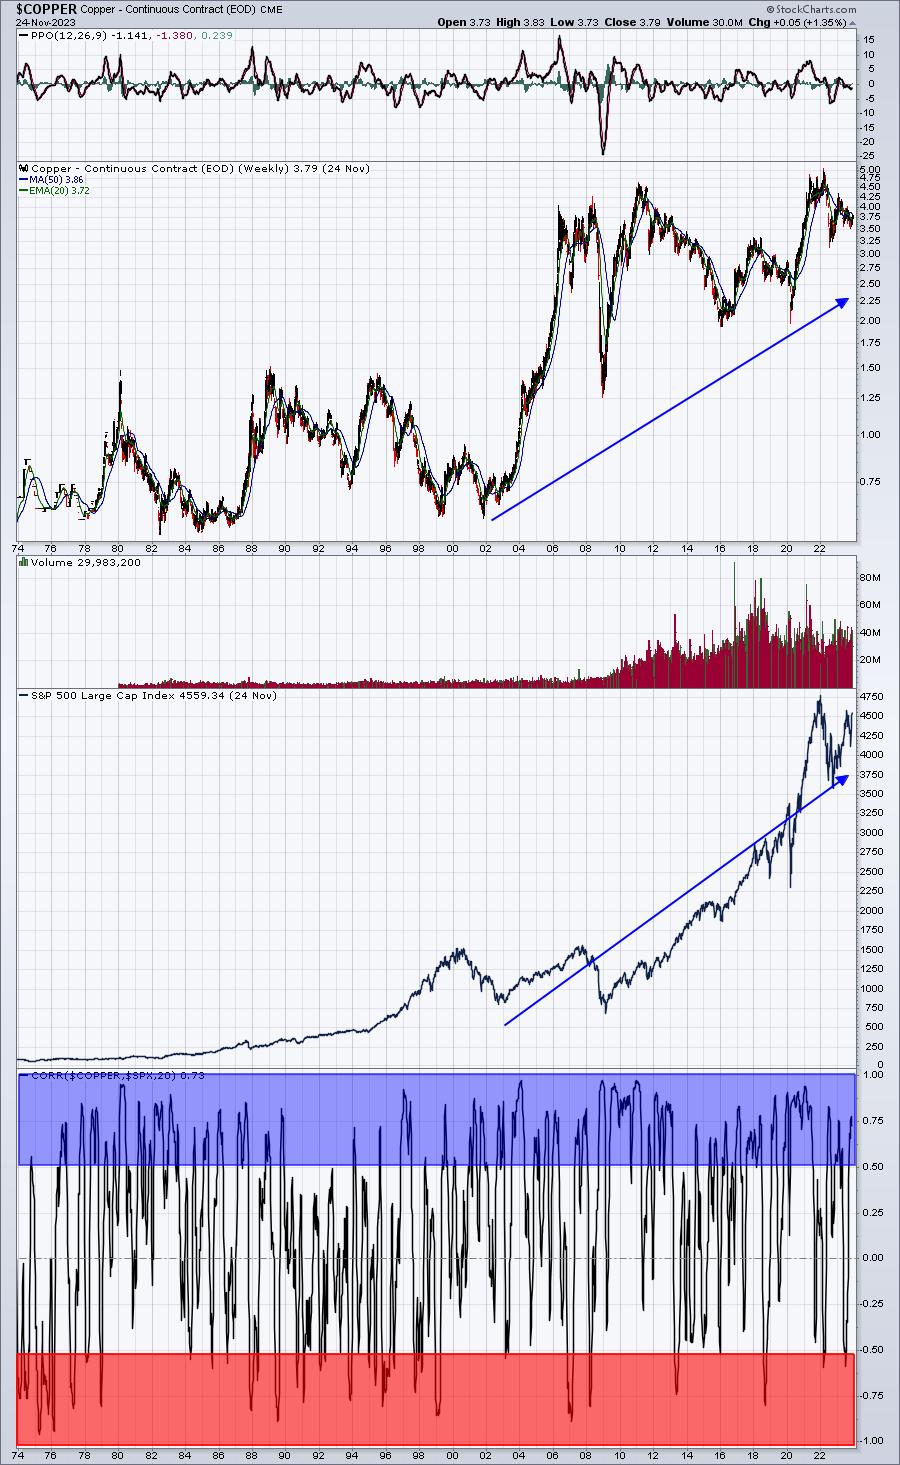
Listen, I wouldn't be trying to call the S&P 500 direction based solely on the daily fluctuations of copper prices. But the blue-shaded area above shows us the very strong positive correlation between copper prices and the S&P 500. We also see these two inversely correlated plenty of times, but this 50-year chart gives me a sense that these two travel hand in hand much more than opposite one another. So I typically construe rising copper prices as a bullish signal for U.S. (and global) equities.
Crude oil
Now check out the same chart for crude oil prices:
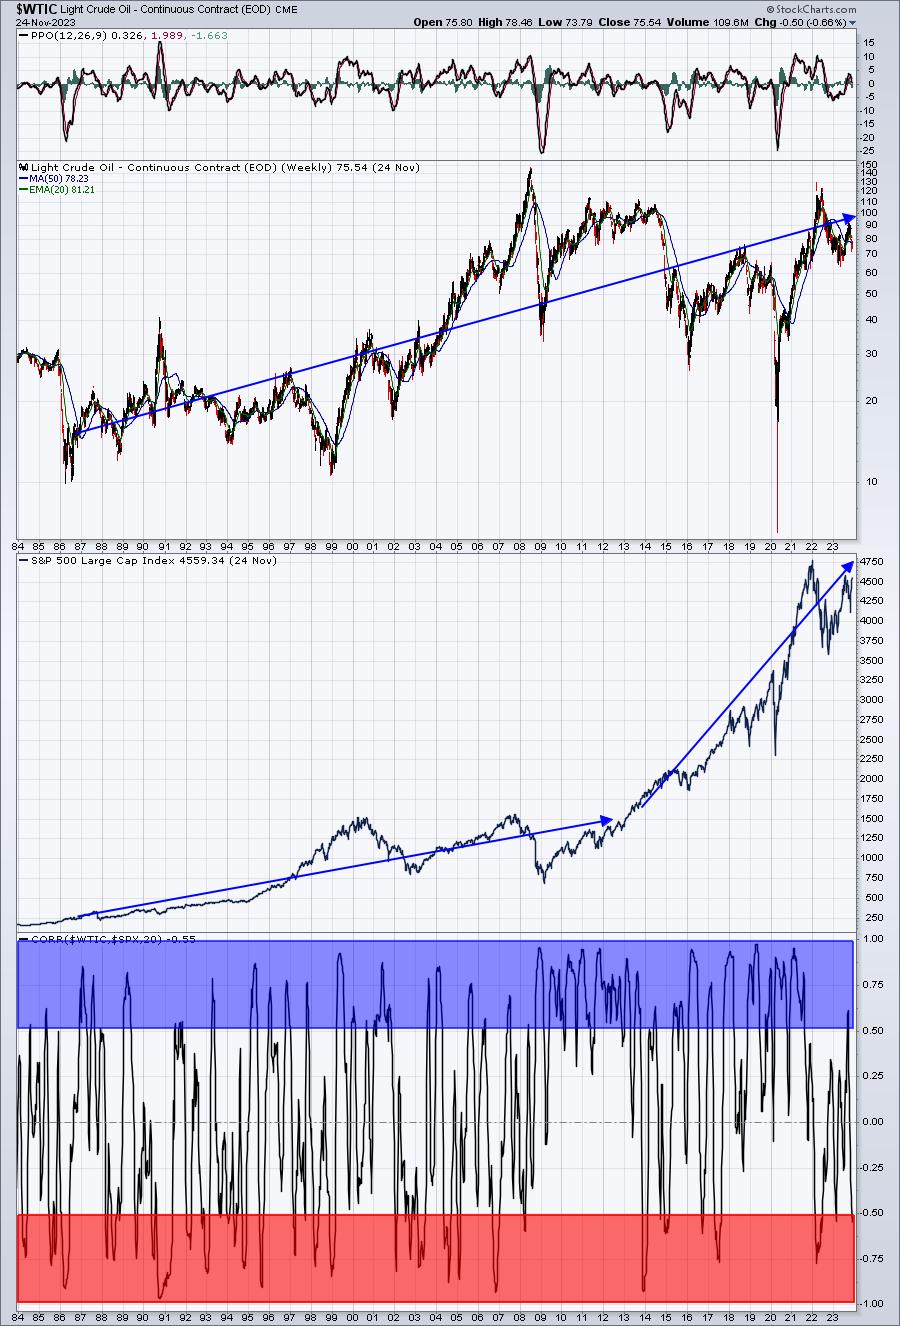
The correlation seems to be more evenly distributed here during the 1980s and 1990s. But since the turn of the century, and especially the last 15 years, there's been much stronger positive correlation between the direction of crude prices and that of the S&P 500. I wouldn't expect perfect correlation by any stretch, because geopolitical events can have MAJOR impacts on crude oil prices, yet barely affect the S&P 500 at all - other than the energy names, which represent a very small percentage of the S&P 500.
But if we are only looking at supply and demand based on normal economic behavior, it makes good common sense to me that oil prices would go up from higher demand during strong economic periods and that same economic strength would send the S&P 500 higher as well.
Trade Setup
I didn't find a potential long-term trade setup that really stood out to me this weekend, so let's check back in here next week.
Looking Ahead
Upcoming Earnings:
The following earnings reports (market cap in parenthesis) are, in my opinion, at least relatively significant and worth watching. This is NOT a list of ALL companies reporting this week, so please be sure to check for earnings of any companies that you own or add:
- Monday: ZS ($28 billion)
- Tuesday: INTU ($158 billion), WDAY ($61 billion), CRWD ($50 billion)
- Wednesday: CRM ($218 billion) SNOW ($56 billion), DLTR ($25 billion)
- Thursday: RY ($122 billion), TD ($110 billion), MRVL ($48 billion)
- Friday: None
Key Economic Reports:
- Monday: New home sales
- Tuesday: Case-Shiller HPI, FHFA HPI, consumer confidence
- Wednesday: GDP (2nd estimate)
- Thursday: Initial jobless claims, personal income and spending, Chicago PMI, pending home sales
- Friday: PMI manufacturing, ISM manufacturing, construction spending
Historical Data
I'm a true stock market historian. I am absolutely PASSIONATE about studying stock market history to provide us more clues about likely stock market direction and potential sectors/industries/stocks to trade. While I don't use history as a primary indicator, I'm always very aware of it as a secondary indicator. I love it when history lines up with my technical signals, providing me much more confidence to make particular trades.
Each week, I'll provide you the average annualized returns for each calendar day and by index. Here are the historical numbers for this week:
S&P 500
- November 27: +55.22%
- November 28: +32.11%
- November 29: +6.03%
- November 30: +18.47%
- December 1: +13.15%
NASDAQ
- November 27: +71.41%
- November 28: +57.18%
- November 29: -2.91%
- November 30: -20.29%
- December 1: +53.89%
Russell 2000
- November 27: +28.95%
- November 28: +72.16%
- November 29: +38.77%
- November 30: +44.22%
- December 1: -39.02%
The S&P 500 data dates back to 1950, while the NASDAQ and Russell 2000 information date back to 1971 and 1987, respectively.
We are now in the most bullish period of the calendar year. The close on October 27th through the close on January 18th is THE ABSOLUTE BEST TIME OF THE YEAR FOR U.S. EQUITIES - HISTORICALLY SPEAKING. Last week was an "ok" period for equities, but the upcoming week typically sees much more historically-bullish action and this bullishness extends through the first week of December.
Final Thoughts
It's hard to believe December and the end of another year is rapidly approaching. As we put finishing touches on November this week, I'll be thinking about the following:
- Historical bullishness should not be ignored. 73 years of data on the S&P 500 tell us that NOW is the best time of the calendar year to be bullish and to be long. Fight this historical bullishness at your own risk
- The 10-year treasury yield ($TNX) remains below key technical overhead yield resistance at roughly 4.55%
- The performance of key aggressive sectors during this November thrust higher suggests this rally is FAR from over
- Earnings reports are definitely slowing down, but we'll still see a number of mid-tier technology companies reporting their latest numbers
- Small caps (IWM) haven't been able to "get over the hump", but the next week to 10 days is a very strong historical period for this asset class, so I'll continue to watch the group very closely
- Defensive sectors do tend to perform best in December; don't be too disappointed if technology and other areas take a temporary back seat to the value-oriented dividend-payers
Feedback
If you'd like to share your thoughts on our Weekly Market Report, positive or negative, you can reach us at "[email protected]".
Happy trading!
Tom