
EB Monthly Seasonality Report - December 2025
A Look Back At November Stocks:
Last month, we released our list of the Top 20 large cap stocks (plus 11 small cap stocks) that had strong historical track records during the month of November. Here are how they performed in November 2025, in order of best to worst performer:
Large Caps:
- CZR: +15.77%
- EPAM: +14.35%
- PH: +11.50%
- FICO: +8.82%
- KEYS: +8.19%
- DECK: +8.01%
- ROK: +7.47%
- CFG: +6.35%
- PODD: +4.53%
- SYF: +4.43%
- MTD: +4.27%
- BKNG: -3.40%
- MRVL: -4.63%
- TSLA: -5.78%
- SHOP: -8.75%
- XYZ: -12.04%
- NVDA: -12.59%
- AMD: -15.07%
- ANET: -17.13%
- ZS: -24.05%
Small Caps:
- COLL: +29.67%
- XNCR: +17.74%
- KRYS: +10.37%
- IBP: +7.97%
- SBH: +4.96%
- BOOT: +2.20%
- CENX: +1.18%
- TGTX: -4.37%
- PENG: -9.16%
- ICHR: -25.93%
- AOSL: -27.73%
The percentages represent the returns from the October 31st close to the November 30th close. The average performance of all 20 large cap stocks (-0.49%) was mostly inline with our major indices. Collectively, our November seasonal large cap group trailed the S&P 500 (+0.19%), but outperformed the NASDAQ 100 (QQQ, -1.56%). The average performance of all 11 small cap stocks (+0.63%) also was inline with the small cap Russell 2000 (IWM, +1.02%). There were certainly plenty of stocks above that followed their historical norms and advanced nicely. But there were other equally-disappointing November results that offset those strong stocks. Semiconductor stocks ($DJUSSC, -5.83%) had a very unusual and rough November, and many of the poor performers on our list are semiconductors, including NVDA, AMD, ICHR, and AOSL.
S&P 500 December Performance
The annualized performance of the S&P 500 (since 1950) during the month of December is quite solid from a long-term 75-year perspective as the S&P 500 has closed higher in December during 55 of the last 75 years. It hasn't been nearly as bullish over the past 13 years, however, and during the current secular bull market. In fact, December has produced minimal average gains as you can see from this seasonal 13-year chart on the S&P 500:
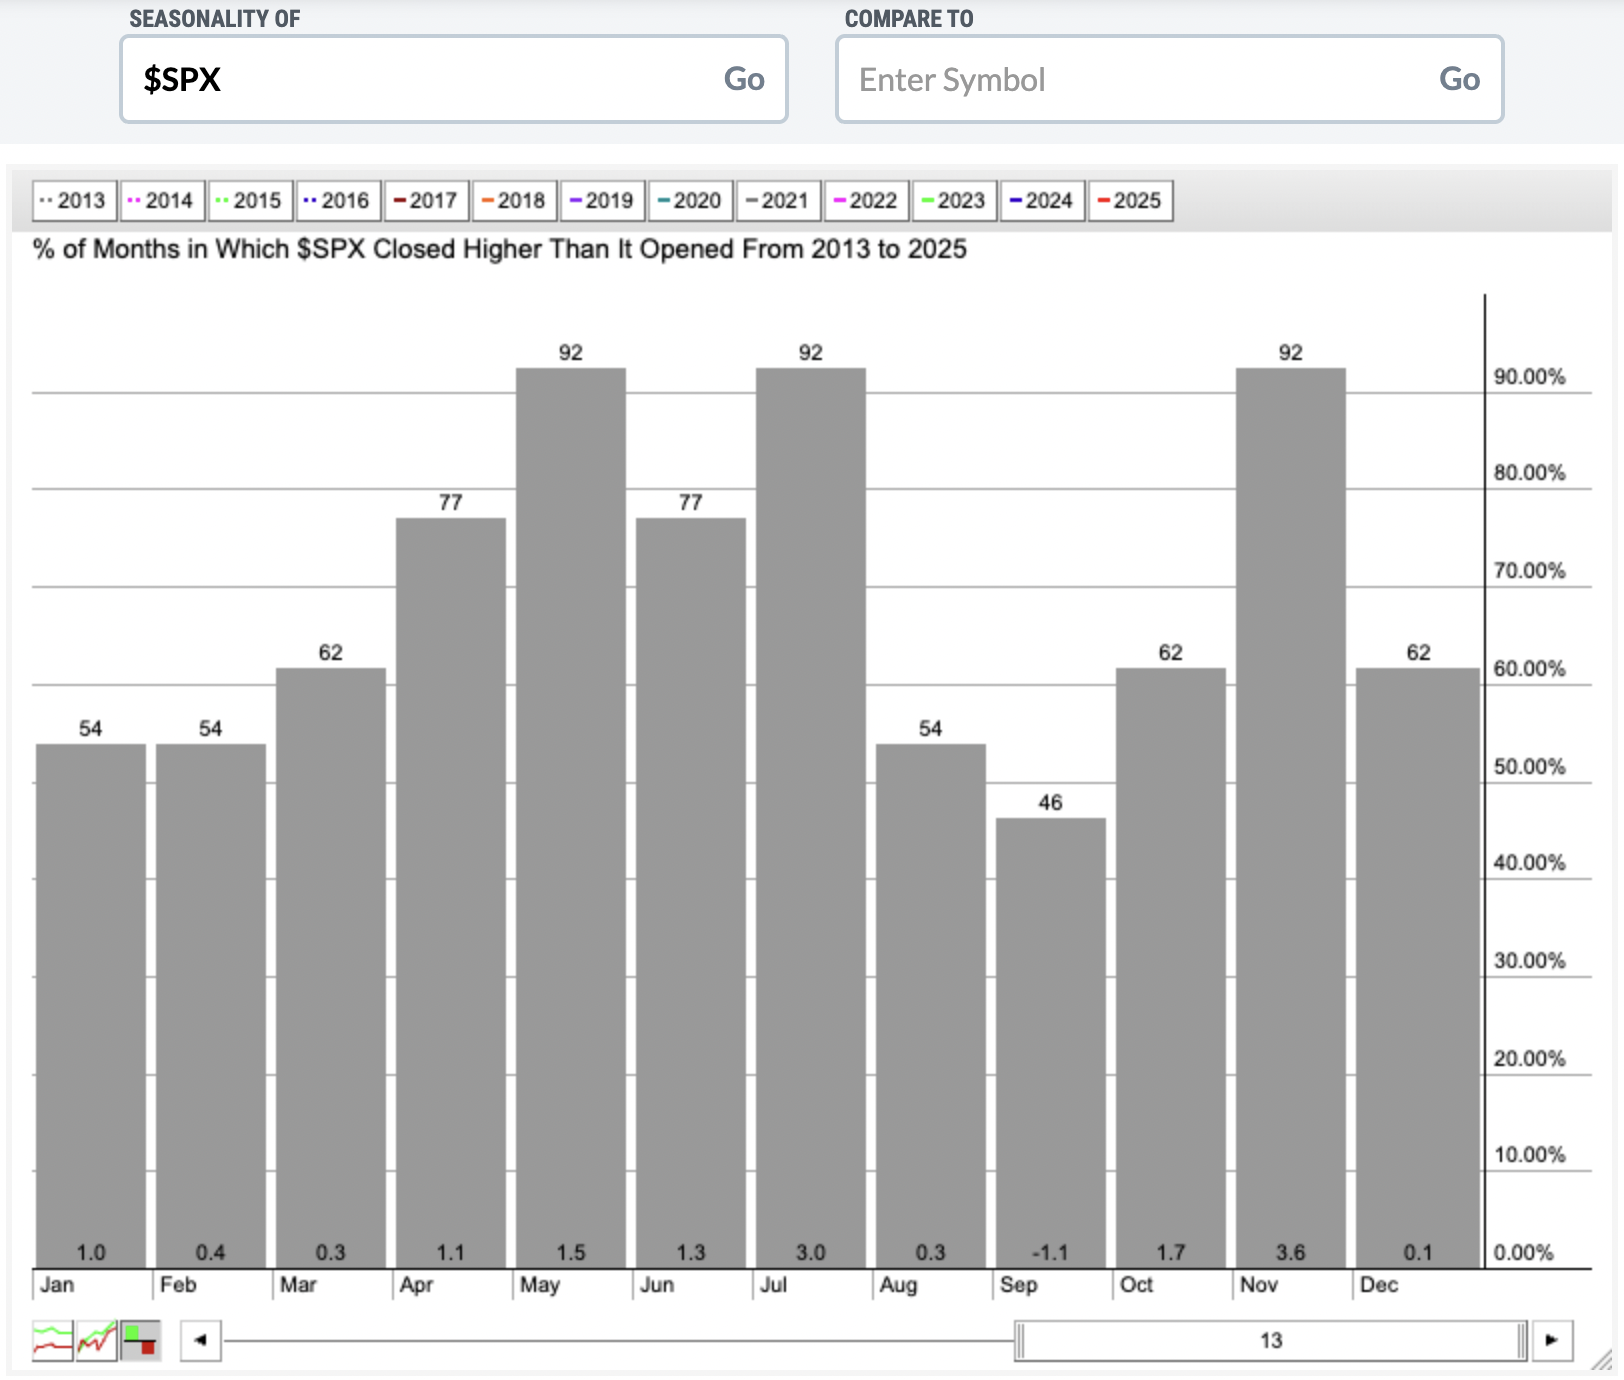
Remember, this is historically the absolute best period of the year to be invested in the S&P 500. The close on October 27th through the close on January 18th is the best 2+ month period, dating back to 1950. It's closed higher than it began 65 of the last 75 years. That's a very strong historical track record. The annualized return of this period is +21.72%, more than double the average annual return of 9% of the S&P 500 over the same 75-year period.
Since 1950, December has produced an annualized return of +17.24% on the S&P 500, which ranks 2nd among all calendar months, trailing only November. During the current secular bull market, though, this annualized return has been just +0.77%, so recent December history has not been as kind. Here's a breakdown of the historically strong and weak performance periods throughout December on the S&P 500 since 1950:
- December 1-8: +19.62%
- December 9-15: -17.12%
- December 16-18: +47.76%
- December 19-20: -17.97%
- December 21-31: +39.61%
I would certainly give a seasonal edge to the bulls, though recent years might want us to weight this "indicator" a bit lighter. I do believe in the "Santa Claus" rally. The dates defining this rally change among market pundits, but I tend to view it as the December 21st through December 31st period, simply based off of history.
Sector Performance
December has typically been a month, at least for the past 13 years, where we've seen relative strength in defensive sectors. Real estate (XLRE), consumer staples (XLP), and utilities (XLU) have been the 3 best relative performers, while energy (XLE) has historically lagged. It's also been fairly normal to see rotation into more defensive sectors in the 2nd half of all calendar quarters, once earnings season is mostly over. I don't expect this December to be all that different, although technology (XLK) did get off to a solid December start last week. It'll be interesting to see if that aggressive group keeps the relative lead throughout the month. It'd be slightly out of the norm.
Real estate looks rather interesting right now from a technical perspective. It's obviously been a relative laggard throughout 2025 as the group has mostly traded sideways throughout the year, while the S&P 500 has trended higher and set new all-time highs. The good news for the XLRE, though, is that it's currently trading fairly close to solid price support. Check this out:
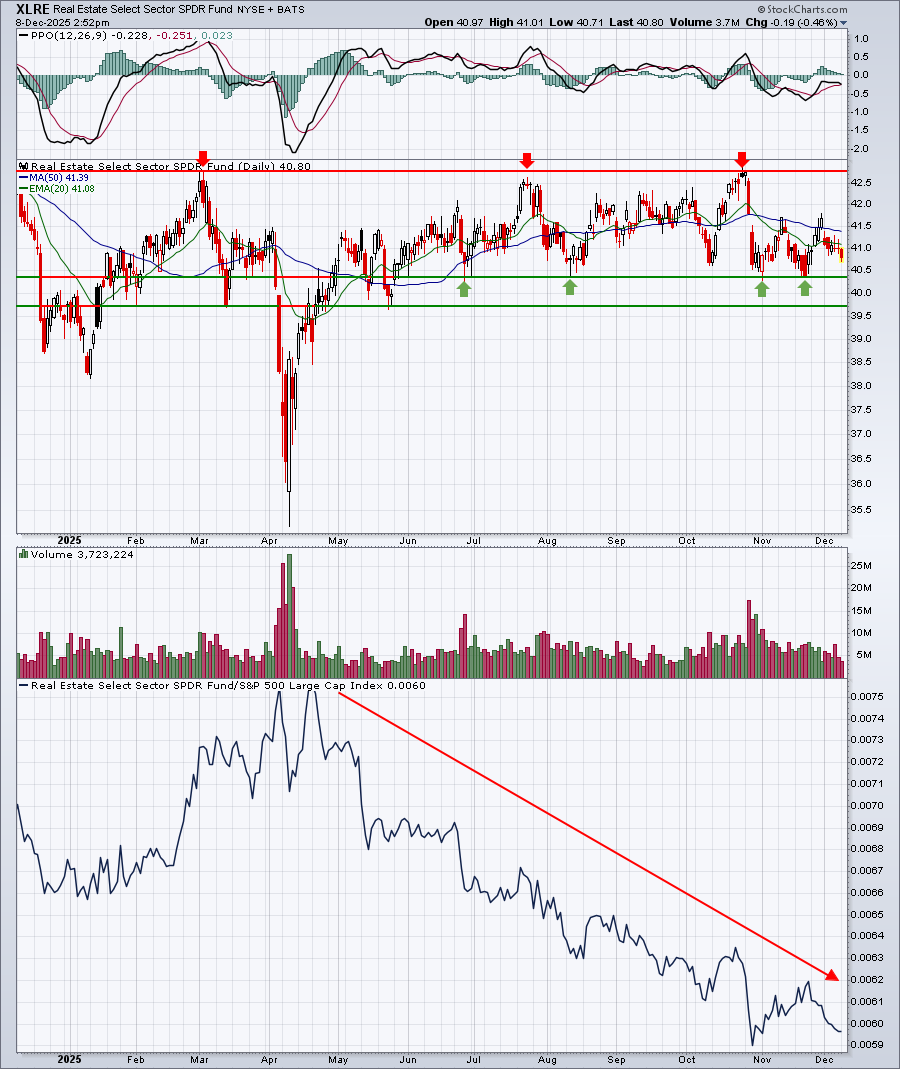
We haven't seen the XLRE close below 40.30 since May. It's tested that level on several occasions since that time, but has bounced successfully each time. With the XLRE currently trading below 41, there isn't a whole lot of downside risk of owning the XLRE at this level and, given its historical December strength, might make sense to be overweighted in portfolios - at least for the very near-term.
Industry Performance
Among the defensive sectors that show historical strength in December, the XLP's personal products industry ($DJUSCM) shows as much relative December strength as any. Technically, the group has begun to show nice absolute and relative strength. So long as its rising 20-day EMA, which just printed a golden cross where it rises above its 50-day SMA, holds as short-term support, I'd expect further strength from this group. There is a bit of overhead price resistance that will need to be negotiated, but a possible reverse head & shoulders could be forming:
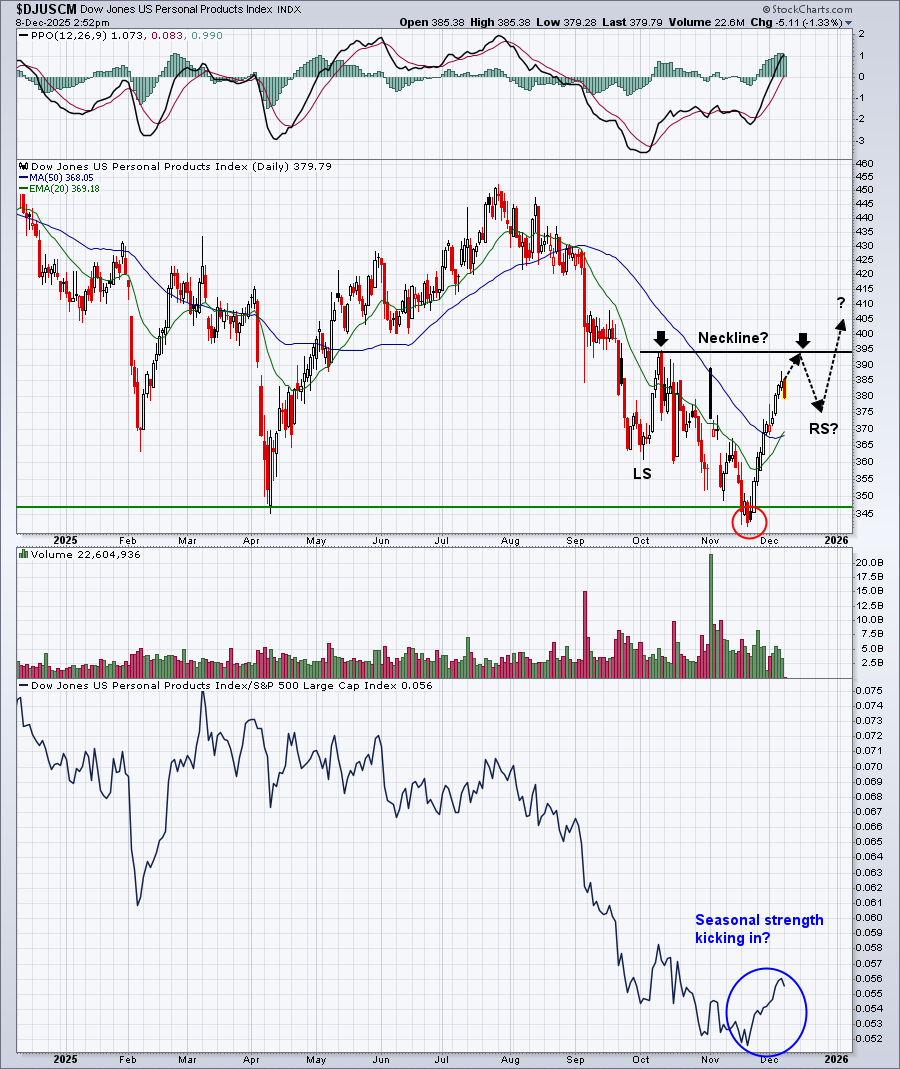
Certainly something to watch over the next few weeks.
Here are all industry groups that tend to perform much better than the benchmark S&P 500 during December, broken down by sector:
Technology (XLK):
- telecom equipment
Consumer Discretionary (XLY):
- recreational services, hotels, furnishings, toys, home improvement retailers
Communication Services (XLC):
- none
Industrials (XLI):
- none
Financials (XLF):
- consumer finance
Health care (XLV):
- pharmaceuticals, medical equipment
Consumer staples (XLP):
- personal products, nondurable household products, food products
Real estate (XLRE):
- real estate holding & development, retail REITs
Utilities (XLU):
- water
Energy (XLE):
- none
Materials (XLB):
- aluminum, gold mining, mining, nonferrous metals
Stocks for December
A "Seasonality - December 2025" ChartList (annotated with 1 or 2 support levels to watch) will be created today and will be added to our website later today.
You must be a StockCharts.com Extra or Pro member to download our ChartLists. Basic members and non-StockCharts.com members can view the charts one at a time.
Happy trading!
Tom