
EB Weekly Market Report - Monday, February 24, 2025
Important - Schedule This Week
Due to family medical issues, I'll be leaving tomorrow morning AFTER our Trading Places Live show and heading for Florida, where I'll be until this weekend most likely. This will impact several of our services as follows:
- No Live Trading Room on Wednesday
- Brief Daily Market Reports
- ChartLists may not be updated until the end of next week, instead of the end of this week
- No Wednesday video recording with StockCharts.com
- No EB Weekly Portfolio Report
- EB Seasonality Report - March may be delayed a day or two into early next week
I should be back in my office and all services should be back to normal next week. Thanks in advance for your understanding.
ChartLists Updated
The following ChartLists were updated over the weekend:
- Strong Earnings (SECL)
- Strong Future Earnings (SFECL)
- Raised Guidance (RGCL)
- Bullish Trifecta (BTCL)
- Upcoming Earnings
- Upcoming Earnings - Relative Strength
These ChartLists are available to download into your StockCharts Extra or Pro account, if you have a StockCharts membership. Otherwise, we can send you an Excel file with the stocks included in these ChartLists in order to download them into other platforms. If you have any questions, please reach out to us at "[email protected]".
Weekly Market Recap
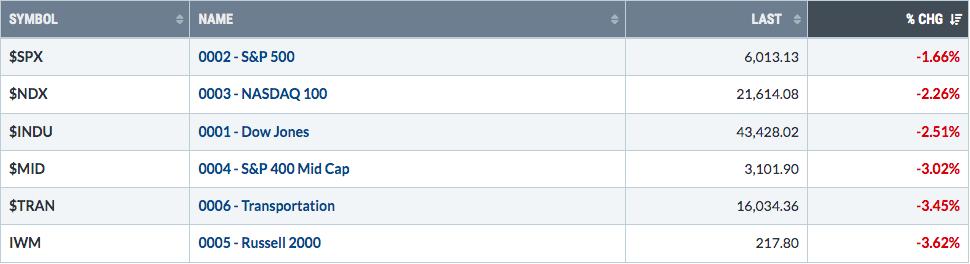
Major Indices
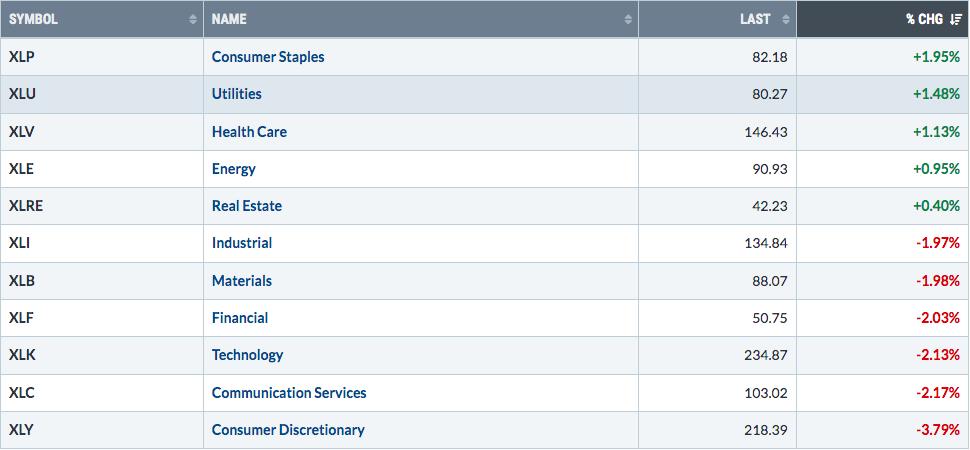
Sectors
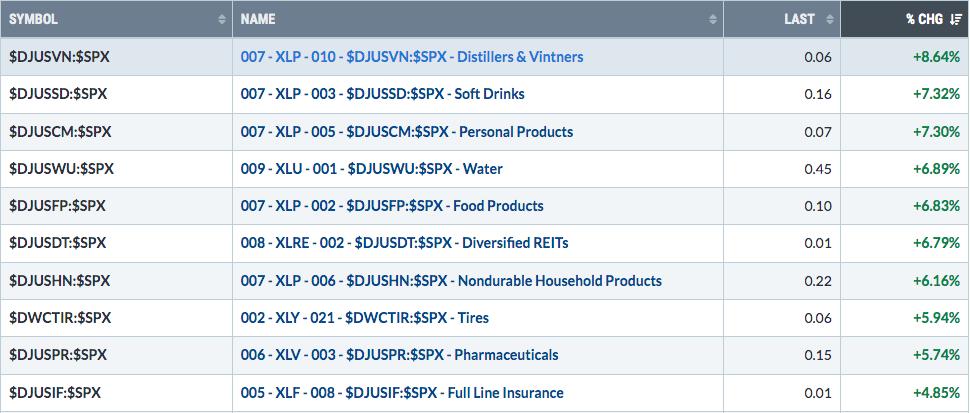
Top 10 Industries Last Week
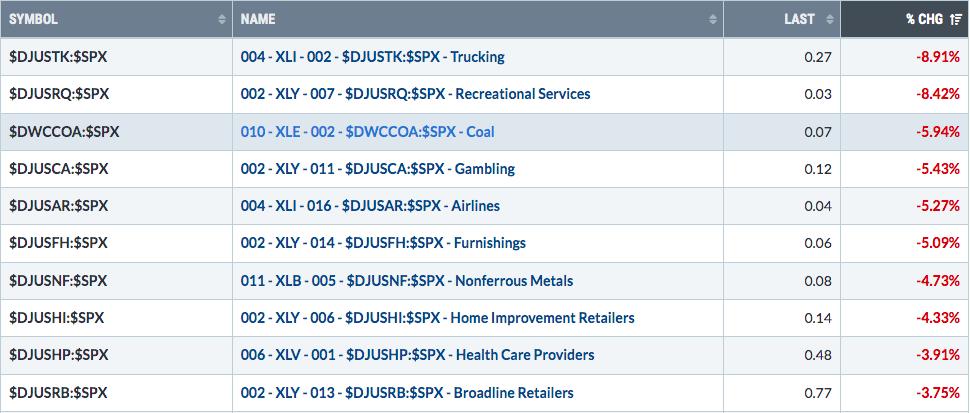
Bottom 10 Industries Last Week
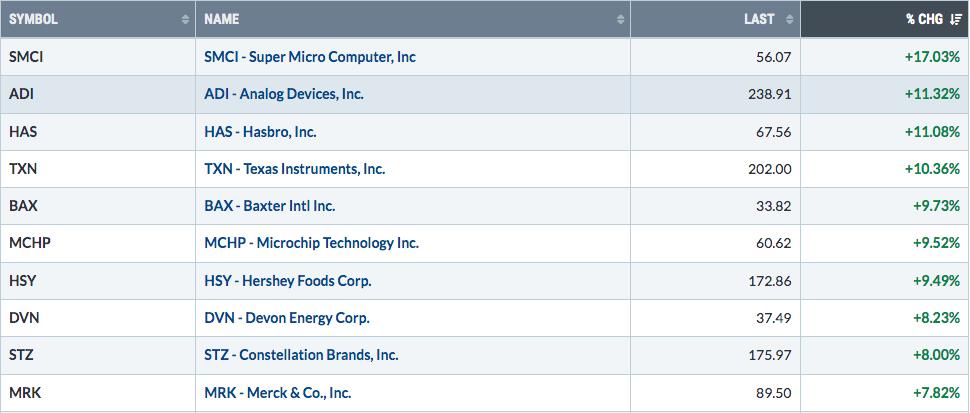
Top 10 Stocks - S&P 500/NASDAQ 100
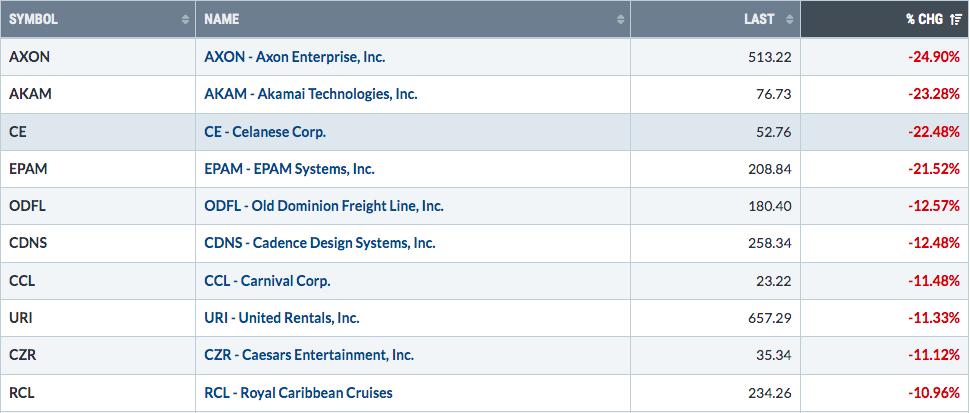
Bottom 10 Stocks - S&P 500/NASDAQ 100
Big Picture
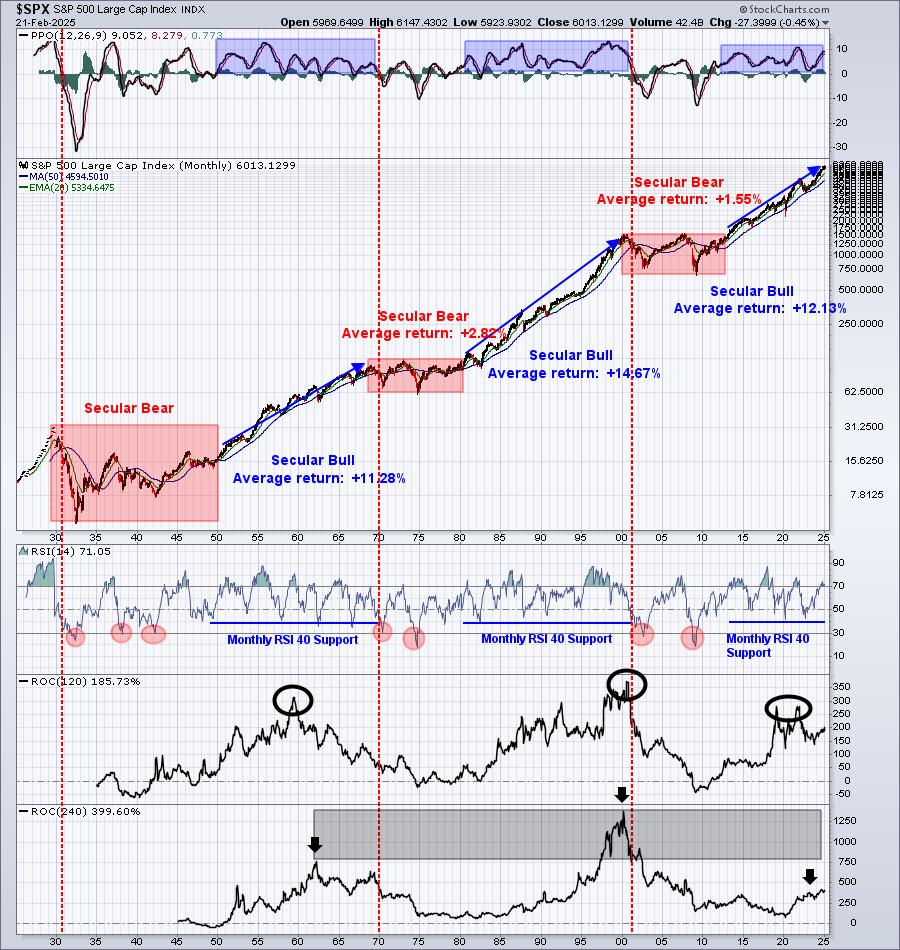
I've discussed plenty of warning signs in recent weeks and we saw some rather significant technical damage at the end of last week, especially among consumer stocks. None of that really shows up here on this Big Picture chart of the S&P 500, however. And I honestly don't expect to see a long period of selling and/or consolidation. That's why I've suggested that those in the stock market for the long-term consider just sitting on their hands. At this point, nothing has really changed my view that the S&P 500 will be at or near all-time highs when we close out 2025. I do, however, recognize the increased short-term market risks.
Sustainability Ratios
Here's the latest look at our key intraday ratios as we follow where the money is traveling on an INTRADAY basis (ignoring gaps):
QQQ:SPY
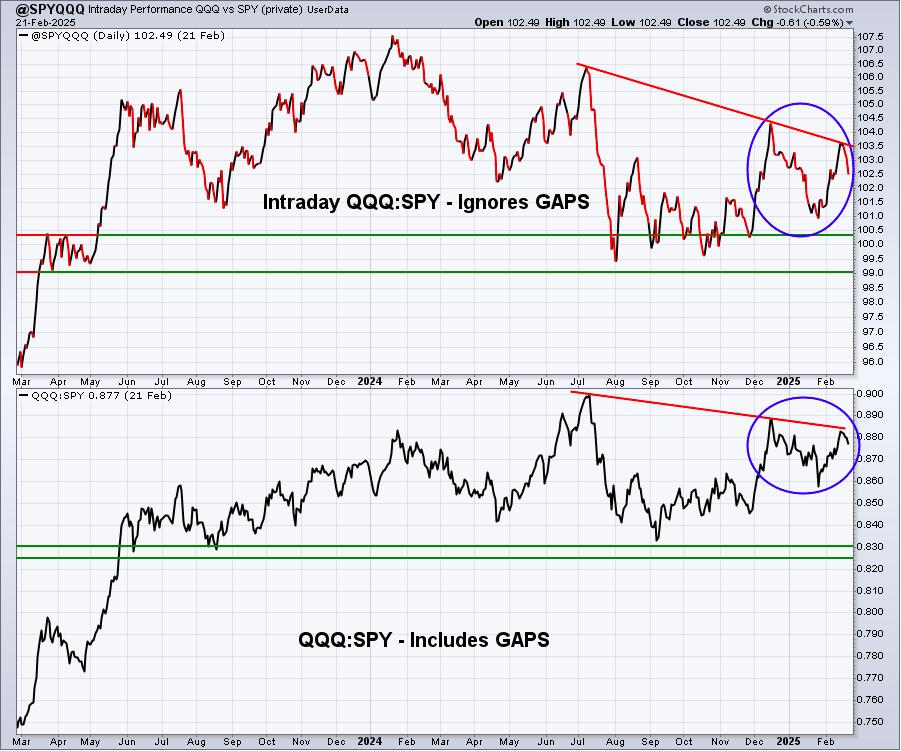
Well, I talked last week about needing to break the relative downtrends shown above in order to sustain the recent S&P 500 advance. Instead, we turned lower at this key relative resistance, which certainly aided the bears in the late-week selloff. Now the opposite is true. A further drop in this relative strength line would add to short-term bearishness.
IWM:QQQ
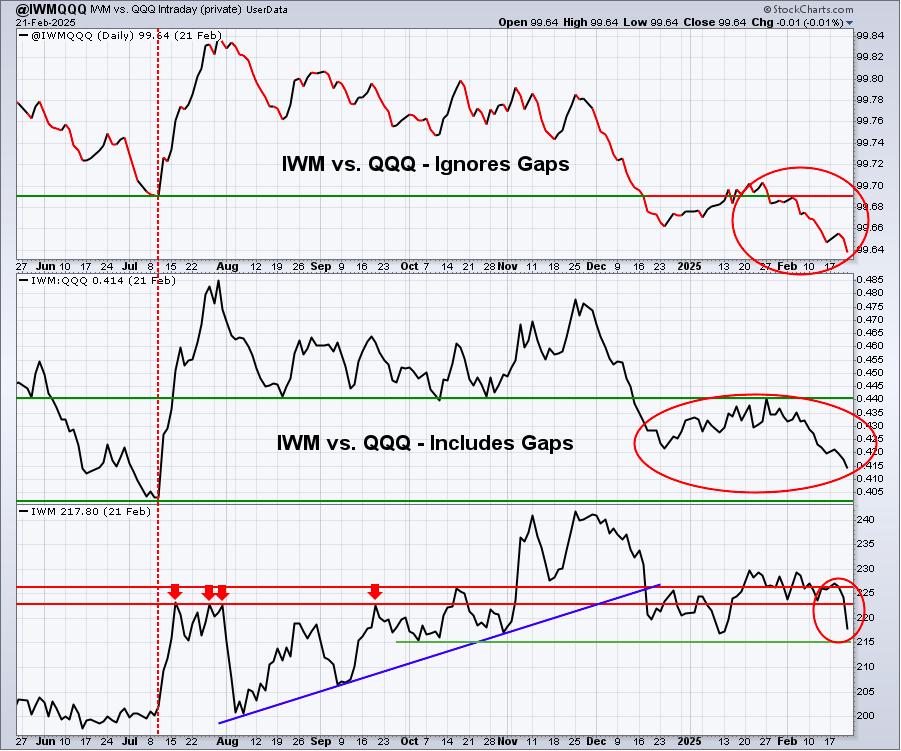
The IWM is approaching a very important intermediate-term low in the 214-215 range. It actually reached a low this morning of 215.16, before reversing to 218.01 at last check. We have not seen a close on the IWM below 214 since mid-September 2024, so it would be a big deal to close beneath this level.
XLY:XLP
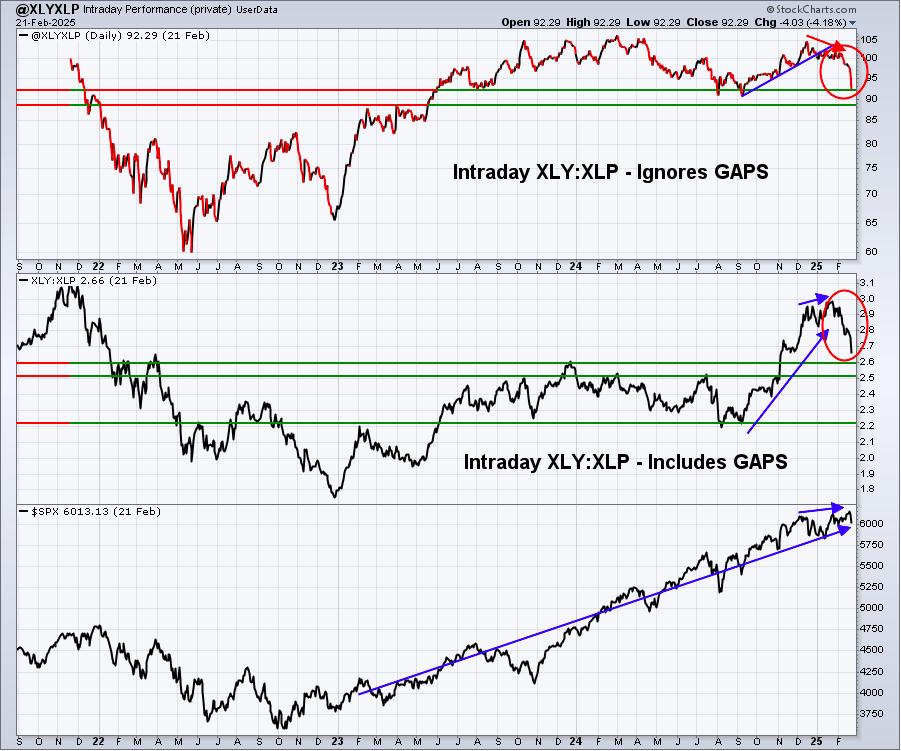
Last week I said, "This is one of my biggest caution signals as we enter the much-less-bullish 2nd half of Q1 (Feb 16-Mar 31)." And then the XLY:XLP went out last week and turned much more significantly to the downside. Folks, this is a problem that bears watching closely. The primary reasons why we'd see this ratio turn so decidedly negative are either (1) a potentially weak economy ahead, or (2) another surge in inflation. I'm not seeing signs in the bond market to confirm the latter. So I believe Wall Street is firing warning shots at the Fed, indicating the potential of a weakening economy ahead and the importance to get back on the rate-cutting campaign. Small cap performance aligns with this message as well.
Keep in mind that the best economic indicator of all is the U.S. stock market. When the stock market turns lower, it provides the Fed one more signal of economic activity.
Sentiment
5-day SMA ($CPCE)
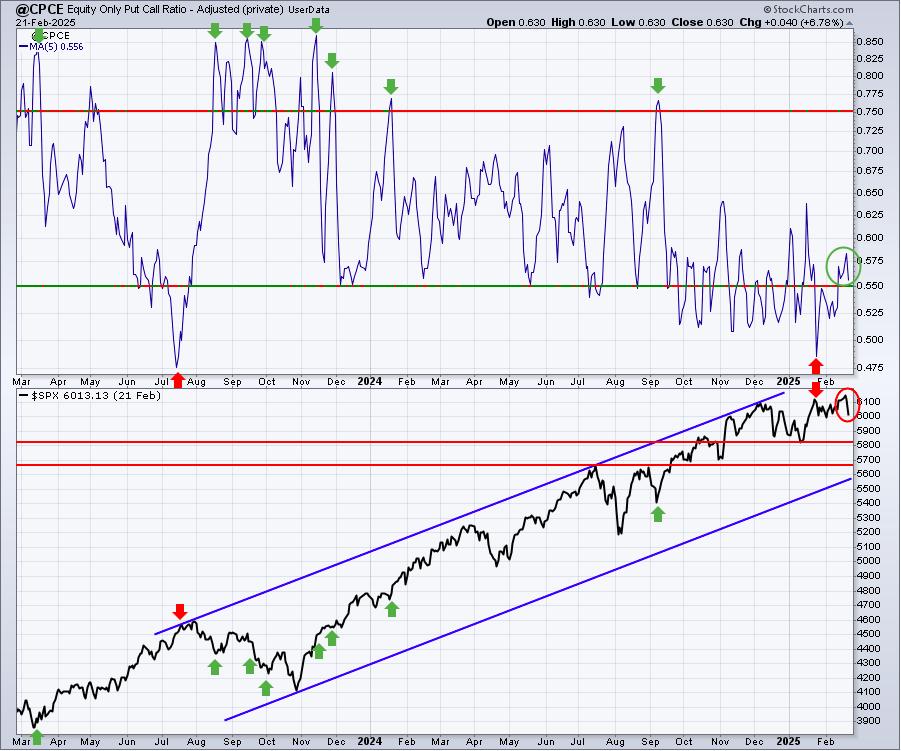
Sentiment indicators are contrarian indicators. When they show extreme bullishness, we need to be a bit cautious and when they show extreme pessimism, it could be time to become much more aggressive. Major market bottoms are carved out when pessimism is at its absolute highest level.
We may just be beginning to pay the price for the consistent bullishness in options since mid-September 2024. It wouldn't be a bad thing from a longer-term perspective to see the S&P 500 take a big hit over the next 3-5 weeks to turn the sentiment from bullish to bearish, or at least some bearishness (5-day CPCE reading moving higher to touch the .75 level). Nothing guarantees us of a predetermined market move, but hopefully you can see how multiple bearish signals are coming together right now. As the number of bearish signals grows, the risks of remaining on the long side increase and that's why I've been discussing the need for traders to remain in cash or at least consider trading fewer shares and/or exiting at the close to reduce risk.
We've had members write in and ask us to make the above chart clearer - in terms of what's bullish and what's bearish. Keep in mind that I usually highlight bullish developments with green and bearish developments with red. For instance, when the 5-day SMA of the CPCE moves above .75, that means retail options traders are bearish. But since that is a contrarian indicator, it actually means bearish options traders are bullish for the stock market. Hence, I use green arrows to highlight (1) the high CPCE readings, and (2) corresponding market bottoms. Complacent, or bullish, CPCE readings are identified with red arrows to highlight (1) the low CPCE readings, and (2) corresponding market tops.
I hope this helps to clarify sentiment a bit.
253-day SMA ($CPCE)
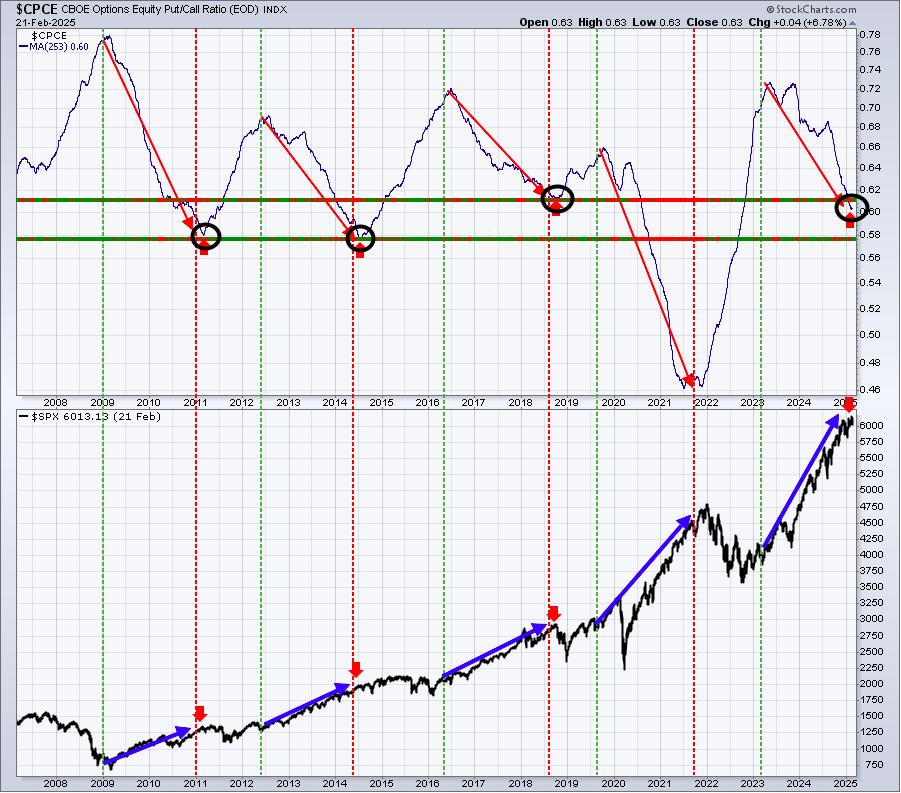
Are we topping? Well, bottoms in the 253-day SMA of the CPCE have typically coincided with market tops and 3 of the last 4 bottoms in this 253-day SMA (black circles) have occurred between 0.58 and 0.62. We're at 0.60 right now, so this long-term signal also could be lining up with the many short-term signals I've discussed in this report and in prior reports/shows.
Volatility ($VIX)
Volatility is another sentiment signal, except this is one that market makers provide us. Market makers determine the premium on options based upon expected volatility in the short-term, typically over the next 30 days. When the pricing of these premiums is high, market makers are suggesting to us that we should expect much bigger swings in the S&P 500. Higher volatility is also associated with bearish market environments. Accordingly, we should not ignore the fact that the VIX is now in the 17-20 range, because readings in this range generally correlate to less bullish, or even bearish, action. I wrote an article a while back at StockCharts that explains what we should expect from the S&P 500 when the VIX is in certain ranges. Click on the following article link to learn more:
"What Are The Chances Of A Market Crash? This Indicators Says ZERO!"
A VIX move above 20 can lead to impulsive selling and large gap downs in our major indices. I like to use the analogy that ugly storm clouds on the horizon are increasing the chance of a tornado. It doesn't mean we'll get one, but we should hunker down. Same thing with an elevated VIX in the 20s. A market tornado could be right around the corner.
Long-Term Trade Setup
Since beginning this Weekly Market Report in September 2023, I've discussed the long-term trade candidates below that I really like. Generally, these stocks have excellent long-term track records and many pay nice dividends that mostly grow every year. Only in very specific cases (exceptions) would I consider a long-term entry into a stock that has a poor or limited long-term track record and/or pays no dividends. Below is a quick recap of how I view their long-term technical conditions currently:
- JPM - pulling back recently, but a well-deserved break after a very strong 2024
- BA - improving, but only has 2-3 daily closes above 190 in last 11 months, so watch this key resistance level
- FFIV - eliminated recent weekly negative divergence, but taking a breather
- MA - remains near an all-time high
- GS - difficult end to last week, but long-term trend remains very bullish
- FDX - trending lower last couple months, I believe support in the 220-240 area will hold
- AAPL - long-term uptrend is solid
- CHRW - failed to sustain breakout above August 2022 high, hoping to see 95 support hold
- JBHT - remains in lengthy consolidation period, has not closed below 150 in 4 years
- STX - unable to clear resistance in 110-115 area, consolidating in bullish fashion
- HSY - very strong rebound after brutal 6-month stretch where it dropped 30%
- DIS - in uptrend, but won't get significant confirmation until it clears 120-125 range
- MSCI - approached all-time high in December, but has backed off a bit
- SBUX - very nice rally near all-time high since announcing new CEO from Chipotle (CMG)
- KRE - in solid 21-month uptrend, but Fed's pausing of rate cuts having recent negative impact
- ED - rallying back near all-time high, loves March, where it's risen 8 of last 9 years
- AJG - continues one of most consistent and dependable uptrends, now at all-time high
- NSC - still in long period (3+ years) of consolidation
- RHI - weak in 2025, back to testing multi-year low near 60 level
- ADM - recently hit 44.42, close to critical long-term price support in the 40-43 range; bouncing
- BG - printing monthly hammer, so far holding 65-70 long-term price support
- CVS - very nice bounce off 44-45 support to open its 2025 campaign
- IPG - 3-year consolidation has stock at lower end of its 16-month 26-32 price range
- HRL - still bound between price support at 27.50 and 20-month EMA resistance at 32.63
- DE - still like the turn higher off its recent monthly PPO centerline test; uptrend in play
Keep in mind that our Weekly Market Reports favor those who are more interested in the long-term market picture. Therefore, the list of stocks above are stocks that we believe are safer (but nothing is ever 100% safe) to own with the long-term in mind. Nearly everything else we do at EarningsBeats.com favors short-term momentum trading, so I wanted to provide an explanation of what we're doing with this list and why it's different.
Also, please keep in mind that I'm not a Registered Investment Advisor (and neither is EarningsBeats.com nor any of its employees) and am only providing (mostly) what I believe to be solid dividend-paying stocks for the long-term. Companies periodically go through adjustments, new competition, restructuring, management changes, etc. that can have detrimental long-term impacts. The stock price nor the dividend is ever guaranteed. I simply point out interesting stock candidates for longer-term investors. Do your own due diligence and please consult with your financial advisor before making any purchases or sales of securities.
Looking Ahead
Upcoming Earnings
Q4 earnings are in full gear and many of the biggest growth names have either just reported or are getting ready to. The following list of companies is NOT a list of all companies scheduled to report quarterly earnings, however, just key reports, so please be sure to check for earnings dates of any companies that you own. Any company in BOLD represents a stock in one of our portfolios and the amount in parenthesis represents the market capitalization of each company listed:
- Monday: ZM ($26 billion)
- Tuesday: HD ($392 billion), INTU ($162 billion), WDAY ($70 billion), AXON ($41 billion)
- Wednesday: NVDA ($3.4 trillion), CRM ($305 billion), LOW ($139 billion), TJX ($138 billion)
- Thursday: DELL ($84 billion), ADSK ($63 billion), VST ($56 billion), NTAP ($25 billion)
- Friday: None
Key Economic Reports
- Monday: None
- Tuesday: December Case-Shiller home price index, December FHFA house price index, February consumer confidence
- Wednesday: January new home sales
- Thursday: Initial jobless claims, January durable goods, Q4 GDP (2nd estimate), Q4 PCE - annual rate, January pending home sales
- Friday: January personal spending & personal income, February Chicago PMI
Historical Data
I'm a true stock market historian. I am absolutely PASSIONATE about studying stock market history to provide us more clues about likely stock market direction and potential sectors/industries/stocks to trade. While I don't use history as a primary indicator, I'm always very aware of it as a secondary indicator. I love it when history lines up with my technical signals, providing me much more confidence to make particular trades.
Below you'll find the next two weeks of historical data and tendencies across the 3 key indices that I follow most closely:
S&P 500 (since 1950)
- Feb 24: +28.75%
- Feb 25: -8.95%
- Feb 26: +14.38%
- Feb 27: -59.91%
- Feb 28: -20.24%
- Mar 1: +78.25%
- Mar 2: +39.20%
- Mar 3: +11.46%
- Mar 4: +50.85%
- Mar 5: +19.24%
- Mar 6: -16.26%
- Mar 7: -59.52%
- Mar 8: +0.60%
- Mar 9: -18.01%
NASDAQ (since 1971)
- Feb 24: +64.89%
- Feb 25: +15.15%
- Feb 26: +17.68%
- Feb 27: -94.81%
- Feb 28: -28.53%
- Mar 1: +132.23%
- Mar 2: +8.14%
- Mar 3: -7.22%
- Mar 4: +76.37%
- Mar 5: -13.69%
- Mar 6: -22.48%
- Mar 7: -53.60%
- Mar 8: +7.66%
- Mar 9: -39.99%
Russell 2000 (since 1987)
- Feb 24: +76.34%
- Feb 25: +20.01%
- Feb 26: +30.84%
- Feb 27: -57.46%
- Feb 28: -63.92%
- Mar 1: +146.28%
- Mar 2: -1.57%
- Mar 3: +4.06%
- Mar 4: +96.06%
- Mar 5: -41.35%
- Mar 6: -43.62%
- Mar 7: -24.83%
- Mar 8: +13.71%
- Mar 9: -76.04%
The S&P 500 data dates back to 1950, while the NASDAQ and Russell 2000 information date back to 1971 and 1987, respectively.
Final Thoughts
Well, last week was a game changer. The bears have put the bulls on notice. It's time for a significant short-term rally or I'd expect more of what we saw last week. Here's my focus this week:
- Rotation. Stocks rotated last week in extremely bearish fashion. Should we bounce this week, it'll be very important to see what leads. If defensive stocks lead to both the upside and downside, that would be another indictment on U.S. stocks.
- Seasonality. This week, and the early part of next week usually favors the bulls. If the bulls can't regain control during a seasonally-favorable period, that wouldn't bode well for the month of March, which usually favors defensive stocks anyway.
- Key Technical Levels. Now that we have last week's ugly attempt at all-time highs out of the way, the questions now center around whether key price support will hold. 20-day EMAs weren't much of a challenge for the bears last week, but that's not unusual given the mostly sideways action we've seen since late 2024. Moving averages rarely put up much of a fight during trendless market periods. The two short-term support levels I'd watch on the S&P 500 are psychological support at 6000, then gap support from the start of earnings season at 5905. Failure to hold these two support levels would add to the likelihood that this downturn will likely end much lower - in the 5500s/5600s, or even possibly lower.
- Accumulation vs. Distribution. If we do see more selling, it will be important to watch not only the rotation between aggressive and defensive areas of the market, but also the nature of the decline itself. Is it mostly gaps to the downside with neutral to bullish action during the balance of days? Or is like last Friday, where clear distribution takes place throughout the day?
- NVIDIA Corp (NVDA). Quarterly earnings will be out on Wednesday after the market closes. This is clearly a stock that matters. A strong report could benefit a large segment of the semiconductors group ($DJUSSC), while weak results and/or guidance could add fuel to the bears' fire.
Happy trading!
Tom