
EB Weekly Market Report - Monday, April 29, 2024
Abbreviated Weekly Market Report
I am trying to catch from my vacation since Wednesday of last week. I appreciate your patience. This week's Weekly Market Report will be abbreviated to some degree to help me catch up.
ChartLists Updated
ChartLists were not updated over the weekend, but I'll be working on getting those updated throughout the week. Earnings are really starting to pick up, so it's not an easy task.
I know many of you have waited patiently for the Model ETF Portfolio ChartList and the ETF Analyzer spreadsheet. Both of those should be out later today. Also, the Upcoming Earnings ChartLists are now available as well.
Weekly Market Recap
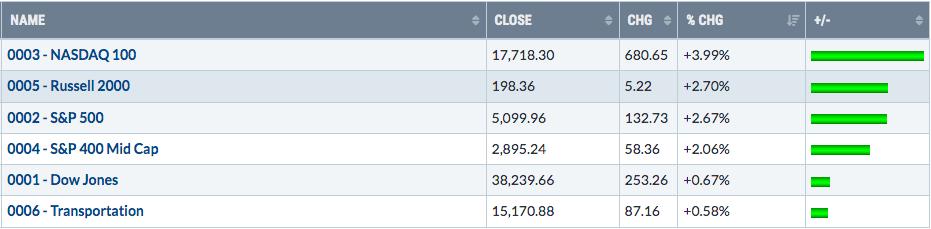
Major Indices
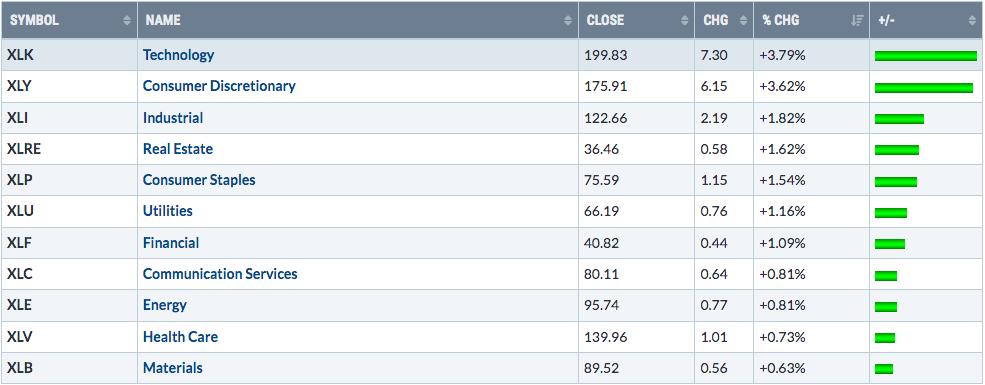
Sectors
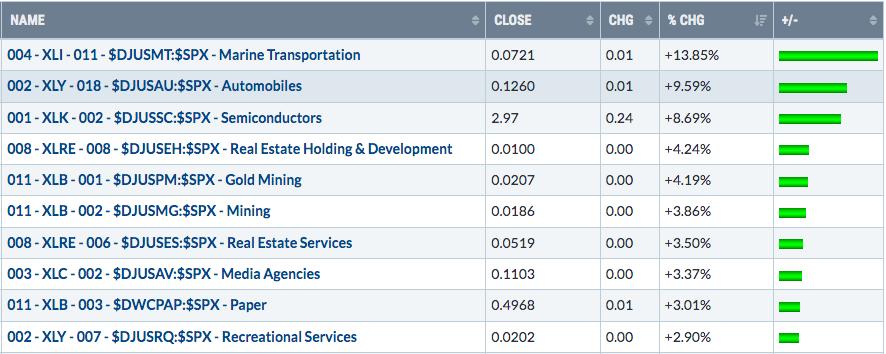
Top 10 Industries Last Week
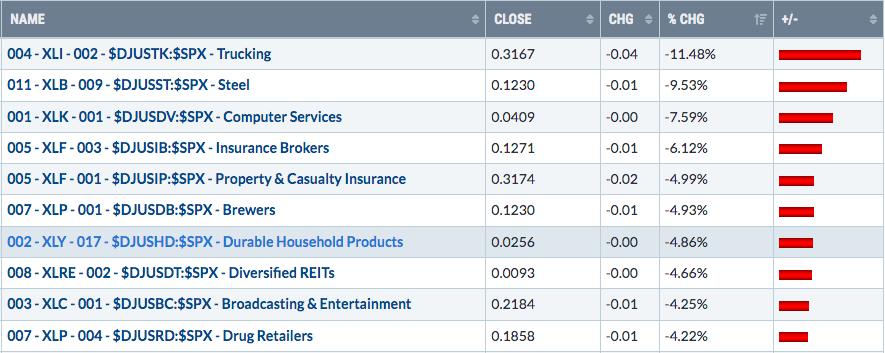
Bottom 10 Industries Last Week
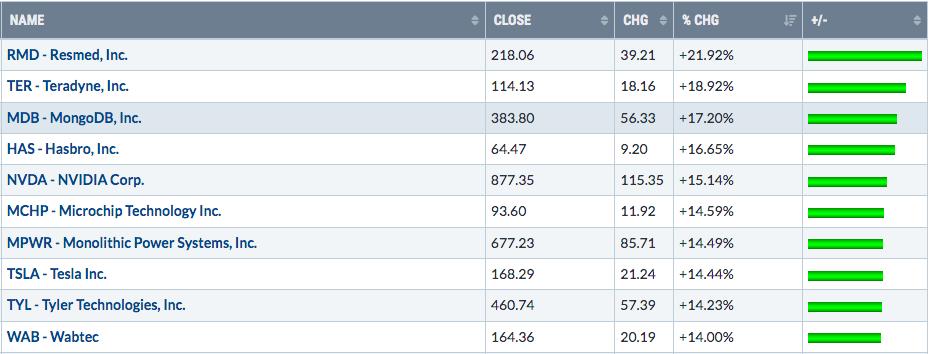
Top 10 Stocks - S&P 500/NASDAQ 100
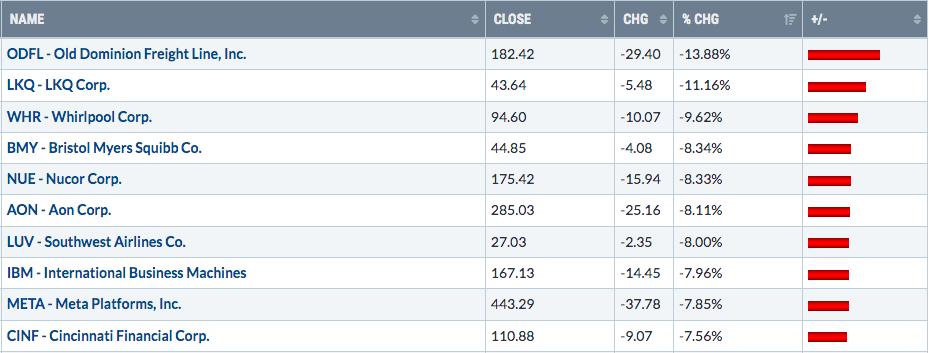
Bottom 10 Stocks - S&P 500/NASDAQ 100
Big Picture
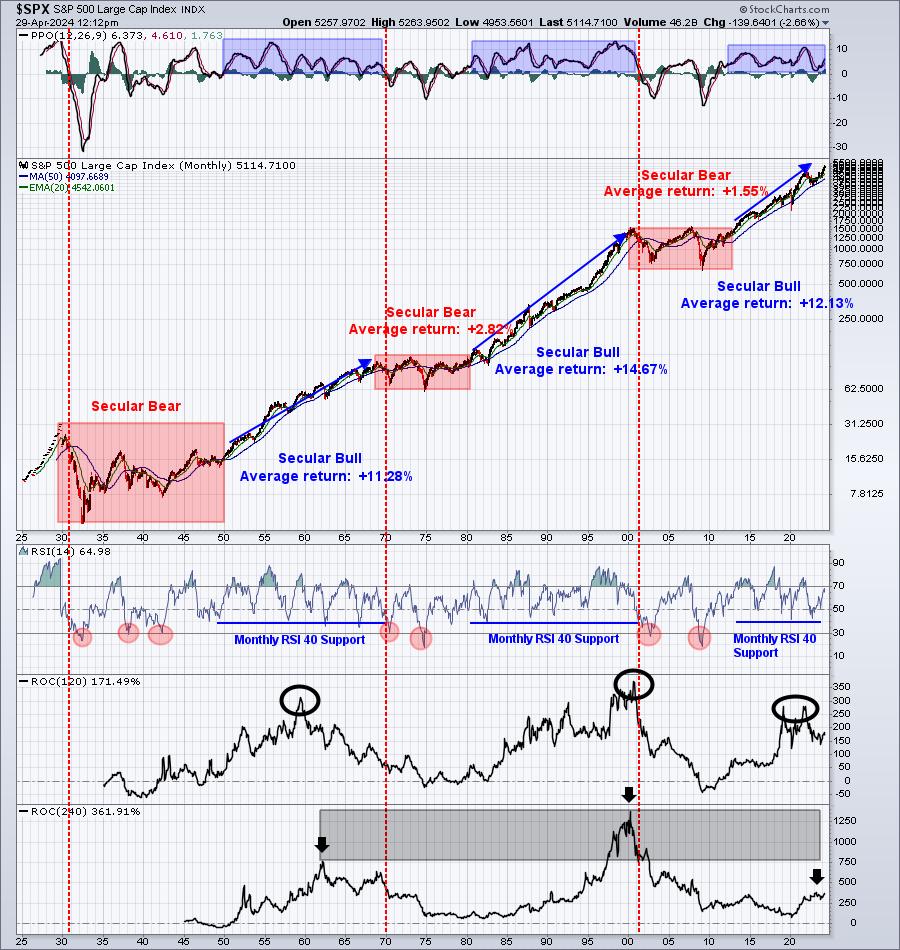
The selling from two weeks ago didn't feel great, but last week's rebound helped to alleviate some of the short-term pain. There's been no damage done whatsoever in the long-term, however:
Sentiment
I wrote a Trading Places Live article at Stockcharts.com, discussing what the recent action in the Volatility Index ($VIX) would likely mean for short-term trading. The lower the VIX, the better. Holding the line at 20 was key last week. Falling back below 17 is encouraging. A further drop in the coming weeks would likely accompany the next leg higher in the secular bull market.
The equity-only put-call ratio ($CPCE) remains relatively neutral, though we did see it drop to a reading of .55 on Friday. I see no sentiment issues at the current time. I'm keeping an eye on the VIX, but a further fall ahead of the Fed meeting this week is a fairly good (bullish) signal.
Rotation/Intermarket Analysis
Here's the latest look at our key intraday ratios as we follow where the money is traveling on an INTRADAY basis:
QQQ:SPY
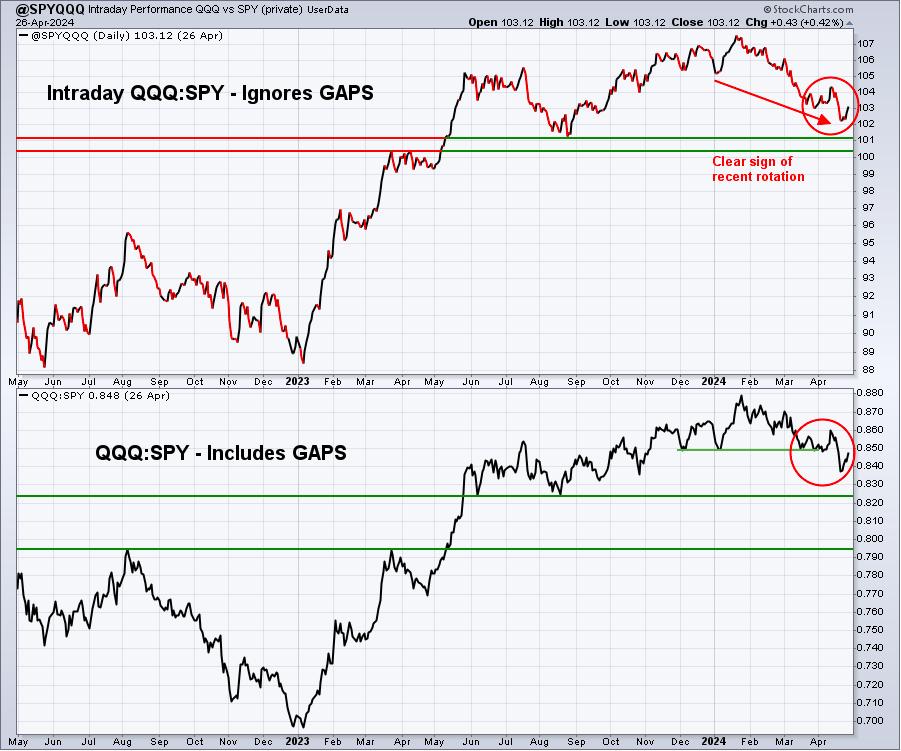
The QQQ:SPY ratio improved last week and we're about to head into the best 4-month stretch of the year in terms of growth vs. value. This reversal and trend higher might just be getting started if history repeats itself as it so often does.
IWM:QQQ
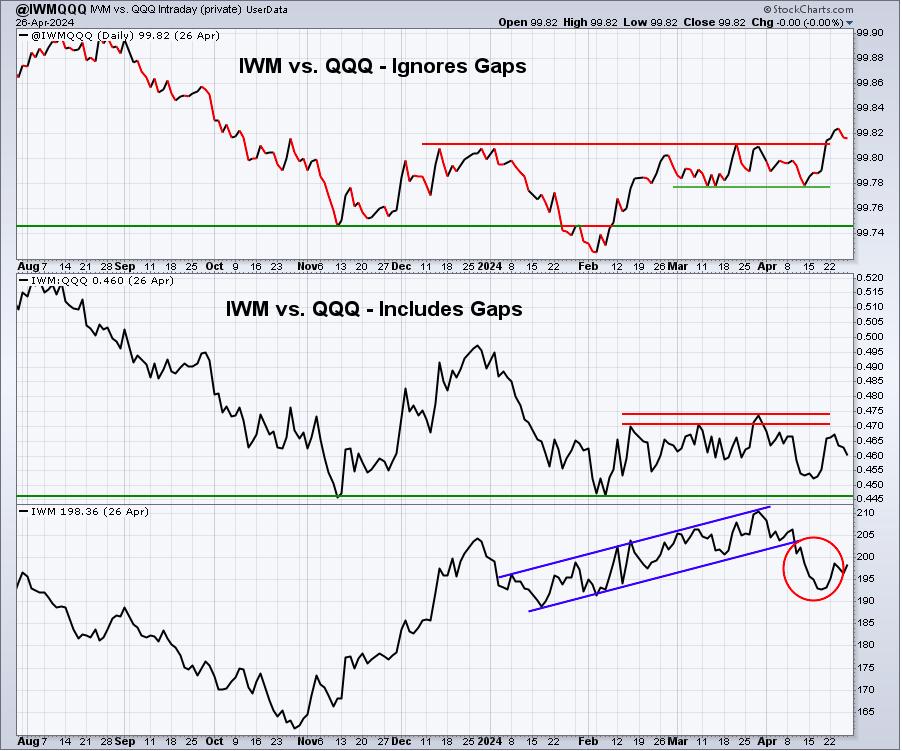
The top price panel is the IWM vs. QQQ, but ignoring gaps. Therefore, it only looks at how the IWM is performing relative to the QQQ during the trading day. We pulled back last week, but we held the recent breakout level. Intraday rotation INTO the IWM still appears to be popular.
XLY:XLP
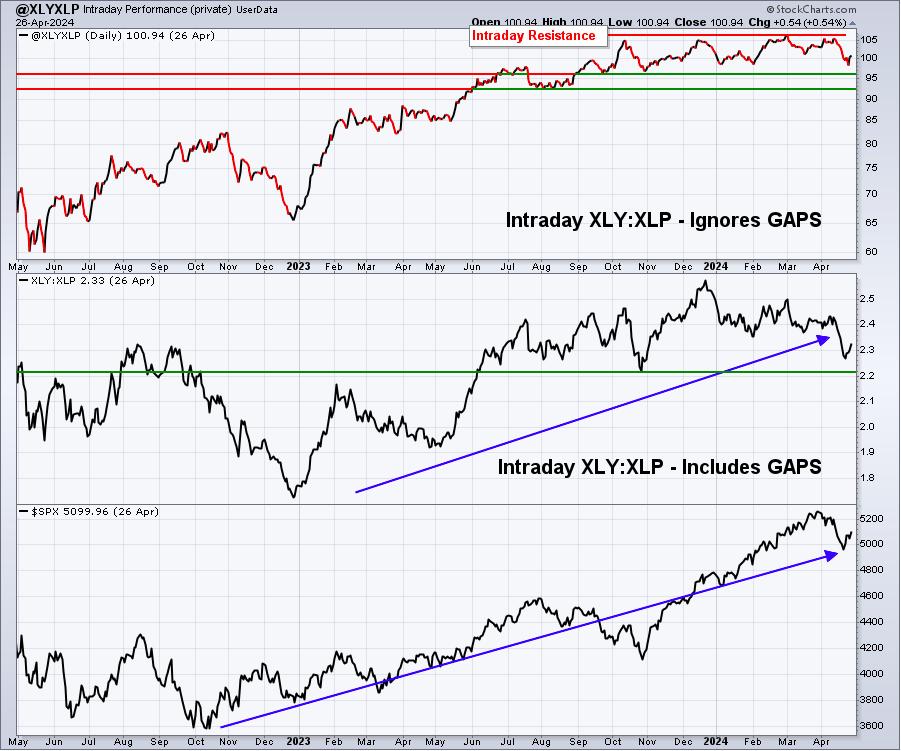
Key Sector/Industry Charts
I am reprinting this from last week's WMR, because of its importance.....
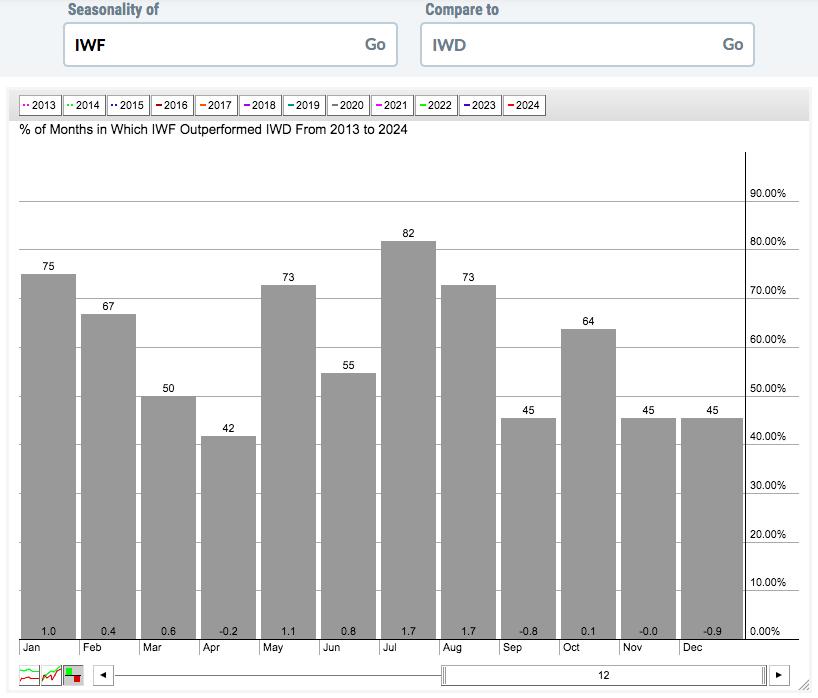
I've started discussing this recently, but we are approaching the absolute best time of the year to be invested in growth stocks (vs. value). Here's a seasonality chart that covers the past 11+ years since this secular bull market began. At the bottom of each bar is the average outperformance of growth (IWF) vs. value (IWD) for that calendar month. If you add up the totals, you'll find that the IWF averages outperforming the IWD by 5.3% from May through August. The other 8 months combined shows IWF outperformance of just 0.2%. Clearly, this upcoming May through August period is where growth separates itself from value - at least historically. Check this out:
Trade Setup
Since beginning this Weekly Market Report in early September, I've discussed the long-term trade candidates below that I really like. Generally, these stocks have excellent long-term track records and many pay nice dividends that mostly grow every year. Only in very specific cases (exceptions) would I consider a long-term entry into a stock that has a poor or limited long-term track record:
- JPM
- BA
- FFIV
- MA
- GS
- FDX
- AAPL
- CHRW
- JBHT
- STX
- HSY
- DIS
- MSCI
- SBUX
- KRE
- ED
- AJG
Keep in mind that our Weekly Market Reports favor those more interested in the long-term market picture. Therefore, the list of stocks above are stocks that we believe are safer (but nothing is ever 100% safe) to own with the long-term in mind. Nearly everything else we do at EarningsBeats.com favors short-term momentum trading, so I wanted to provide an explanation of what we're doing with this list.
I don't have any additions to list "long-term" list at this time.
Looking Ahead
Upcoming Earnings:
Q1 earnings are underway and accelerating. I've identified what I believe are key companies that will report this week, with their respective market caps in parenthesis. This is NOT a list of ALL companies reporting this week, so please be sure to check for earnings of any companies that you own or add. Any companies in BOLD represent stocks in one of our Portfolios:
- Monday: NXPI ($61 billion), ON ($29 billion), MSTR ($21 billion)
- Tuesday: AMZN ($1.80 trillion), AMD ($248 billion), SBUX ($99 billion), SMCI ($44 billion)
- Wednesday: MA ($431 billion), QCOM ($182 billion), DASH ($51 billion)
- Thursday: AAPL ($2.62 trillion), AMGN ($144 billion), BKNG ($119 billion)
- Friday: BRK.A ($881 billion)
Key Economic Reports:
- Monday: None
- Tuesday: Q1 employment cost index, February Case-Shiller home price index, February FHFA house price index, April Chicago PMI, April consumer confidence
- Wednesday: April ADP employment report, April PMI manufacturing, April ISM manufacturing, March construction spending, March JOLTS, FOMC announcement
- Thursday: Initial jobless claims, Q1 productivity & costs, March factory orders
- Friday: April nonfarm payrolls
Historical Data
I'm a true stock market historian. I am absolutely PASSIONATE about studying stock market history to provide us more clues about likely stock market direction and potential sectors/industries/stocks to trade. While I don't use history as a primary indicator, I'm always very aware of it as a secondary indicator. I love it when history lines up with my technical signals, providing me much more confidence to make particular trades.
Below you'll find the next two weeks of historical data and tendencies across the 3 key indices that I follow most closely:
S&P 500 (since 1950)
- April 29: +38.84%
- April 30: -10.67%
- May 1: +49.60%
- May 2: +40.36%
- May 3: +16.87%
- May 4: +13.45%
- May 5: +33.21%
- May 6: -35.12%
- May 7: -37.30%
- May 8: +58.06%
- May 9: -41.62%
- May 10: -13.57%
- May 11: -50.36%
- May 12: +18.78%
NASDAQ (since 1971)
- April 29: +47.61%
- April 30: -9.90%
- May 1: +71.05%
- May 2: +56.11%
- May 3: -28.63%
- May 4: +56.84%
- May 5: +57.18%
- May 6: -57.65%
- May 7: -58.48%
- May 8: +76.53%
- May 9: -53.65%
- May 10: -17.03%
- May 11: -19.11%
- May 12: +33.12%
Russell 2000 (since 1987)
- April 29: +99.89%
- April 30: -97.98%
- May 1: +22.81%
- May 2: +69.89%
- May 3: +17.82%
- May 4: +71.17%
- May 5: +8.87%
- May 6: -85.09%
- May 7: -95.97%
- May 8: +77.52%
- May 9: -36.57%
- May 10: +1.29%
- May 11: -50.24%
- May 12: +0.46%
The S&P 500 data dates back to 1950, while the NASDAQ and Russell 2000 information date back to 1971 and 1987, respectively.
Here's a quick historical analysis of the S&P 500 during May since 1950:
- May 1-5: +29.94%
- May 6-25: -12.10%
- May 26-31: +37.27%
Final Thoughts
The rebound last week was nice and a key was seeing that VIX fall back after nearly reaching 20. When the VIX gets past 20, it CAN lead to a significant increase in selling. It doesn't always happen, but just remember that the biggest selling occurs with the VIX above 20. If we can remain below 20, then I doubt we'll see a lower price low on the S&P 500.
Here are several things to consider in the week ahead:
- History. This is a very solid week historically. In fact, the first week of May and the last week of May is where we typically see the most bullish action of the month.
- Growth vs. Value. May through August is the absolute best time of the calendar year for growth stocks' (IWF) relative strength vs. value stocks (IWD).
- Fed Meeting. This makes me wince. I have no idea what the Fed will say from month to month. Over the past month, there's been a lot of Fed chatter that interest rate cuts will pushed back for awhile. Will they agree to cut the number of rate cuts in 2024 from 3 to 2? Maybe even to 1 or zero? We'll find out the latest on Wednesday at 2pm ET. Buckle up!
- Earnings. The quarterly results are starting to pour in. The big report this week will be Apple, Inc. (AAPL) on Thursday after the close. But there'll be others, starting with Amazon.com (AMZN) after the bell tomorrow. Super Micro Computer (SMCI) will also report after the bell on Tuesday. Can they top last quarter's blowout report?
- Interest Rates: We did see the 10-year treasury yield ($TNX) move through 4.70% last week, but struggled to close above it. We've since backed off this important resistance level, with the TNX at a more palatable 4.62% - just before the latest Fed announcement.
- Semiconductors: Advanced Micro Devices (AMD) will be watched closely as they report quarterly results on Tuesday. Historically, semiconductors perform best in November, but May is the next best calendar month. Both months have risen during 10 of the last 11 years, so historical tailwinds are right around the corner.
Feedback
If you'd like to share your thoughts on our Weekly Market Report, positive or negative, you can reach us at "[email protected]".
Happy trading!
Tom