
EB Weekly Market Report - Monday, April 28, 2025
ChartLists/Spreadsheets Updated
The following ChartLists/Spreadsheets were updated over the weekend:
- Manipulation Spreadsheet
- Upcoming Earnings
The Upcoming Earnings ChartLists should be available to download into your StockCharts Extra or Pro account, if you have a StockCharts membership. Otherwise, we can send you an Excel file with the stocks included in these ChartLists in order to download them into other platforms.
The Manipulation Spreadsheet has been updated for our 3 primary index ETFs - SPY, QQQ, and IWM. Also updated this morning were AAPL, MSFT, NVDA, META, GOOGL, AMZN, TSLA, NFLX, AMD, JPM, PLTR, and CLS. I review this Excel file weekly. It is not meant to be updated and studied daily. I wanted to emphasize this, because we have had a few members looking for daily updates. Much of our work is done weekly, so these stocks won't be updated daily. It's more of a macro view of the various ups and downs of our major indices and what the intraday trading behavior might be suggesting.
The Strong Earnings, Strong Future Earnings, Raised Guidance, and Bullish Trifecta ChartLists might be updated during the upcoming week, but more likely is providing these over the weekend and updated through Friday, May 2nd.
If you have any questions, please reach out to us at "[email protected]".
Weekly Market Recap
Major Indices
Sectors
Top 10 Industries Last Week
Bottom 10 Industries Last Week
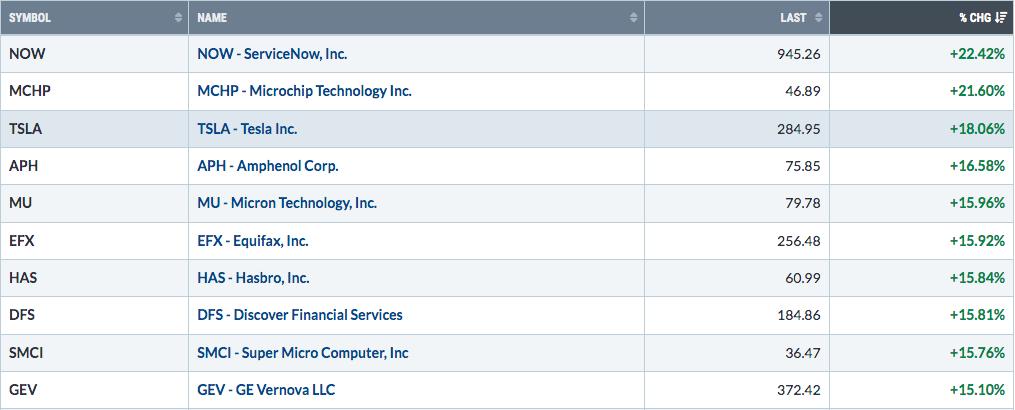
Top 10 Stocks - S&P 500/NASDAQ 100
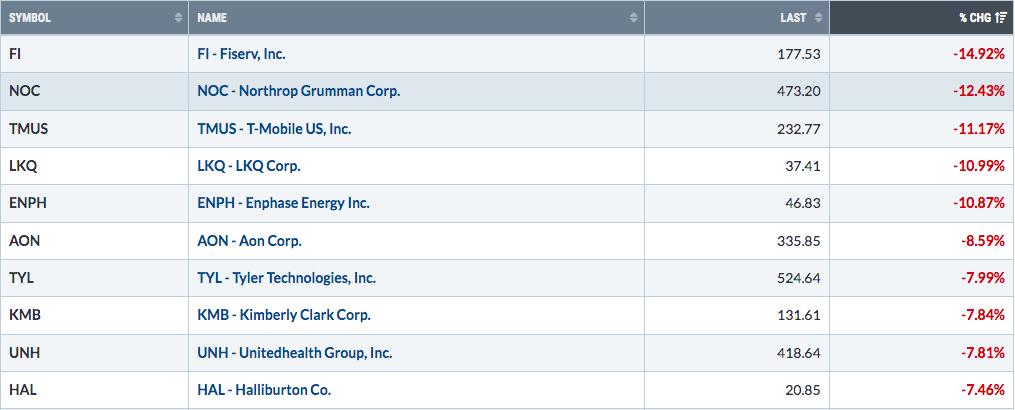
Bottom 10 Stocks - S&P 500/NASDAQ 100
Big Picture
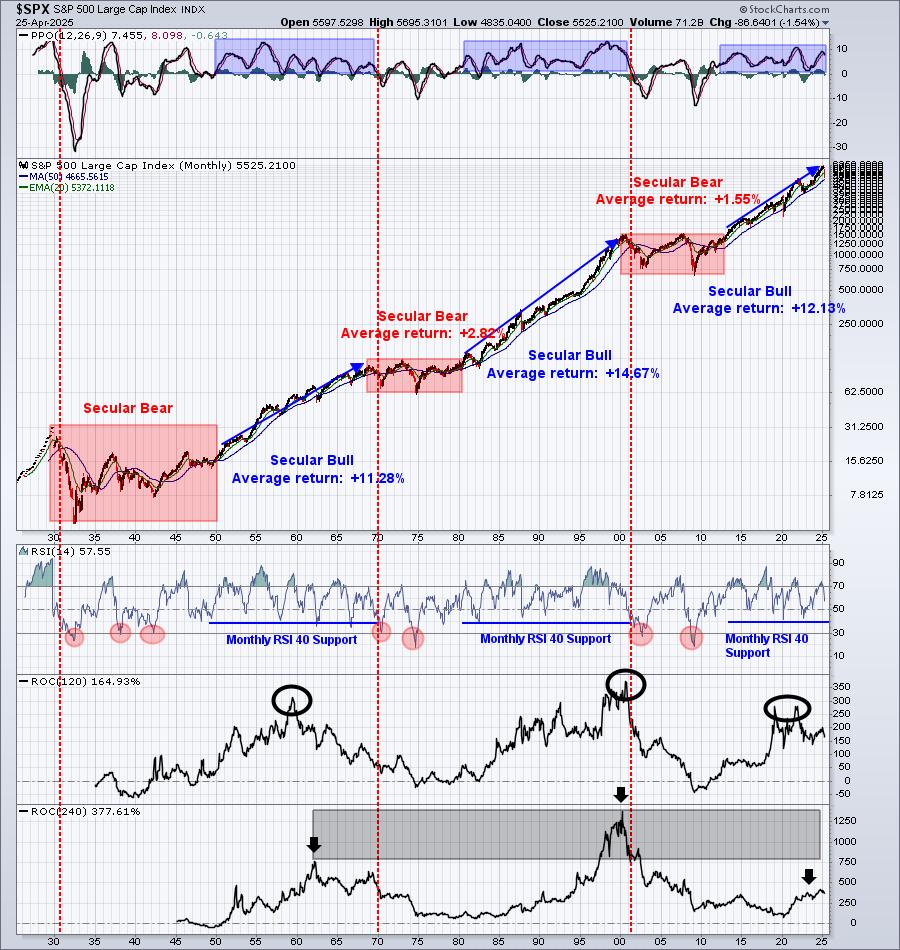
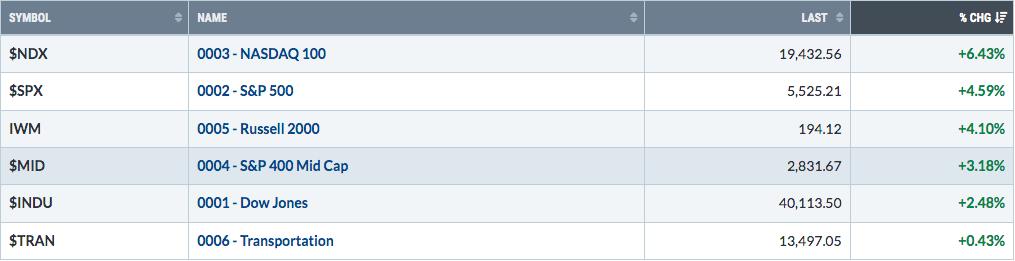
More than half of the 2025 bear market was recovered as of Friday's close on the S&P 500 at 5525. This wasn't the explosive move through 5521 that I wanted to see, but closing above 5521 is a start. A reversing candle today could be the start of further downside and consolidation over the next few weeks. Earnings might have a lot to say about it, especially on Wednesday and Thursday after the market closes. That's when we'll get the Microsoft (MSFT) and Meta Platforms (META) quarterly reports (Wednesday), along with Apple (AAPL) and Amazon.com (AMZN) quarterly reports on Thursday.
Sustainability Ratios
Here's the latest look at our key intraday ratios as we follow where the money is traveling on an INTRADAY basis (ignoring gaps):
QQQ:SPY
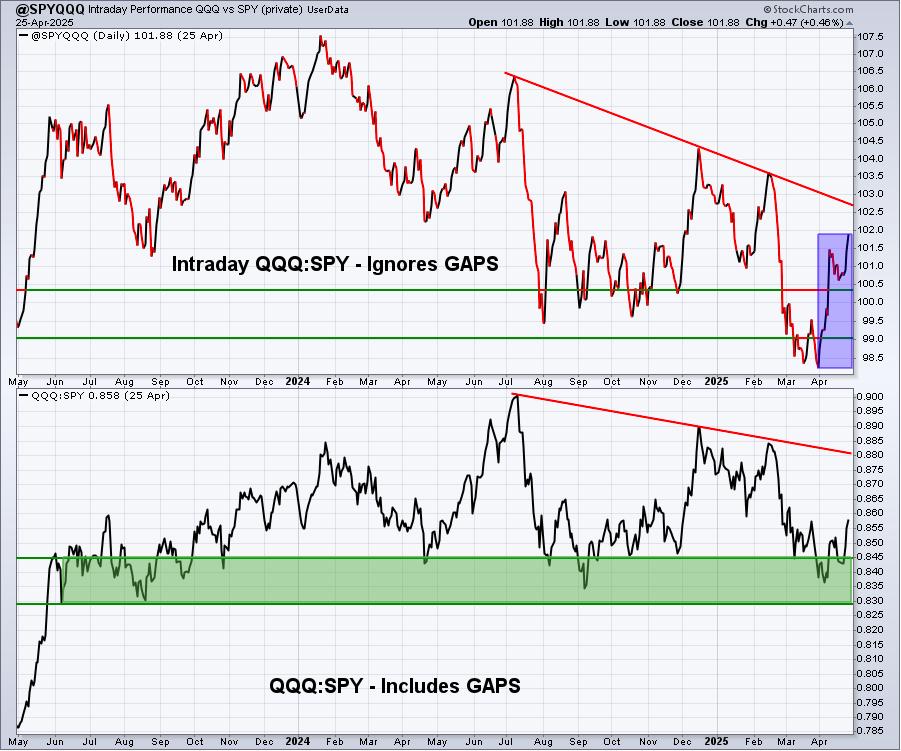
As I suspected last week, the QQQ:SPY ratio saw more bullish action last week. I think one key will be the clearing of the relative downtrend lines on both panels.
IWM:QQQ
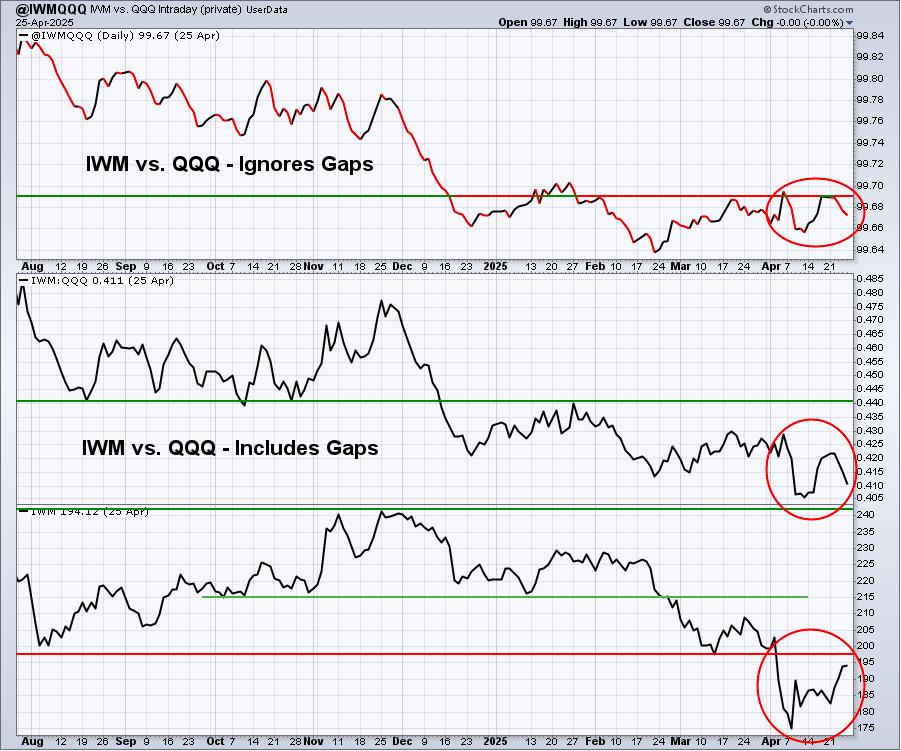
The back and forth on this ratio remains very difficult to interpret. At this point, I'd say the overall absolute and relative downtrend lines are bearish, though that could change quickly with a breakout.
XLY:XLP
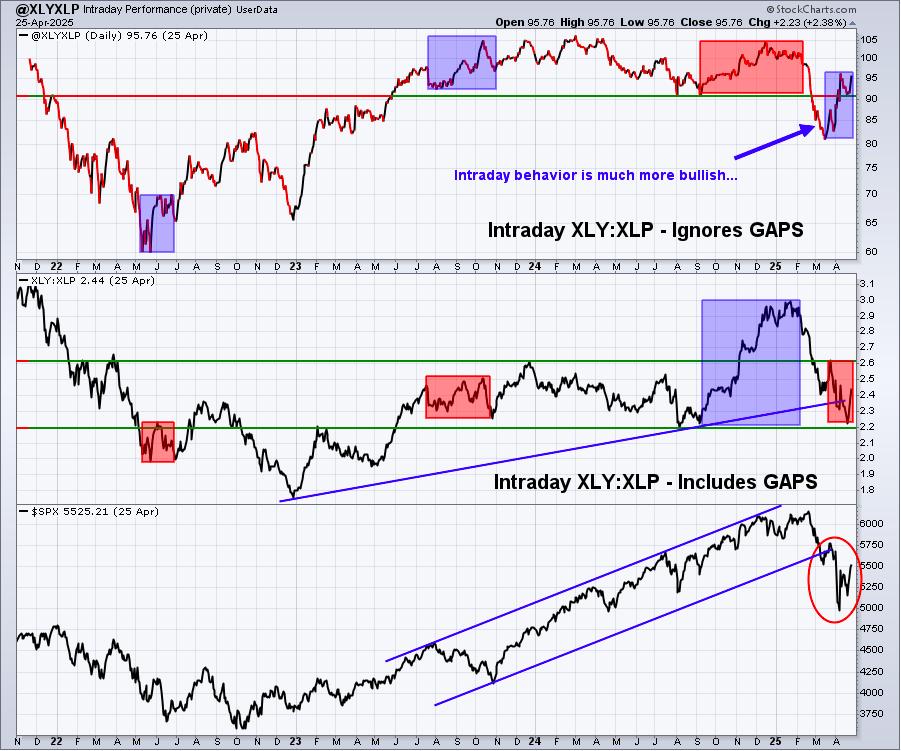
That blue-shaded area provides us a great visual of money rotating strongly back towards the more aggressive discretionary area of consumer stocks. The same thing happened in May/June of 2022, which led to me calling a market bottom. Notice that the middle panel shows the XLY:XLP falling if we include gaps. But if we ignore gaps (top panel) and focus only on what happens intraday, the XLY:XLP surged. I interpret this as a very bullish development, though the most important signal of all is price action. An S&P 500 close back above 5521 is what we truly need to become more bullish technically. However, many times these "secondary" signals will provide us bullish clues that are later confirmed by price action.
I cannot come up with a bearish reason for the XLY vs. XLP to be moving up so quickly on an intraday basis.
Sentiment
5-day SMA ($CPCE)
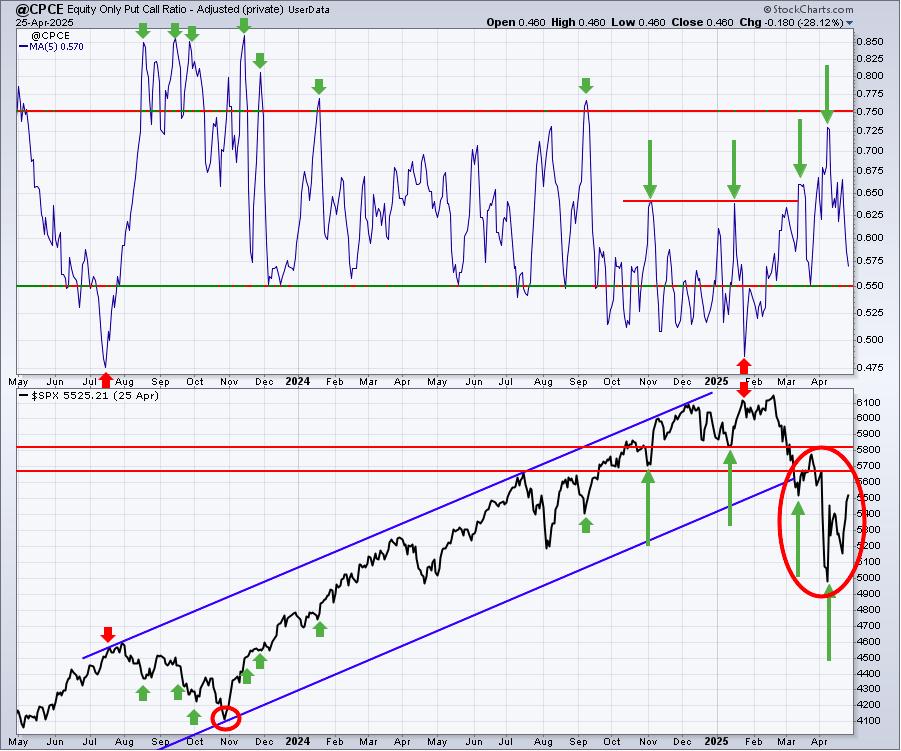
Sentiment indicators are contrarian indicators. When they show extreme bullishness, we need to be a bit cautious and when they show extreme pessimism, it could be time to become much more aggressive. Major market bottoms are carved out when pessimism is at its absolute highest level.
Given the S&P 500 rally up to key 5521 resistance, it's entirely possible that we roll over again here. The 5-day SMA of the CPCE is approaching .55, where we have seen several accompanying short-term tops in 2023 and 2024. I'm really watching the action closely here. If the S&P 500 can continue to tear down overhead price resistance at 5521, then the April bottom is likely THE low. If it cannot, then we're back to our 4800-5521 trading range.
253-day SMA ($CPCE)
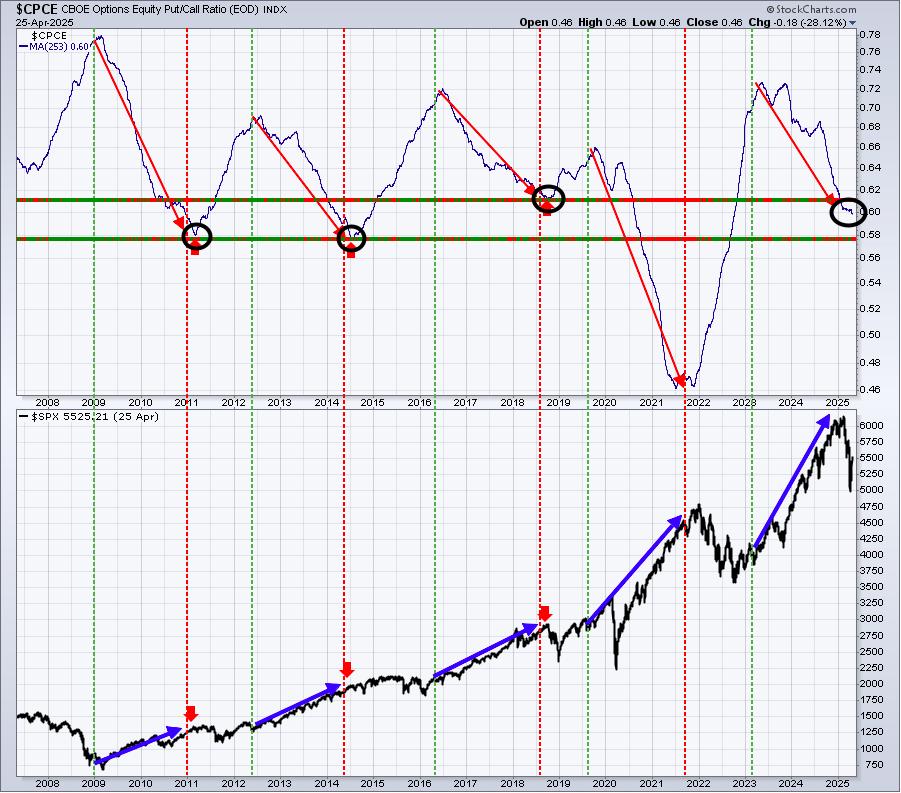
The 253-day SMA of the CPCE has turned lower again. And I want everyone to keep something in mind here. The ultimate low in this 253-day SMA suggests turbulence ahead, not necessarily a full out bear market. I could argue that what we've seen in 2025 thus far is due to this 253-day SMA printing fairly low numbers. Look back to the 253-day SMA lows in 2011 and 2014. We didn't have a lengthy bear market. Rather, we saw some turbulence before the S&P 500 ultimately moved to fresh all-time highs.
Don't grow overly bearish, because of this chart.
Volatility ($VIX)
Here's the current view of the VIX:
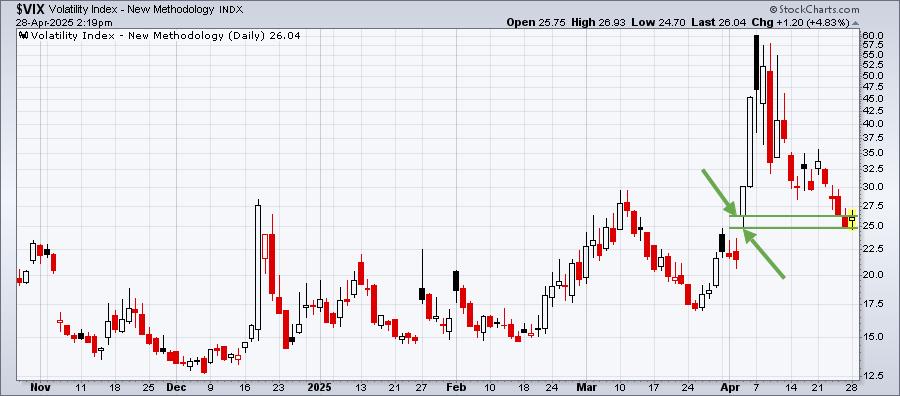
When the S&P 500 gapped down below the 5521 key price support level, the VIX gapped up to 26 and the intraday low that day was close to 25. Note that just as we test the 5521 level on the S&P 500, we're also testing this 25-26 support level on the VIX. Does volatility spike again from this level? If so, then the 5521 resistance level likely fails again as well.
Long-Term Trade Setup
Since beginning this Weekly Market Report in September 2023, I've discussed the long-term trade candidates below that I really like. Generally, these stocks have excellent long-term track records, and many pay nice dividends that mostly grow every year. Only in specific cases (exceptions) would I consider a long-term entry into a stock that has a poor or limited long-term track record and/or pays no dividends. Below is a quick recap of how I viewed their charts last week:
- JPM - April shows a successful 20-month EMA test
- BA - major long-term support in the 120-125 range that's holding so far
- FFIV - solid long-term uptrend, bouncing off 20-month EMA test
- MA - another bouncing off 20-month EMA test
- GS - 20-month EMA test as well
- FDX - remains in a long-term uptrend, but short-term broken down; key uptrend line approaching near 180
- AAPL - tested 50-month SMA for first time since last trade war
- CHRW - successfully testing gap support, now trying to hold onto 50-month SMA
- JBHT - has broken down on multiple time frames, would look for bottom in the 110-120 area
- STX - recent low may have established Point D in an A-B-C-D-E ascending triangle
- HSY - continues its descent, with its trading range now roughly 140-190
- DIS - recent drop takes DIS back near price support just below 80
- MSCI - uptrend still intact; this year's action has been almost entirely beneath the declining 20-month EMA
- SBUX - steady decline since failed breakout, closing in on key price support near 70
- KRE - fell below support range from 50.00-52.50, but now back in that range
- ED - one of the best stocks of 2025
- AJG - few stocks have been steadier to the upside over the past decade
- NSC - been weak in 2025, but long-term chart remains solid
- RHI - steady decline worsening, could we test previous double bottom at 30?
- ADM - key support remains from 43-45, long-term uptrend intact
- BG - 65-70 support needs to hold, another test of low likely to print positive divergence on weekly chart
- CVS - trending higher with support now at rising 20-week EMA
- IPG - 4-year support at 23 level now being tested
- HRL - support over past 2 years still holding around 27.50
- DE - one of the market's better relative performers this year, going against the overall market grain
Keep in mind that our Weekly Market Reports favor those who are more interested in the long-term market picture. Therefore, the list of stocks above are stocks that we believe are safer (but nothing is ever 100% safe) to own with the long-term in mind. Nearly everything else we do at EarningsBeats.com favors short-term momentum trading, so I wanted to explain what we're doing with this list and why it's different.
We will likely be adding several growth stocks over the next few months as we've finally seen deep enough selling for many excellent long-term performers to begin adding.
Also, please keep in mind that I'm not a Registered Investment Advisor (and neither is EarningsBeats.com nor any of its employees) and am only providing (mostly) what I believe to be solid dividend-paying stocks for the long term. Companies periodically go through adjustments, new competition, restructuring, management changes, etc. that can have detrimental long-term impacts. Neither the stock price nor the dividend is ever guaranteed. I simply point out interesting stock candidates for longer-term investors. Do your due diligence and please consult with your financial advisor before making any purchases or sales of securities.
Looking Ahead
Upcoming Earnings
Very few companies will report quarterly results until mid-April. The following list of companies is NOT a list of all companies scheduled to report quarterly earnings, however, just key reports, so please be sure to check for earnings dates of any companies that you own. Any company in BOLD represents a stock in one of our portfolios and the amount in parenthesis represents the market capitalization of each company listed:
- Monday: WM ($92 billion), CDNS ($77 billion), NXPI ($49 billion)
- Tuesday: V ($624 billion), KO ($312 billion), BKNG ($158 billion), SBUX ($95 billion)
- Wednesday: MSFT ($2.88 trillion), META ($1.35 trillion), QCOM ($815 billion), KLAC ($92 billion)
- Thursday: AAPL ($3.13 trillion), AMZN ($1.98 trillion), LLY ($196 billion), MCD ($226 billion)
- Friday: BRK/B ($1.15 trillion), XOM ($470 billion), CVX ($245 billion)
Key Economic Reports
- Monday: None
- Tuesday: March wholesale inventories, February Case-Shiller home price index, February FHFA house price index, April consumer confidence, March JOLTS
- Wednesday: April ADP employment report, Q1 GDP (first estimate), Q1 employment cost index, April Chicago PMI, March personal income & personal spending, March pending home sales
- Thursday: Initial jobless claims, April PMI manufacturing, April ISM manufacturing index, March construction spending
- Friday: April nonfarm payrolls, unemployment rate, & average hourly earnings
Historical Data
I'm a true stock market historian. I am absolutely PASSIONATE about studying stock market history to provide us more clues about likely stock market direction and potential sectors/industries/stocks to trade. While I don't use history as a primary indicator, I'm always very aware of it as a secondary indicator. I love it when history lines up with my technical signals, providing me with much more confidence to make particular trades.
Below you'll find the next two weeks of historical data and tendencies across the three key indices that I follow most closely:
S&P 500 (since 1950)
- Apr 28: +2.53%
- Apr 29: +39.64%
- Apr 30: -17.98%
- May 1: +47.07%
- May 2: +43.89%
- May 3: +22.44%
- May 4: +13.45%
- May 5: +33.21%
- May 6: -29.53%
- May 7: -35.96%
- May 8: +56.96%
- May 9: -38.40%
- May 10: -12.55%
- May 11: -50.36%
NASDAQ (since 1971)
- Apr 28: +11.63%
- Apr 29: +48.66%
- Apr 30: -23.19%
- May 1: +66.95%
- May 2: +64.46%
- May 3: -15.32%
- May 4: +56.84%
- May 5: +57.18%
- May 6: -47.92%
- May 7: -57.62%
- May 8: +73.30%
- May 9: -50.55%
- May 10: -16.81%
- May 11: -19.11%
Russell 2000 (since 1987)
- Apr 28: +45.63%
- Apr 29: +102.86%
- Apr 30: -115.21%
- May 1: +25.05%
- May 2: +84.28%
- May 3: +25.97%
- May 4: +71.17%
- May 5: +8.87%
- May 6: -69.89%
- May 7: -90.18%
- May 8: +70.06%
- May 9: -26.79%
- May 10: -4.79%
- May 11: -50.24%
The S&P 500 data dates back to 1950, while the NASDAQ and Russell 2000 information date back to 1971 and 1987, respectively.
Final Thoughts
Last week, we had hardly any economic news and earnings news was just beginning to ramp up. This week will be different. We have tons of economic reports, including the BIG one on Friday morning - the employment report, along with an increasing number of earnings reports. Many are suggesting that Q1 saw a slowdown given the tariff and economic environment.
These are a few things I'll be watching this week.
- Earnings. Earnings and interest rates ultimately drive stock market prices. Interest rates, despite being much higher than they were just a few years ago, remain at historically low levels, conducive to stock market rallies. Big earnings will be out this week, including MSFT, META, AAPL, AMZN, 4 of the Mag 7 names.
- U.S. Dollar. The U.S. Dollar Index ($USD) hit what I believe could be an important low at 98 last week. That connects important lows from 2011 and 2021. Breaking this trendline would be bearish for the dollar, but I'm expecting for this trendline to hold.
- 10-Year Treasury Yield. The TNX is at a near 3-week low at 4.22%. All eyes, of course, will be on the employment report on Friday and that could have a significant impact on the TNX.
- Short-term Technical Trading Range. The S&P 500 is in a trading range from 4800-5521. We closed on Friday at 5525, barely eclipsing that 5521 resistance, but quickly lost 5521 in early trading today. It's bouncing back again this afternoon, though, and was at 5518 at last check. This is very bullish action for the long haul. We just need a definitive breakout above 5521.
- Manipulation. It continues. The only real selling we've seen this year was the distribution period from February 19th through March 13th. The Manipulation spreadsheet that we maintain on our website shows that Wall Street has continued buying many of the most popular names throughout the trading day after gaps to the downside at the opening bell. That's how the bottom was carved out in 2022 and that's exactly how it's playing out again.
Happy trading!
Tom