
EB Monthly Seasonality Report - June 2021
A Look Back At May 2021
Below are the 20 stocks that were favored for the month of May and how they performed:
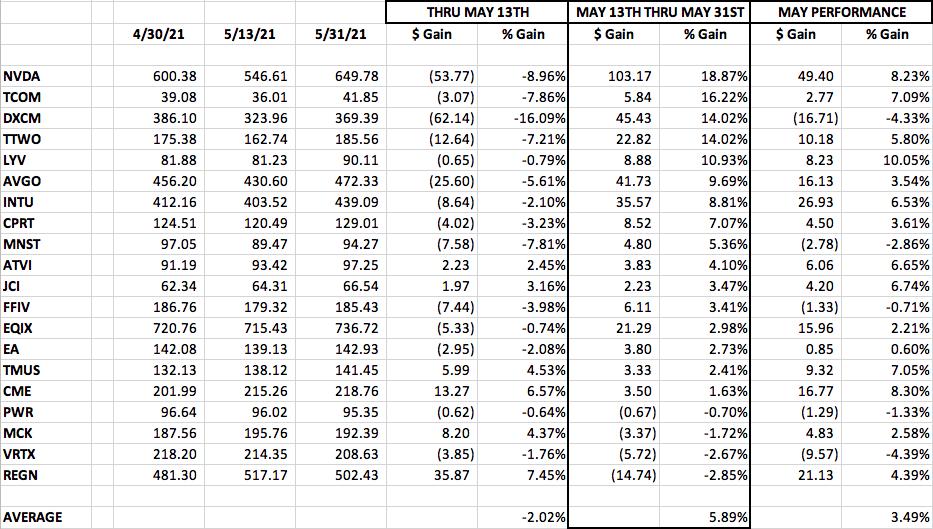
I broke down the May performance between May 1-May 13 and then May 13-May 31. If you recall, the May Seasonality Report wasn't published until May 13th, so I wanted to show how these 20 seasonally strong stocks performed during each part of May. I've outlined the performance from May 13 through May 31 since that was the period our members had this information.
15 of the 20 stocks provided outperformed the S&P 500's return of +2.38% from May 13th through May 31st. The average return of +5.89% more than doubled that S&P 500 return.
The best performer from our May group was LYV, which gained over 10% for the entire month and challenged overhead price resistance before printing a reversing dark cloud cover candle:
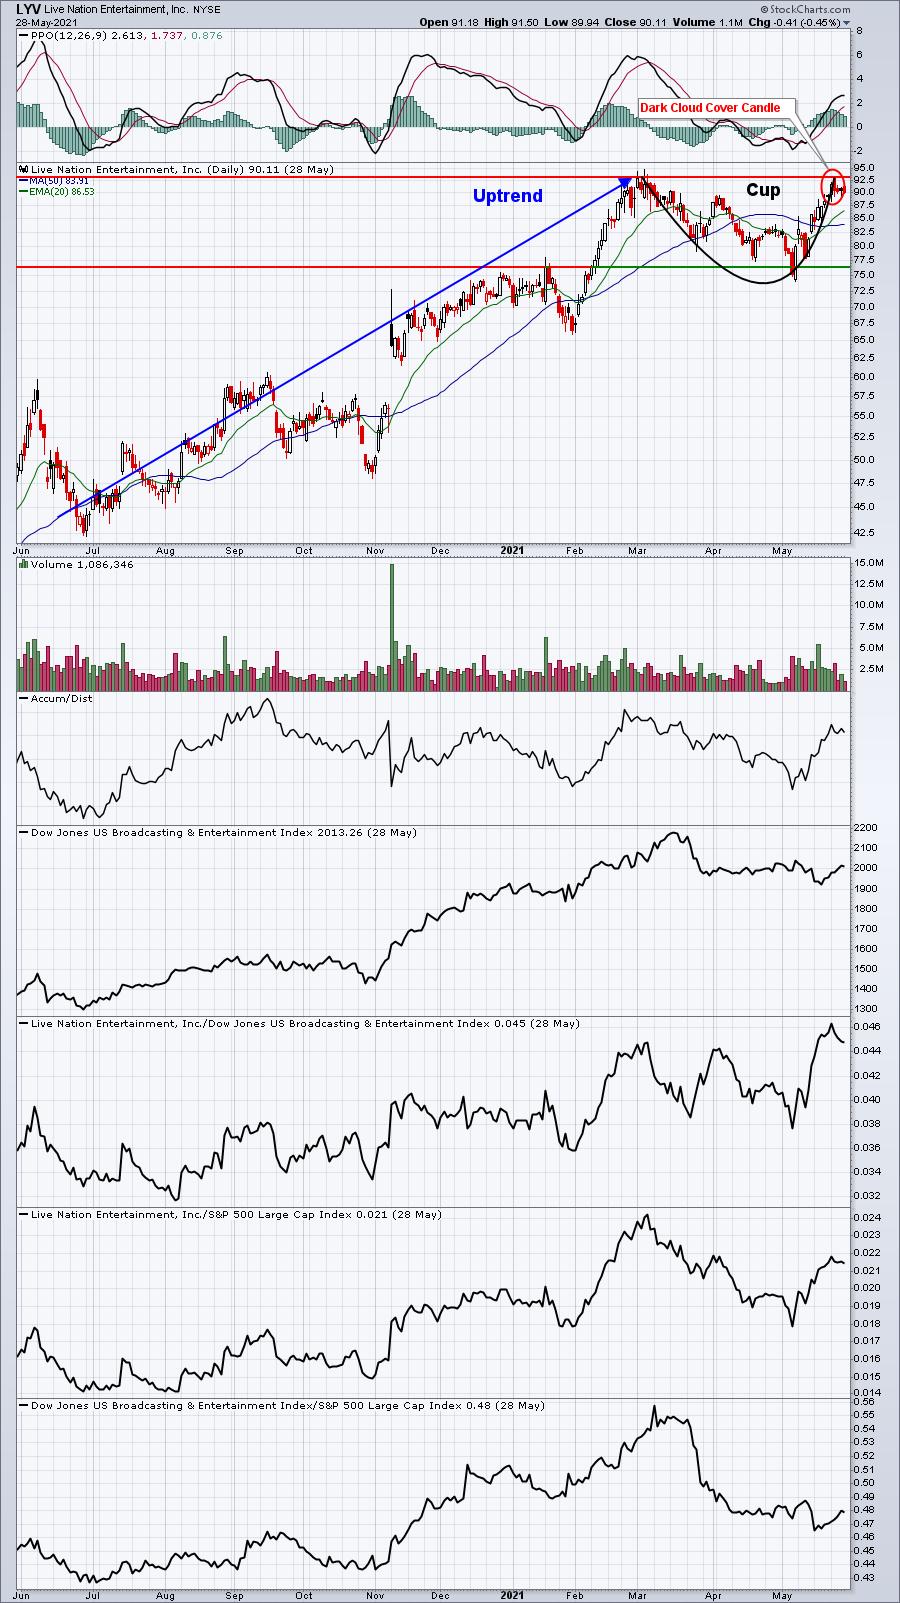
LYV has become a leading stock within the broadcasting & entertainment area ($DJUSBC). A breakout of the cup would be a very bullish development, especially if accompanied by confirming volume.
A Look Ahead At June 2021
S&P 500 Performance
Here's a breakdown of the annualized performance of the S&P 500 (since 1950) during the month of June:
June 1-6: +31.08%
June 7-11: -13.70%
June 12-17: +14.08%
June 18-27: -25.51%
June 28-30: +31.61%
The stock market trades during June in much the same manner it does throughout the year. The S&P 500 typically starts off in strong fashion during the first week, but that's followed by a period of profit taking. After one more less powerful push to the upside, we encounter the worst part of the month from the June 17th close through the June 27th close. We could be susceptible to more downside action during this period of June, so be careful, especially if technical conditions begin to support short-term selling.
Sector Performance
Before we look at individual stocks, let's get an overview of how the various sectors and industries have performed during June (and July) over the past decade (during this bull market):
Sector Heat Map:
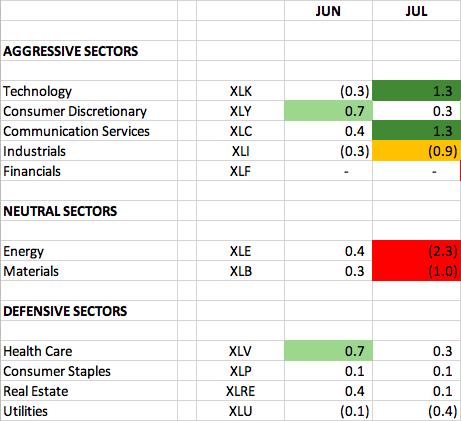
The numbers reflect how much a sector, on average, outperforms or underperforms the S&P 500 over the past 10 years. The dark green shaded area shows significant outperformance (1.0 or greater). The light green shaded areas shows solid outperformance (from 0.5 to 1.0). The orange shaded area shows underperformance (-0.5 to -1.0). The red shaded area shows significant underperformance (-1.0 or greater). Where there is no shading, there tends to be more neutral performance (-0.4 to 0.4).
We typically see relative strength in consumer discretionary (XLY) and health care (XLV) during June, while most other sectors perform in a more neutral manner. Money tends to stay a bit more defensive during June, but then rotate in much more bullish (and aggressive) fashion into July.
Industry Performance
Health care (XLV) does have a big technical issue entering June as it must overcome a nasty negative divergence on its daily chart. Its weekly chart remains quite solid, however. Here's a heat map breakdown of the XLV for June and July:
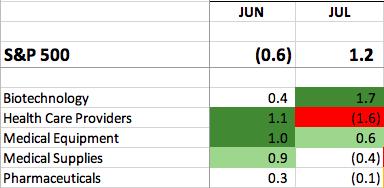
Health care is typically a strong relative performer in May, though things begin to cool off a bit in July (except for biotechs which love July). Medical equipment stocks ($DJUSAM) appear poised to perform well in June as they've recently bounced off trendline and 50-day SMA support. A run to their recent April high wouldn't seem too far fetched:
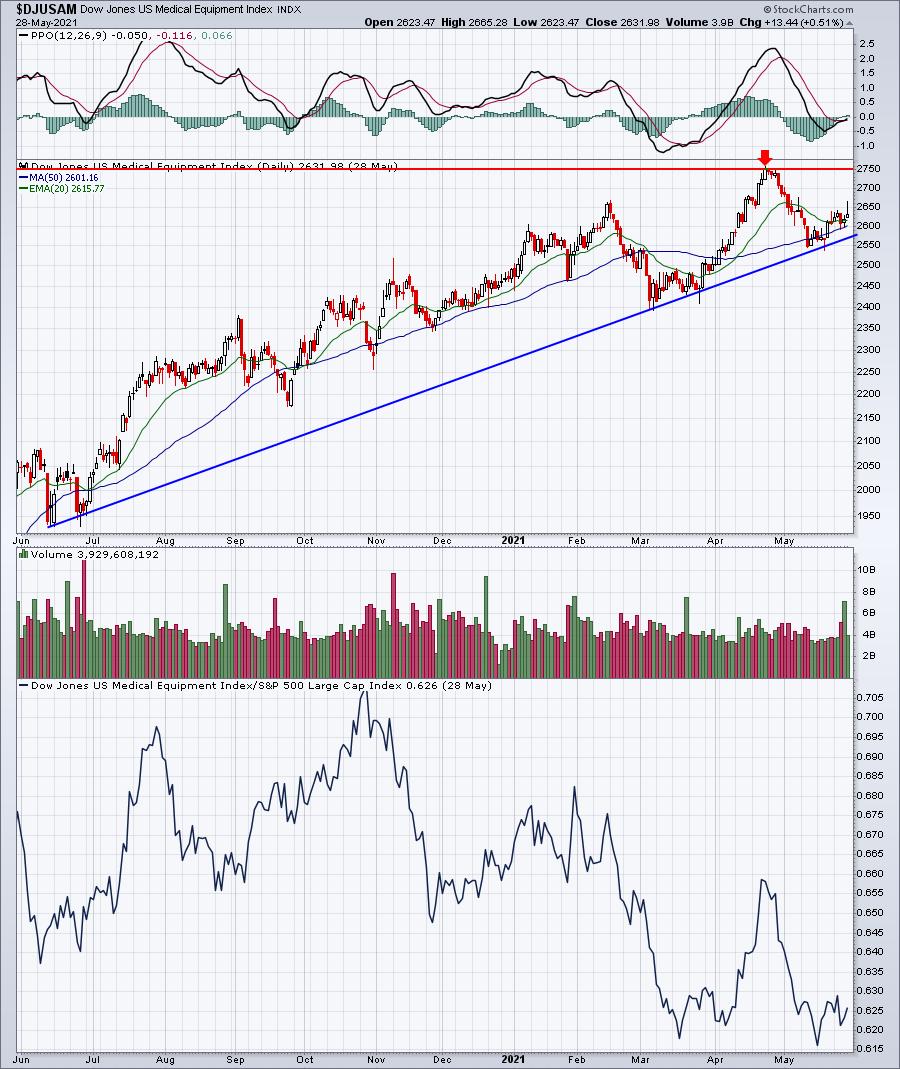
Watch that bottom panel, however. Another relative breakdown would not suggest a trip to test the April 2021 high. Instead, if that breakdown were to occur, I'd be looking in other spots for June relative strength.
Here are the industry groups within the other 10 sectors that typically show June relative strength:
Technology (XLK):
- none
Consumer discretionary (XLY):
- business training, recreational products, clothing & accessories, footwear, broadline retailers, automobiles
Communication services (XLC):
- publishing
Industrials (XLI):
- delivery services
Financials (XLF):
- none
Consumer staples (XLP):
- tires, distillers & vintners
Real estate (XLRE):
- real estate holding, retail REITs
Utilities (XLU):
- none
Energy (XLE):
- none
Materials (XLB):
- nonferrous metals, gold mining
Stock Performance
We've selected our Top 20 seasonal stocks for June from the S&P 500 and NASDAQ 100. Several names represent sectors and industry groups that have been discussed above. Others simply stand out in June on their own.
The stocks this month are as follows:
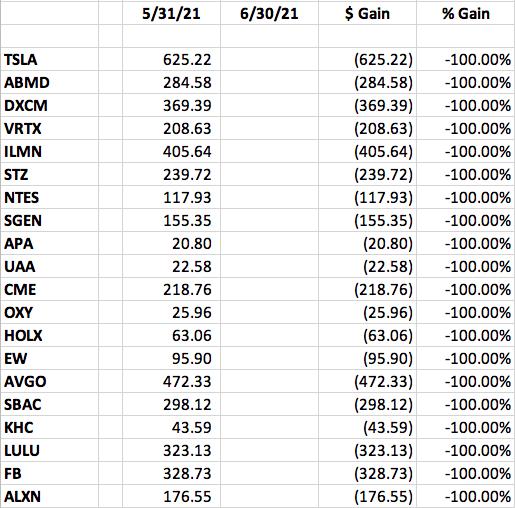
A "Seasonality - June 2021" ChartList will be available for download on our website on Tuesday morning. You must be a StockCharts.com Extra or Pro member to download our ChartLists. Basic members and non-StockCharts.com members can view the charts one at a time. The charts have been annotated with one or two key support levels to watch.
Happy trading!
Tom