
EB Weekly Market Report - Tuesday, May 28, 2024
ChartLists Updated
Here are the ChartLists that were updated over the weekend and have been posted to our website.
- Strong Earnings (SECL)
- Strong Future Earnings (SFECL)
- Raised Guidance (RGCL)
- Bullish Trifecta (BTCL)
- Upcoming Earnings - 4 ChartLists
- Upcoming Earnings - Relative Strength
Weekly Market Recap
Major Indices
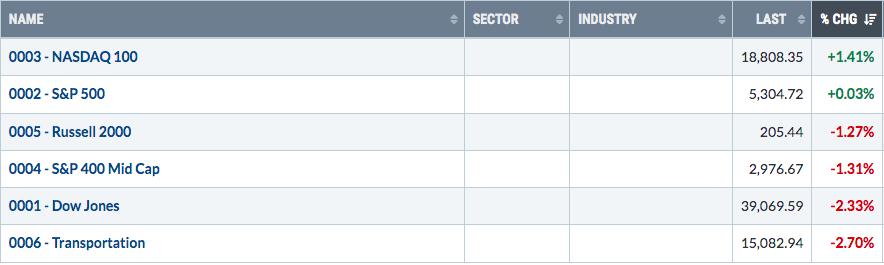
With only the NASDAQ 100 making meaningful ground higher, get ready for all the gingivitis bears (bad breadth) to make some noise again.
Sectors
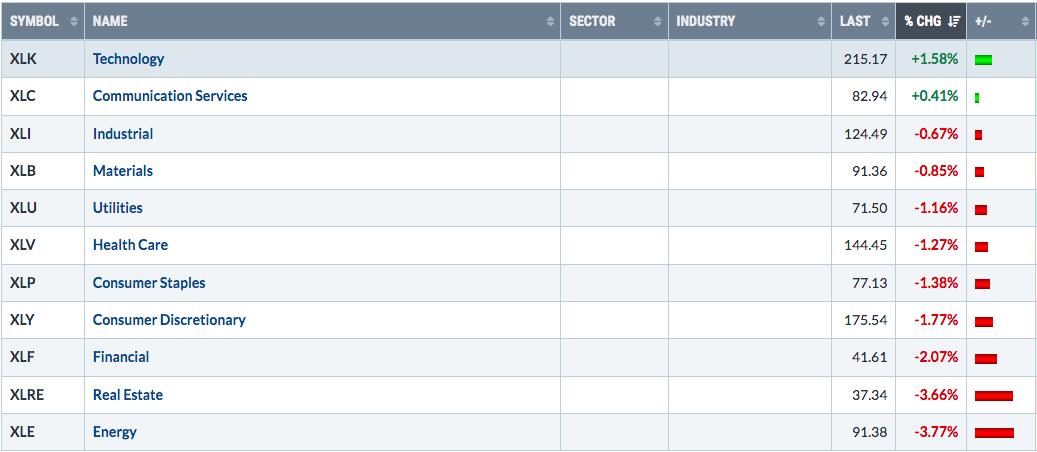
The past two weeks' gains showed tremendously-wide participation, a hallmark of secular bull markets. Last week was all about profit taking, though, as only two sectors jumped, albeit two of our three very aggressive sectors. Consumer stocks were weak again. And energy found its way to the bottom of the sector totem pole as crude oil ($WTIC, -2.34%) fell below $78 per barrel - its lowest weekly close since mid-February.
Top 10 Industries Last Week
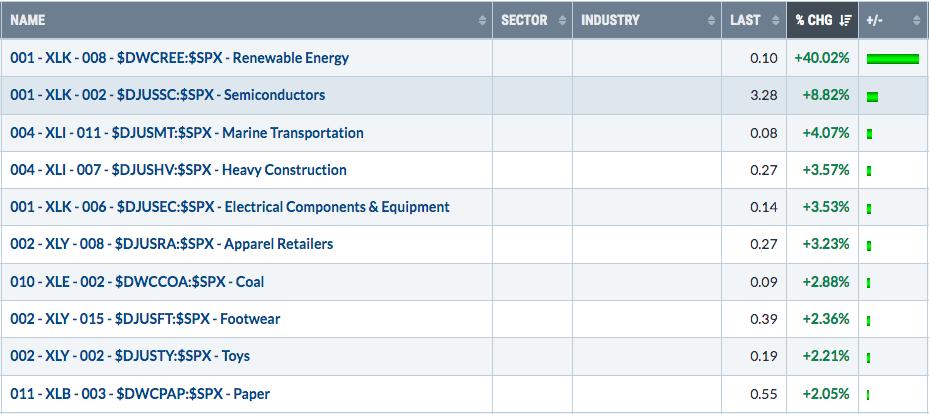
First Solar's (FSLR, +40.06%) gains were the reason for the great showing in renewable energy ($DWCREE). The Invesco Solar ETF (TAN, +11.41%) showed much more modest gains, but still very strong (by the way, TAN closed on Friday at its highest daily close since January 10th). I did like last week's breakout in Enphase Energy (ENPH, +9.50%), however, as further confirmation of strength building in the group. Here's the ENPH chart:
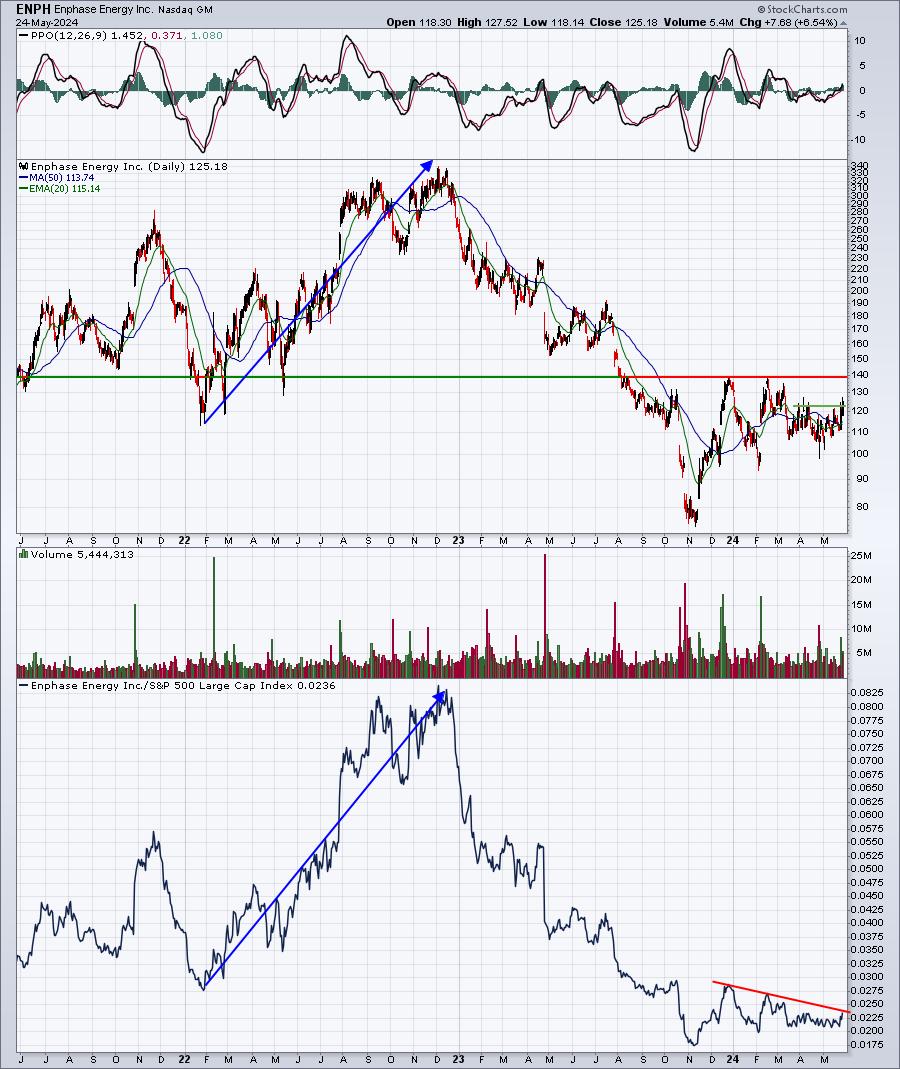
There's still plenty of technical work to do on this chart, so I'm certainly not saying we have a slam dunk on our hands. If you want additional confirmation that a bottom is in, I'd wait for a close above 140 and a breakout on the ENPH:$SPX relative chart in the bottom panel. But ENPH is definitely improving, as evidenced by its first weekly close above its 50-week SMA since early-January 2023 (weekly chart not pictured above).
Bottom 10 Industries Last Week
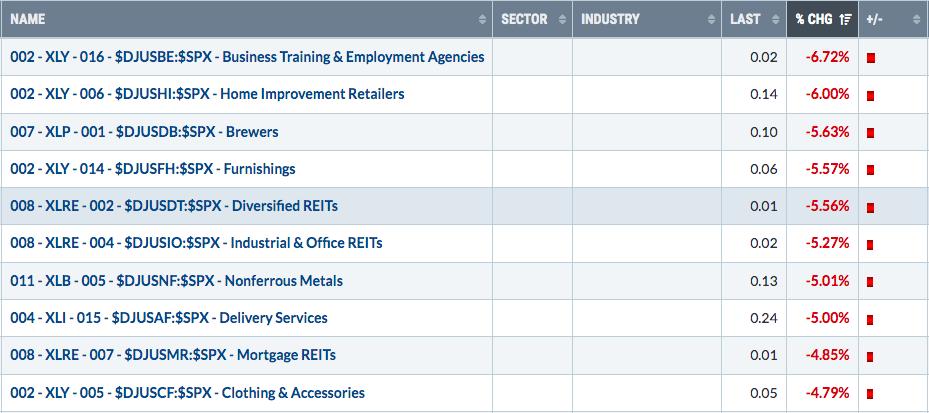
Since 2020, the business training area of the market has tested 120 on its chart 4 times and it looks like we're about to get a 5th:
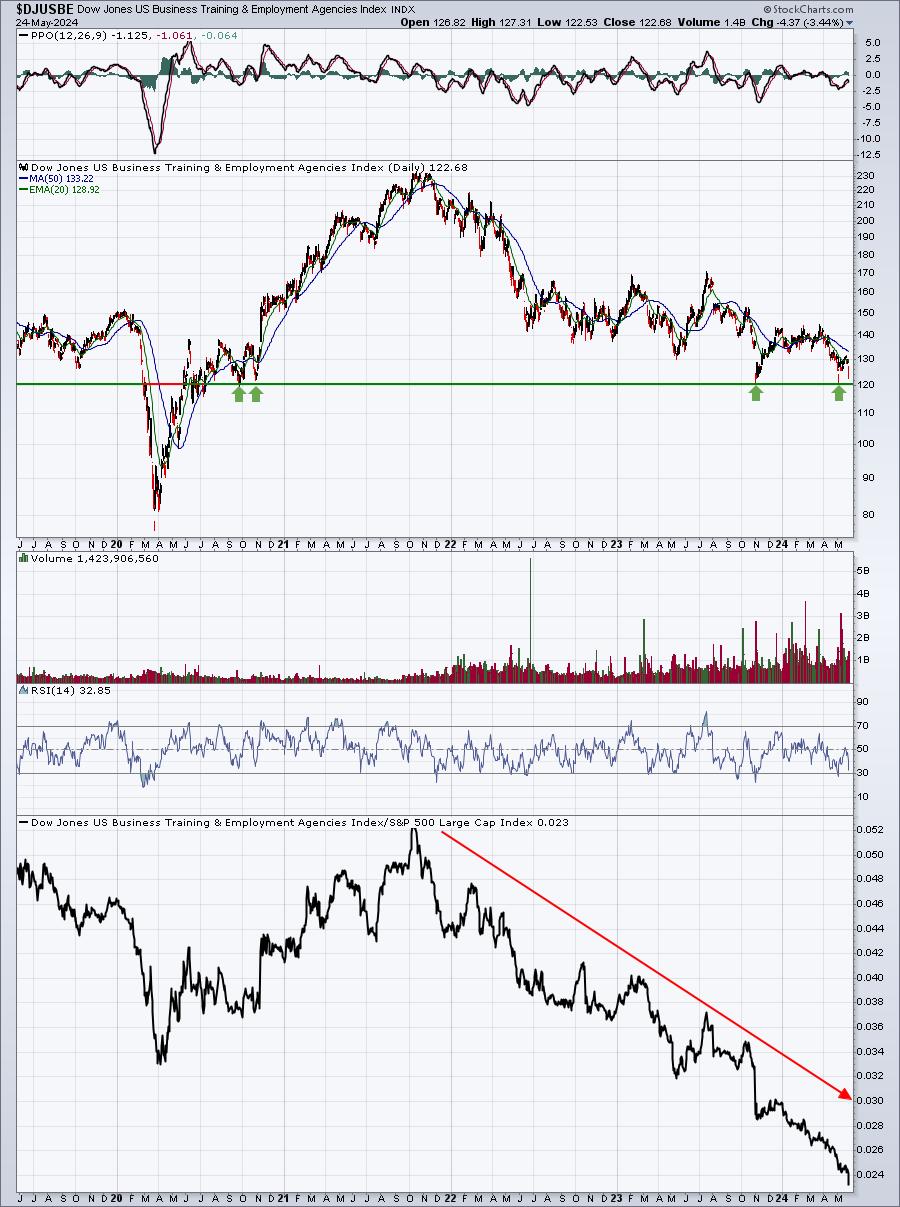
In order to take any kind of shot on the long side with stocks in this industry group, I'd need to see a reversing candle at this 120 level. Please understand that relative strength in this group right now is ABYSMAL. You need to be in the mindset of a "bottom fisher" to be interested AT ALL in this industry.
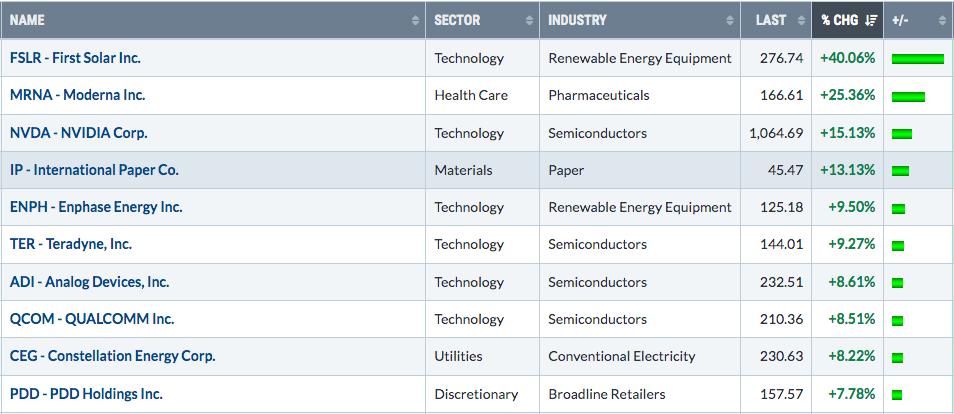
Top 10 Stocks - S&P 500/NASDAQ 100
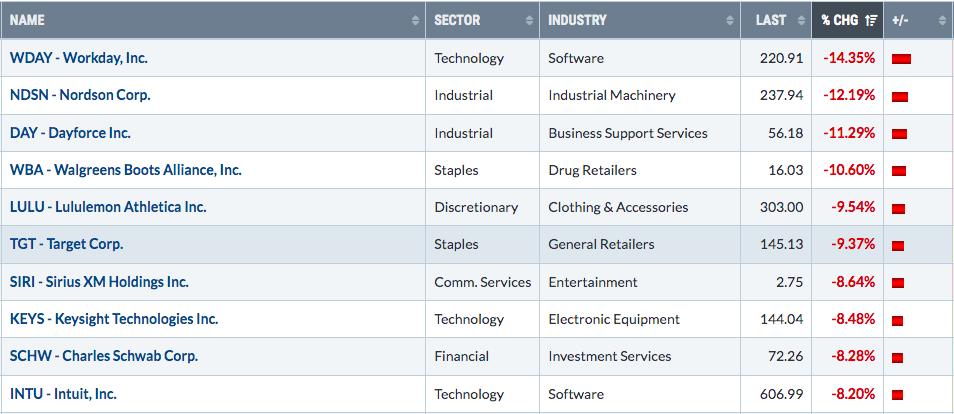
Bottom 10 Stocks - S&P 500/NASDAQ 100
Big Picture
We set new all-time highs last week, before pulling back a bit late in the week. Nothing much has changed in the long-term. We continue to push higher and higher and remain in a secular bull market advance:
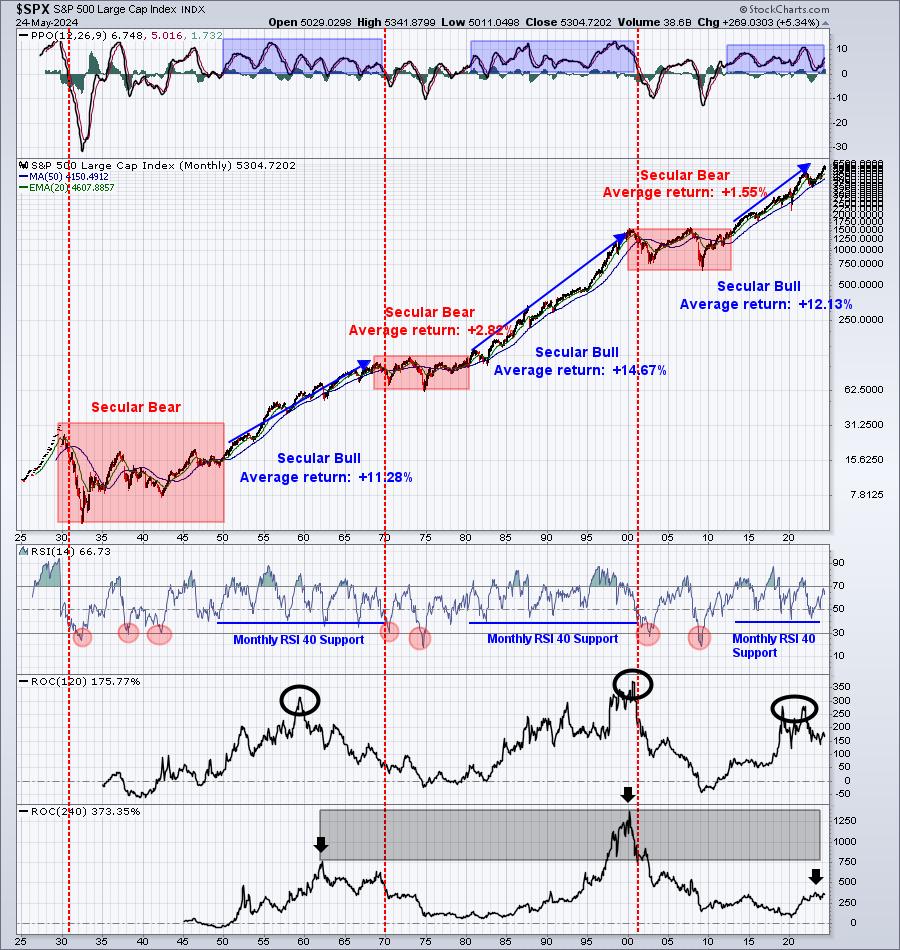
We review this chart every single week for a reason. There is always so much negativity in the news and we hear reasons why stocks have topped and can't go higher. Etch this chart inside your mind and only give up on higher prices ahead when there are an overwhelming number of reasons to do so.
Rotation/Intermarket Analysis
Here's the latest look at our key intraday ratios as we follow where the money is traveling on an INTRADAY basis (ignoring gaps):
QQQ:SPY
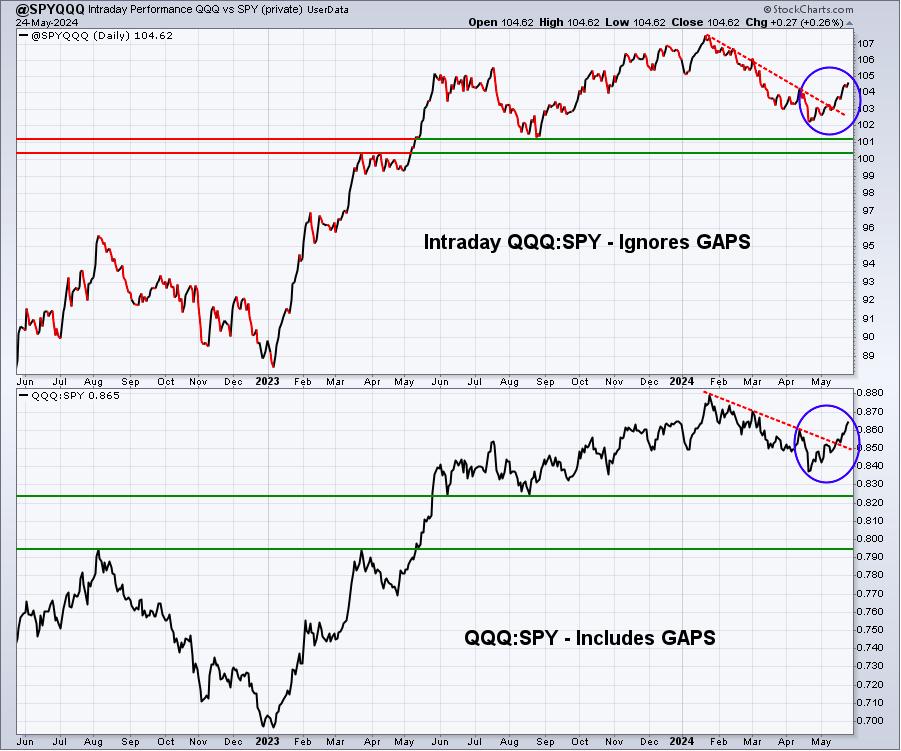
First, a quick reminder. While this chart is named "@SPYQQQ", it's actually the QQQ divided by the SPY. When this line is rising, it means the QQQ is outperforming the SPY ("risk on" environment). When it's falling, it means the SPY is outperforming the QQQ ("risk off" environment). The return to a short-term uptrend (blue circle) illustrates the rotation back into growth during May, breaking the prior relative downtrend line.
IWM:QQQ
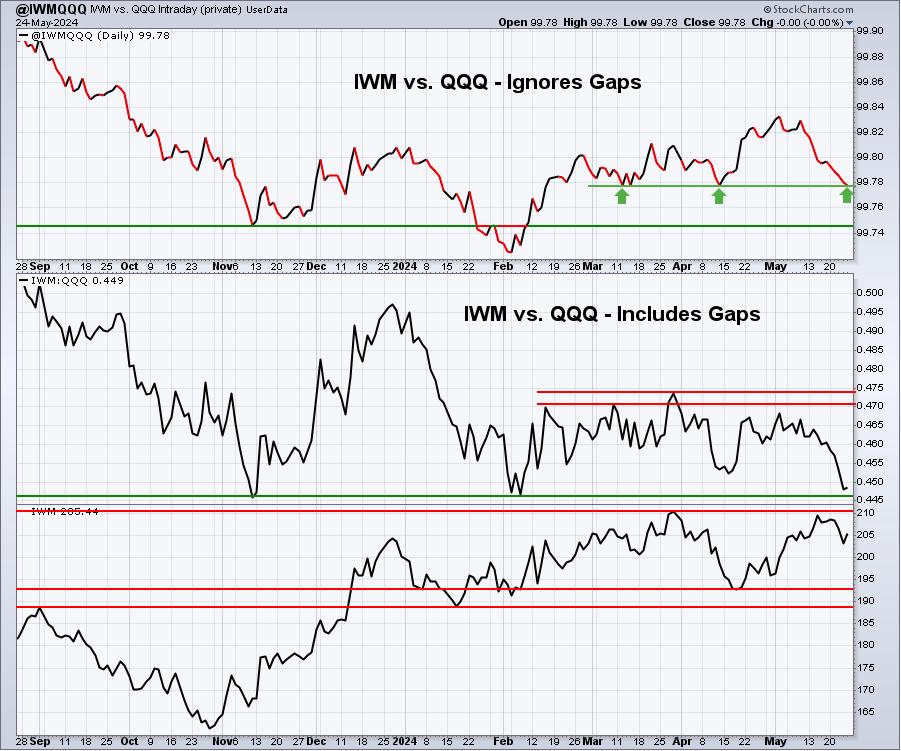
Small caps (IWM) remain a mystery to me. We've seen more signs of disinflation recently, the 10-year treasury yield ($TNX) has fallen from over 4.70% to under 4.50%, and yet more money continues to find its way into the large cap technology arena. Month-to-date, the IWM has climbed nearly 5%, which is nice, but it's underperformed the more growth-oriented NASDAQ 100 (QQQ), which has gained 3 percentage points more than the IWM this month. I always feel much more confident about small caps when the top panel of this IWM:QQQ chart is rising. Clearly, that has not been the case in May. Currently, we're testing a key 3-4 month relative low. I want to see a bounce from this level sooner rather than later.
XLY:XLP
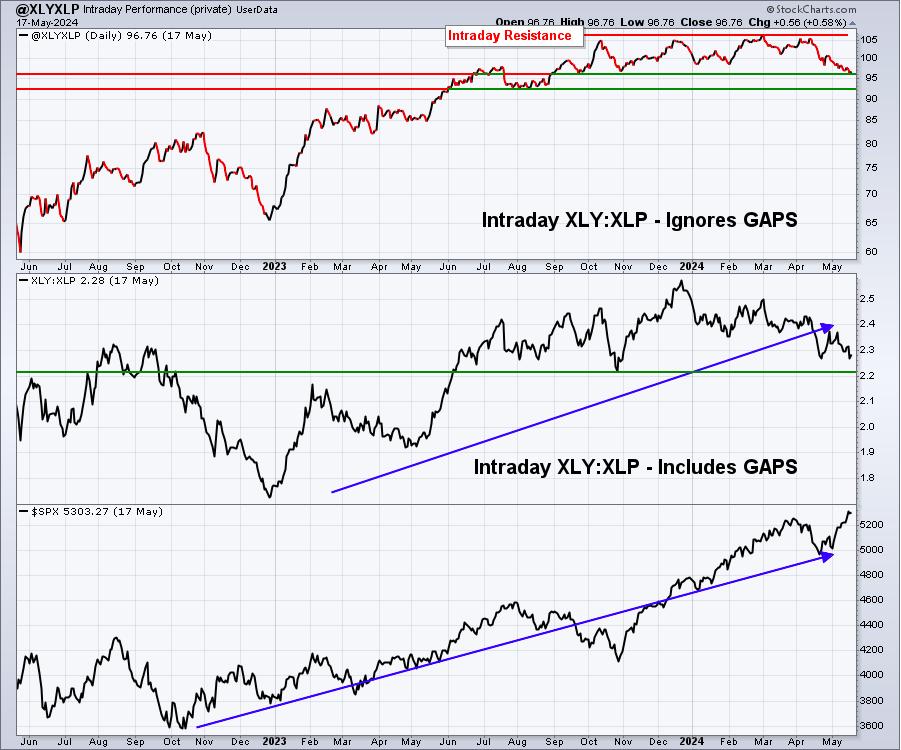
Let me be clear. Consumer discretionary (XLY) has NOT performed well in 2024 and that's an understatement. Among the 11 sectors, it's only outperformed real estate (XLRE) year-to-date and both sectors are down in 2024 - the only two sectors lower. Meanwhile, the other 4 aggressive sectors - technology (XLK, 3rd, +11.97%), communication services (XLC, 1st, +14.46%), financials (XLF, 4th, +11.08%), and industrials (XLI, 6th, +9.55%) - have stepped up to carry the load.
Growth vs. Value
During secular bull markets, growth usually outperforms value. There are periods when this is not the case, but the normal relationship is a rising growth vs. value ratio to accompany higher S&P 500 prices. Here's an updated chart to show how several different growth vs. value relationships have moved since April 2013, the time in which the current secular bull market was confirmed:
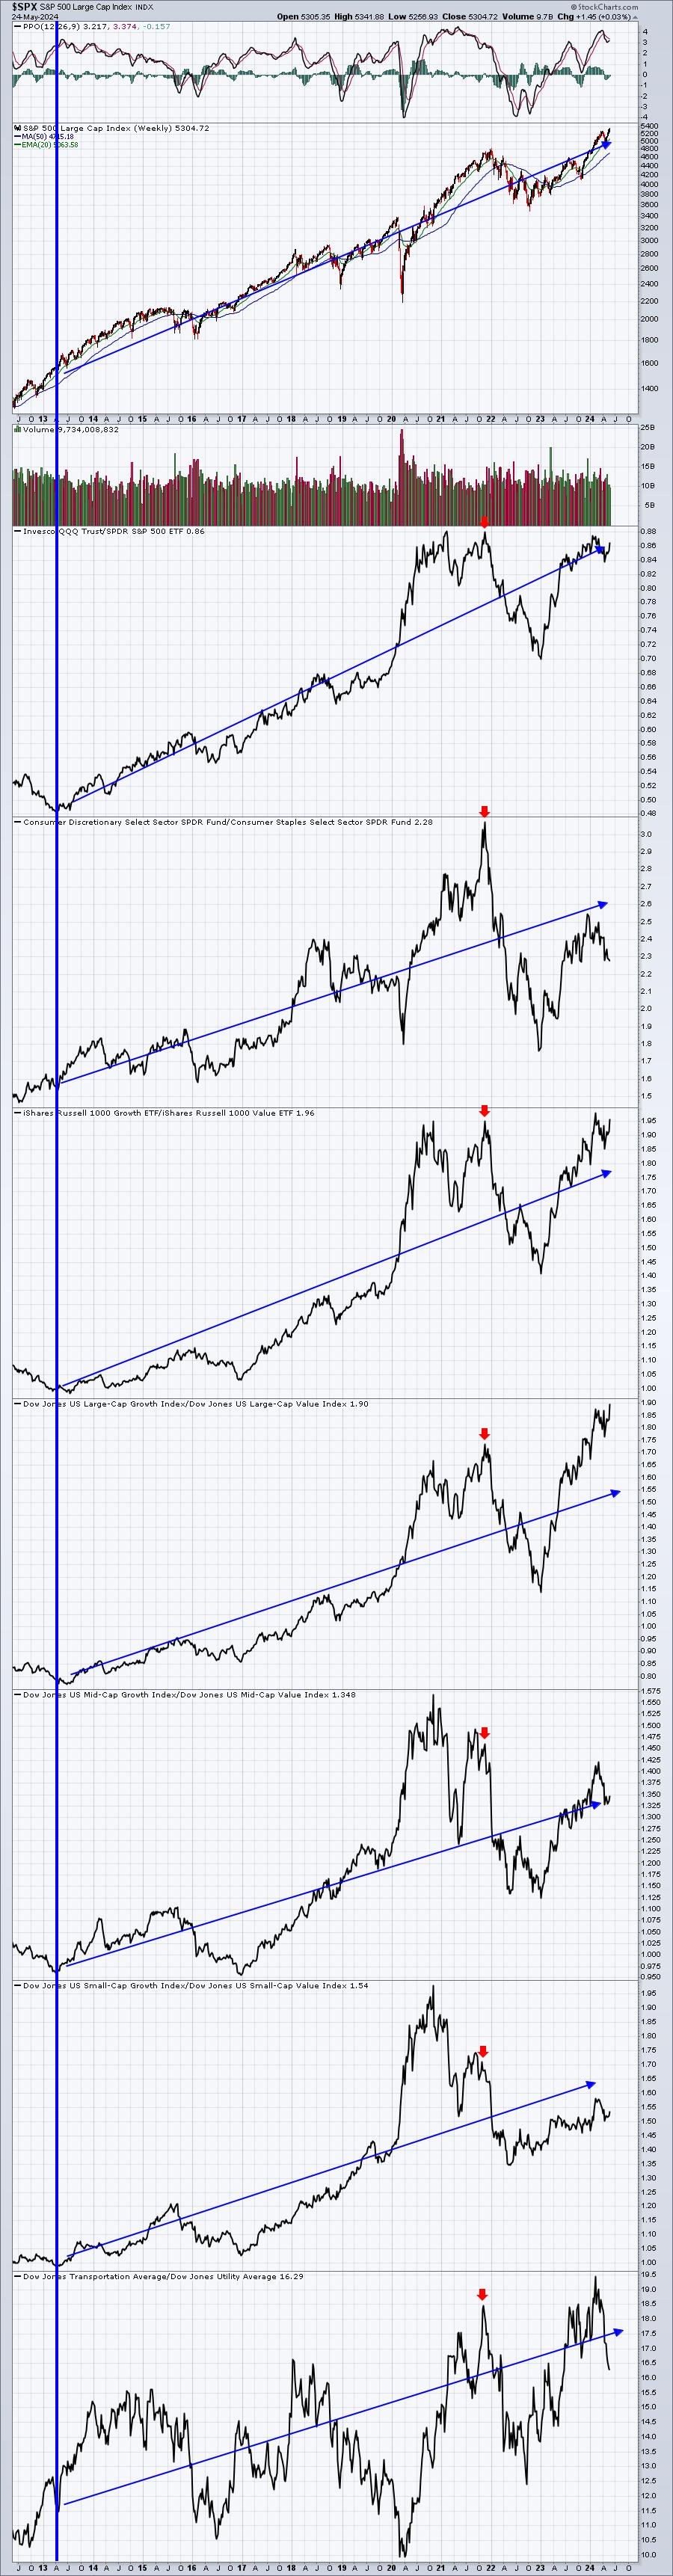
Now if we want to nitpick, we could go back and find periods of time when the S&P 500 was rising and one (or more) of the growth vs. value ratios was falling. Personally, I think that's a mistake. If you look back, though, at Q4 2021, just before a MAJOR stock market top, EVERY ONE of these ratios fell dramatically from the S&P 500 high in November to its high at the beginning of 2022. And the ratios crumbled in January. THIS is the type of behavior that I'd need to see to grow more pessimistic the S&P 500 and believe a top was in place. Many of these ratios are turning back higher with the latest all-time high on the S&P 500. Also, it's worth mentioning that we don't have the sentiment issues now that we had at the end of 2021. We also don't have the extended period of weekly negative divergences, beating us over the head that momentum was slowing. We also don't have the preceding month of rotation heavily skewed towards all 4 defensive sectors like we did in December 2021. I just pointed out that 4 of the top 6 sectors year-to-date are offensive groups. Over the past month, technology (XLK) is our best sector. Why in the world would Wall Street be moving into technology ahead of a major correction or bear market? It simply wouldn't happen. So while we can expect pullbacks from time to time, I don't believe ANY of them will stick long enough for a bear market - even a cyclical bear market - to develop.
Analysts and technicians LOVE to try to call market tops. Many are very successful at it too, having called 25 of the last 2 bear markets correctly (sarcasm). If I see really significant warning signs developing simultaneously, trust me, you'll be the first to know. But moving away from stocks at every individual cautious signal KILLS your long-term stock market performance. You have to overcome, or ignore, everyone else's fear and pay attention to the truly bearish signals that engulf the market simultaneously.
We are going to have another absolutely HORRIFIC bear market ahead, but I still see it as many years away. In the meantime, let's build our wealth.
Divergences
Negative weekly divergences were a major concern as 2021 ended and were mentioned as one of the reasons I felt strongly that a potential bear market would develop in 2022 - before it happened. The weekly PPO was making lower highs, while stock prices kept climbing in the 2nd half of 2021. This is what it looked like on the S&P 500:
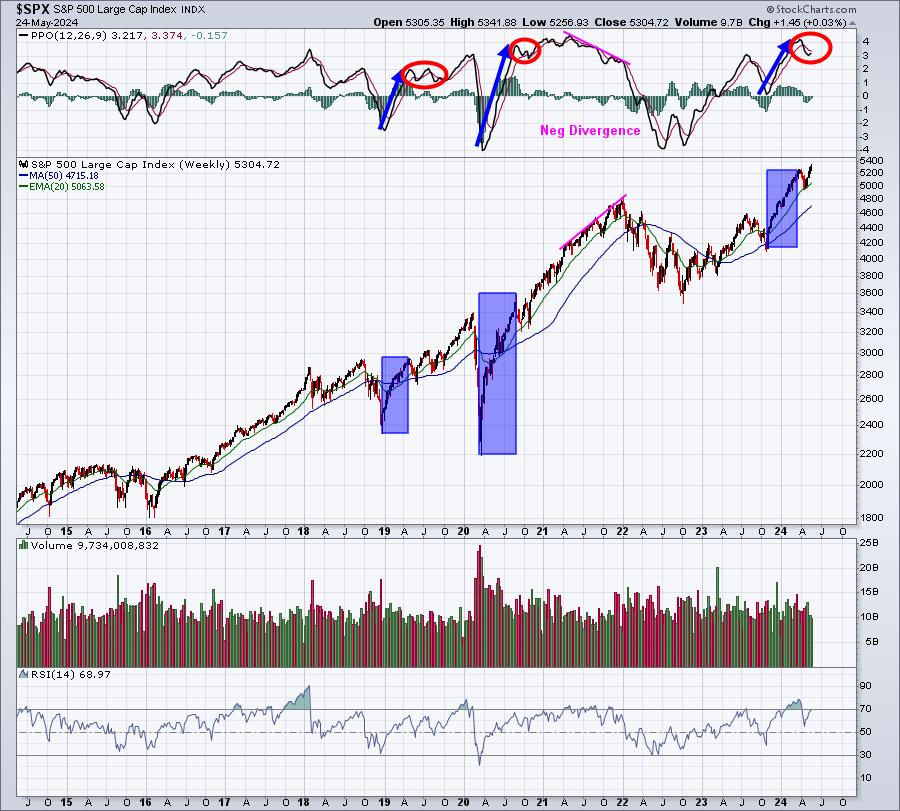
I believe the S&P 500 will move up another 3-4% before a more significant period of selling arrives in late summer as the Presidential Election race heats up and more uncertainty is cast upon the stock market. The Presidential Election cycle would support this notion, particularly in the mid-August to late-September time frame. Previous rallies, similar to one we've seen in May, have usually seen further gains, or perhaps consolidation, prior to a more sustained rally down the road. I wouldn't be surprised to see some back and forth over the next two months, but with a net gain. I expect another nice rally into July as the market historically performs well heading into earnings season.
Trade Setup
Since beginning this Weekly Market Report in early September, I've discussed the long-term trade candidates below that I really like. Generally, these stocks have excellent long-term track records and many pay nice dividends that mostly grow every year. Only in very specific cases (exceptions) would I consider a long-term entry into a stock that has a poor or limited long-term track record:
- JPM
- BA
- FFIV
- MA
- GS
- FDX
- AAPL
- CHRW
- JBHT
- STX
- HSY
- DIS
- MSCI
- SBUX
- KRE
- ED
- AJG
Keep in mind that our Weekly Market Reports favor those more interested in the long-term market picture. Therefore, the list of stocks above are stocks that we believe are safer (but nothing is ever 100% safe) to own with the long-term in mind. Nearly everything else we do at EarningsBeats.com favors short-term momentum trading, so I wanted to provide an explanation of what we're doing with this list.
I don't have any additions to list "long-term" list at this time.
Looking Ahead
Upcoming Earnings:
Q1 earnings continue to wind down, but we will see a pick up in the number of software companies reporting this week. I've identified what I believe are key companies that will report this week, with their respective market caps in parenthesis. This is NOT a list of ALL companies reporting this week, so please be sure to check for earnings of any companies that you own or add. Any companies in BOLD represent stocks in one of our Portfolios:
- Monday: Markets closed - Memorial Day holiday
- Tuesday: BNS ($58 billion)
- Wednesday: CRM ($270 billion), A ($44 billion), PSTG ($19 billion)
- Thursday: COST ($353 billion), MRVL ($65 billion), VEEV ($33 billion), NTAP ($24 billion)
- Friday: None
Key Economic Reports:
- Monday: Markets closed - Memorial Day holiday
- Tuesday: Case-Shiller home price index, consumer confidence
- Wednesday: None
- Thursday: Initial jobless claims, Q1 GDP (2nd estimate), pending home sales
- Friday: PCE price index
Historical Data
I'm a true stock market historian. I am absolutely PASSIONATE about studying stock market history to provide us more clues about likely stock market direction and potential sectors/industries/stocks to trade. While I don't use history as a primary indicator, I'm always very aware of it as a secondary indicator. I love it when history lines up with my technical signals, providing me much more confidence to make particular trades.
Below you'll find the next two weeks of historical data and tendencies across the 3 key indices that I follow most closely:
S&P 500 (since 1950)
- May 27: +57.71%
- May 28: +5.42%
- May 29: +27.35%
- May 30: +54.27%
- May 31: +27.79%
- Jun 1: +54.02%
- Jun 2: +36.90%
- Jun 3: +3.68%
- Jun 4: -1.79%
- Jun 5: +43.13%
- Jun 6: +56.57%
- Jun 7: +3.97%
- Jun 8: -18.56%
- Jun 9: -63.85%
NASDAQ (since 1971)
- May 27: +160.41%
- May 28: +38.94%
- May 29: -37.73%
- May 30: +42.59%
- May 31: -8.29%
- Jun 1: +73.91%
- June 2: +131.50%
- Jun 3: -71.71%
- Jun 4: +81.57%
- Jun 5: +97.21%
- Jun 6: -12.84%
- Jun 7: +19.62%
- Jun 8: -18.14%
- Jun 9: -49.37%
Russell 2000 (since 1987)
- May 27: +209.58%
- May 28: +2.86%
- May 29: +24.64%
- May 30: +36.13%
- May 31: +18.28%
- Jun 1: +113.13%
- June 2: +179.79%
- Jun 3: -43.34%
- Jun 4: +54.73%
- Jun 5: +77.47%
- Jun 6: +2.16%
- Jun 7: +44.43%
- Jun 8: +1.50%
- Jun 9: -63.05%
The S&P 500 data dates back to 1950, while the NASDAQ and Russell 2000 information date back to 1971 and 1987, respectively.
The S&P 500, during May 26 through June 6, has produced annualized returns of +34.45% since 1950.
Here are the May 26 through June 5 annualized returns for the NASDAQ and Russell 2000:
- NASDAQ: +57.08%
- Russell 2000: +78.26%
Final Thoughts
We had another solid week last week and the secular bull market lives on as new all-time highs were seen on several key indices. The bearish historical tendencies that run from May 6 through May 25 will end this week. Thus far, we really haven't seen much typical, mid-May market weakness. We do still have a week to go, however, before moving into a much more favorably historical period from May 26 through June 5.
Here are several things to consider in the week ahead:
- Interest Rates. Has the 10-year treasury yield ($TNX) topped? I believe the 5% level will be a top, but that doesn't mean we won't see higher yields in the near-term, possibly even the intermediate-term. I'm watching the 4.53%-4.54% yield resistance. If that's cleared on a closing basis, then we could see a return to the 4.70% area.
- Semiconductors ($DJUSSC). They're trading at an all-time high, but is there more gas in the tank? What I can tell you is that the DJUSSC loves the second month of each calendar quarter (February, May, August, and November). May and November are its best two months. We're about to move into June. Do we see rotation in leadership ahead?
- Earnings. A number of "2nd tier" software companies will be reporting this week and software ($DJUSSW) has been lagging the S&P 500 since topping on a relative basis at the end of January. Historically, this industry prefers the first month of each calendar quarter (January, April, July, and October). Will we need to wait for July for this group to reignite? Or can we get started now? A lot will depend on this week's earnings.
- Inflation. Well, we remain on inflation watch. On Friday, we'll get the latest PCE Price index, a reading that the Fed watches closely. If it's tame, we could see another solid rally into month end.
- Renewable energy. First Solar (FSLR) lit it up last week and Enphase Energy (ENPH) is showing signs of strengthening. If we're looking for an area that might step up, this is one to consider. Spring and early summer do tend to be strong seasonal periods for ENPH, averaging 16.3% from May through July. May has certainly been true to form, but will it continue the next two months?
Feedback
If you'd like to share your thoughts on our Weekly Market Report, positive or negative, you can reach us at "[email protected]".
Happy trading!
Tom