
EB Monthly Seasonality Report - June 2026
A Look Back At May Stocks:
Last month, we released our list of the top 24 large, mid, and small cap stocks that had strong historical track records during the month of May. Here are how they performed in May 2026, in order of best to worst performer:
- MU: +87.76%
- AMD: +45.59%
- MTSI: +29.48%
- DY: +23.16%
- ON: +19.65%
- CROX: +16.37%
- DCH: +16.29%
- TTMI: +9.80%
- AVGO: +7.03%
- LYV: +6.63%
- NVDA: +5.80%
- TTWO: +4.87%
- KTOS: +1.71%
- LQDT: +1.57%
- EA: -0.32%
- CELH: -0.89%
- ECPG: -3.43%
- MTZ: -3.98%
- TMUS: -4.08%
- ADUS: -5.38%
- NFLX: -8.11%
- MCK: -8.93%
- EPAM: -9.95%
- SRPT: -14.42%
The percentages represent the returns from the April 30th close to the May 31st close. The average performance of the 12 large cap stocks (+12.16%) crushed the S&P 500 (+5.26%) and even exceeded the NASDAQ 100 (QQQ, +10.57%). The average performance of the 12 mid and small cap stocks (+5.86%) beat the small cap Russell 2000 (IWM, +4.48%) as well.
May was a very good month for our seasonal stocks.
S&P 500 June Performance
The annualized performance of the S&P 500 (since 1950) during the month of June is +2.89%, though it's been much stronger during the current secular bull market. Over the past 14 years, the S&P 500 has produced annualized returns of 15%+ in June. Since 1950, though, the S&P 500 has closed higher in June 42 times out of the last 76 years. In terms of annualized performance on the S&P 500, June ranks 9th out of 12 calendar months.
Here's a breakdown of the historically strong and weak performance periods throughout June on the S&P 500 since 1950. The %'s shown are the ANNUALIZED returns for the period:
- June 1-6: +33.59%
- June 7-11: -16.42%
- June 12-17: +11.01%
- June 18-27: -19.26%
- June 28-30: +28.14%
Sector Performance
Last month, I pointed out that technology (XLK) and communication services (XLC) had been the clear relative leaders among sectors during the month of May since this secular bull market was confirmed in 2013. They both had outperformed the S&P 500 about 80% of Mays since 2013, but the average relative outperformance had been stronger among technology stocks. The XLC was relatively flat in May, but the XLK was very strong again, helping to lead our major indices to fresh new all-time highs.
For June, both technology (XLK) and consumer discretionary typically perform well. I've discussed the XLK at length the past several months, so I want to focus on the XLY this month as it finally closed above its April/May double top, which very well could lead to further gains in June:
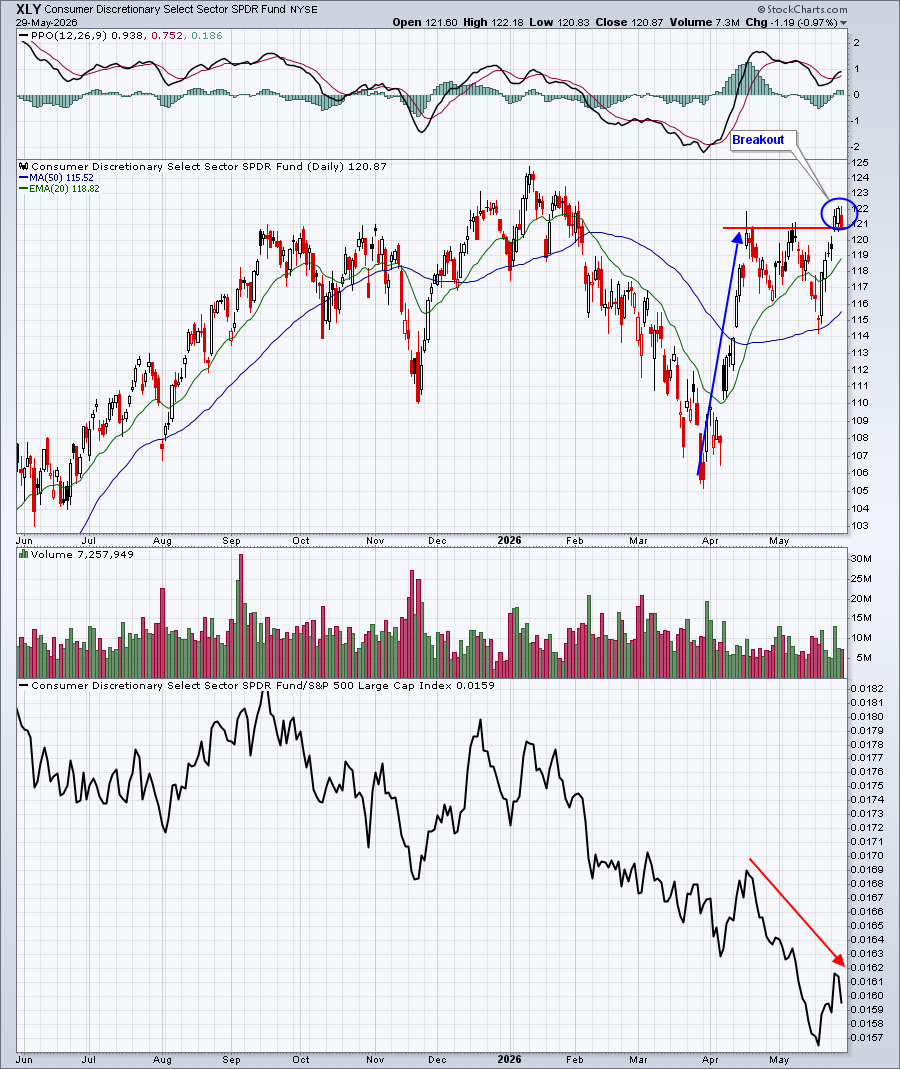
Despite the huge rally in the XLY in April, its relative strength has tumbled to fresh new lows in May. That's been the case with just about every sector other than technology. Technology has been so strong, other sectors, even if they move higher, still show relative weakness.
Industry Performance
Last month, I pointed out that, despite significantly overbought conditions, semiconductors loved the month of May. And, right on cue, semiconductors moved to another level of overbought during May as the rally continued. There are negative divergences in play on their daily chart as we open June, so this could be an extremely volatile month for that group - especially since we're now in the 3rd month of the calendar quarter, which typically isn't a great one for the semis. Since 2013, the Dow Jones U.S. Semiconductor Index ($DJUSSC) has gained, on average, the following during the various months of the calendar quarter:
- 1st calendar month (Jan, Apr, Jul, Oct): +8.61%
- 2nd calendar month (Feb, May, Aug, Nov): +17.76%
- 3rd calendar month (Mar, Jun, Sep, Dec): +4.28%
My belief is that once we've made our way through earnings season, the group tends to see a wave of profit taking.
So......if money does rotate away from semiconductors, what groups could benefit? Well, consumer discretionary was mentioned as a top sector in June and there are a few industries in that space like autos ($DJUSAU), footwear ($DJUSFT), and specialty retail ($DJUSRS) that perform well historically during June. But I want to focus on a technology group that just broke above key resistance - software ($DJUSSW). During this secular bull market, software has actually been the best-performing area within technology during June. And now the group gets a breakout just before a seasonally-strong month:
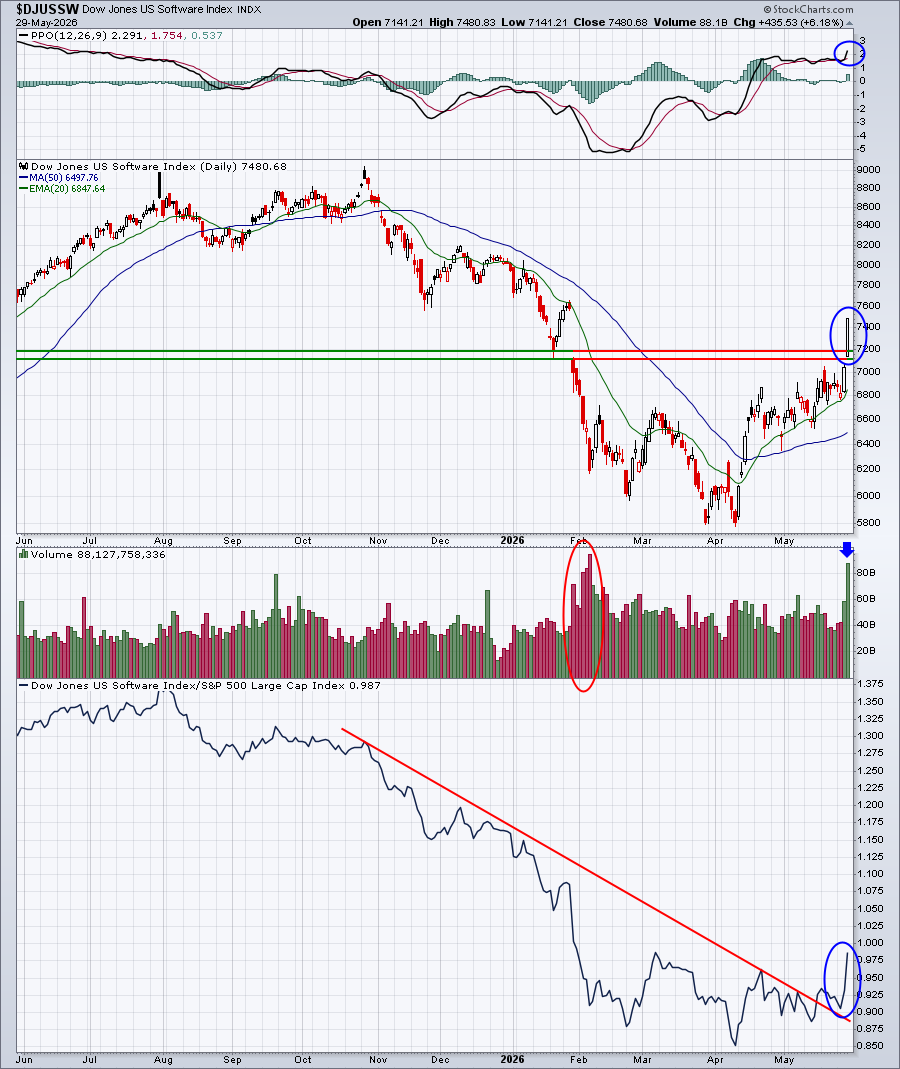
All technical signs are pointing to a bigger rally ahead for the software space. I really like the group. Adding a strong seasonal period to the mix only adds to the bullish breakout. Volume on Friday EXPLODED to confirm the breakout. I believe the worst is behind this group and it's set to take over a leadership role. I expect June to be strong for software and could really help our major indices remain afloat, if the semiconductors do, in fact, take a breather.
Here are all industry groups that tend to perform much better than the benchmark S&P 500 during June, broken down by sector:
Technology (XLK):
- software, semiconductors
Consumer Discretionary (XLY):
- automobiles, footwear, specialty retail, business training & employment agencies, durable household products, toys, broadline retail, recreational products
Communication Services (XLC):
- publishing
Industrials (XLI):
- delivery services
Financials (XLF):
- none
Health care (XLV):
- none
Consumer staples (XLP):
- none
Real estate (XLRE):
- none
Utilities (XLU):
- none
Energy (XLE):
- none
Materials (XLB):
- nonferrous metals
Stocks for June
A "Seasonality - June 2026" ChartList (annotated with 1 or 2 support levels to watch) has been created and should be available Monday on our website.
You must be a StockCharts.com Extra or Pro member to download our ChartLists. Basic members and non-StockCharts.com members can view the charts one at a time.
Happy trading!
Tom