
EB Monthly Seasonality Report - June 2023
A Look Back At May Stocks:
One month ago, we provided a list of the Top 20 stocks that had strong historical track records during the month of May. Here are how they performed in May 2023 (through the May 31st close):
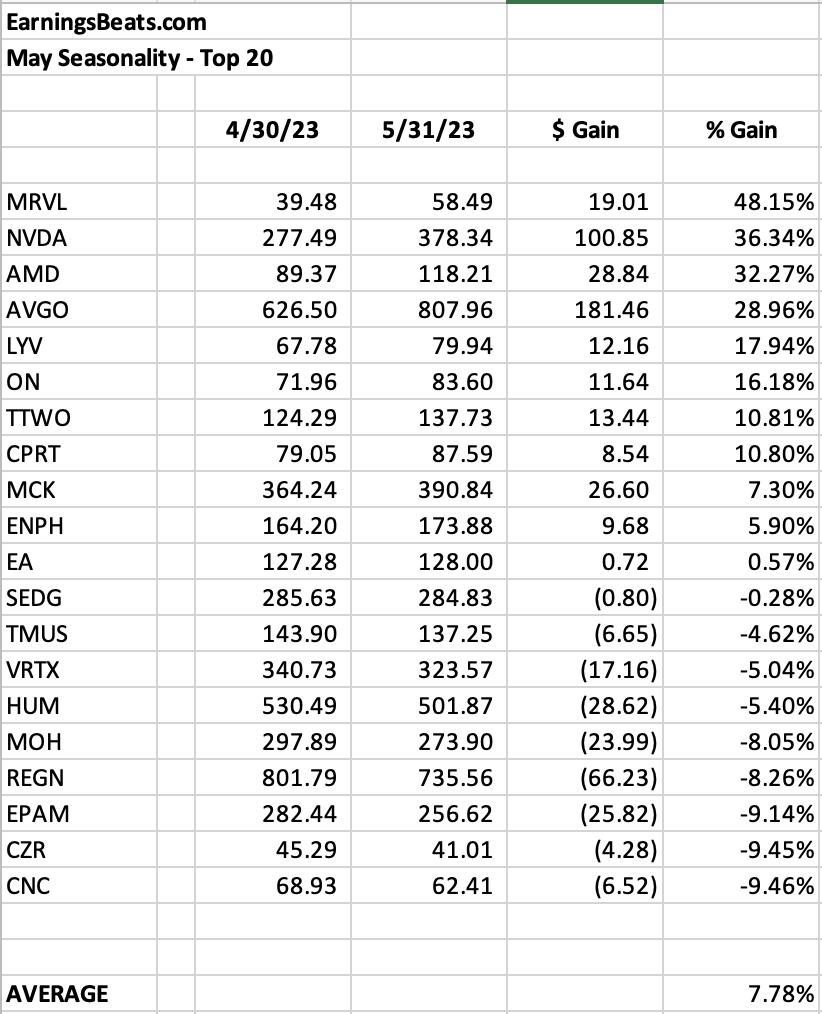
The percentages represent the returns from the April 30th close to the May 31st close. The average performance of +7.78% crushed the S&P 500 performance (+0.46%), but was in line with the NASDAQ performance (+7.88%). Our Top 20 Seasonality stocks had a superb month, led by the big technology names, especially those in semiconductors ($DJUSSC).
The top 4 performers were in semiconductors, and 5 of the top 6, but Marvel Technology (MRVL) was the HUGE winner. Check out the current chart:
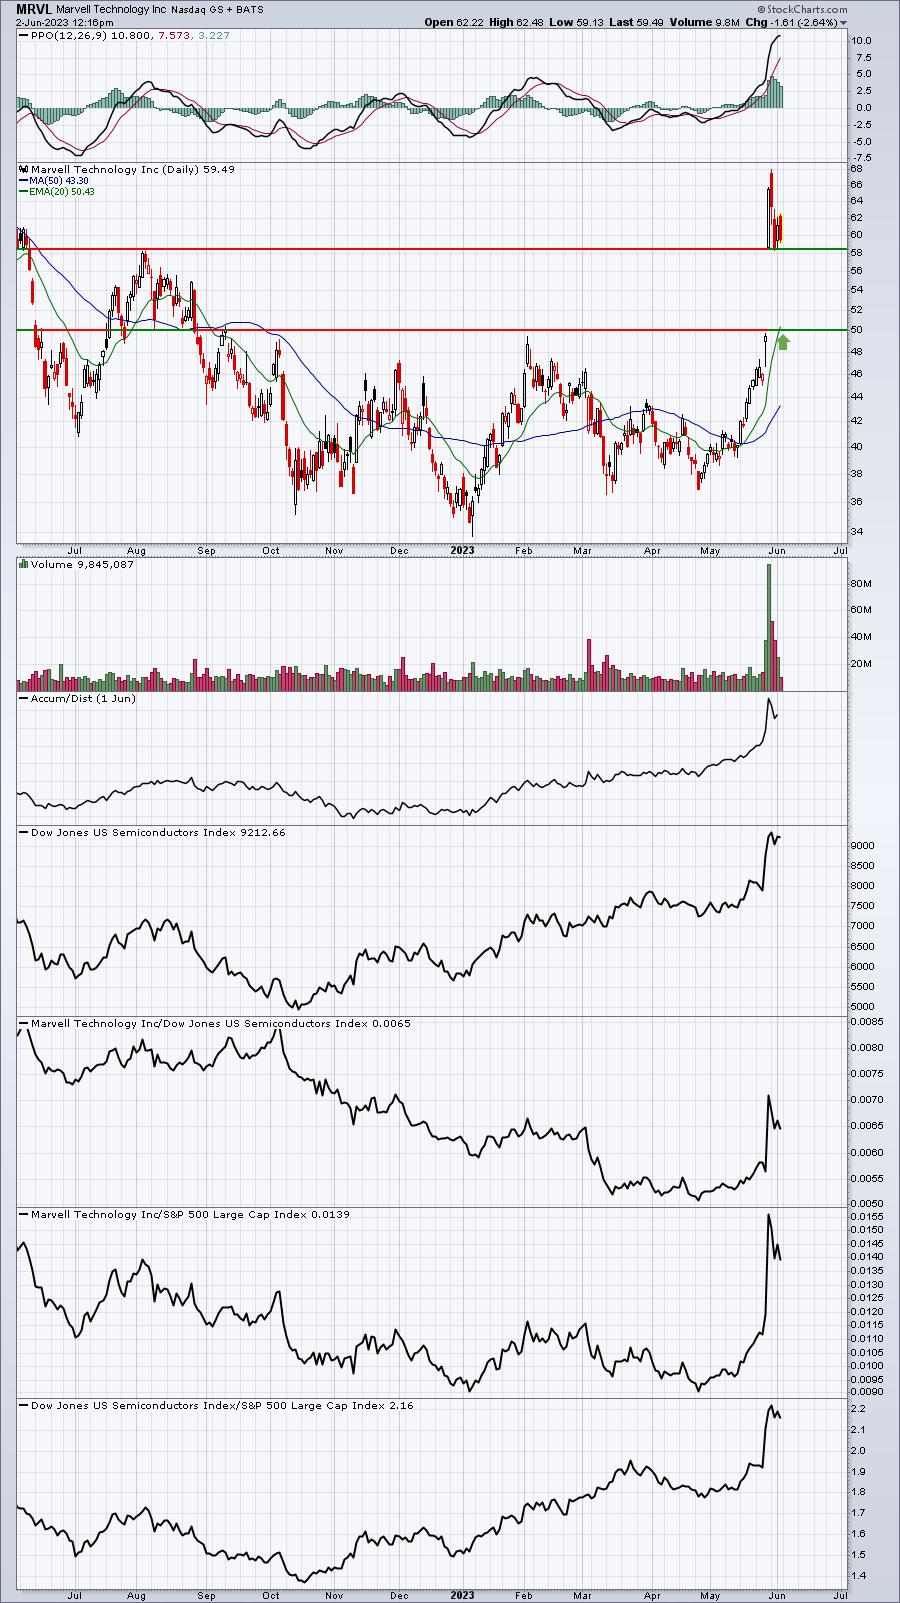
The short-term question for MRVL is whether it can hold onto the top of gap support. If that fails, MRVL could see short-term weakness down to the rapidly-rising 20-day EMA.
S&P 500 June Performance
I hope you didn't "Go Away in May". I poked holes in that strategy throughout the month of May, especially when it came to growth stocks. And those stocks were exactly what led us higher. But now it's June, so what might this month hold in store for us?
Here's a breakdown of the annualized performance of the S&P 500 (since 1950) during the month of June:
- June 1-6: +30.60%
- June 7-11: -18.09%
- June 12-17: +8.44%
- June 18-27: -21.31%
- June 28-30: +26.19%
June is typically an underperforming month for the S&P 500, but it does clearly have strength at the very beginning and very end of the month. June has gained ground just 39 of 73 years since 1950, which is only better than September. June's annualized return since 1950 is +0.56% and ranks 9th among all calendar months in terms of annualized return.
It's worth pointing out that the small cap IWM (Russell 2000 ETF) has outperformed the large cap SPY (S&P 500 ETF) during 73% of Junes since this secular bull market began in 2013. Its average outperformance is +0.9%. Both of these are high water marks for the IWM vs. the SPY throughout all calendar months. In other words, there's a lot of history that supports the notion of small cap outperformance during June. If we stretch this seasonality back two decades, the IWM continues to perform best, on a relative basis, during the month of June.
Sector Performance
Before we look at individual stocks, let's get an overview of how the various sectors and industries have performed during June (and July) over the past decade (during this secular bull market):
Sector Heat Map:
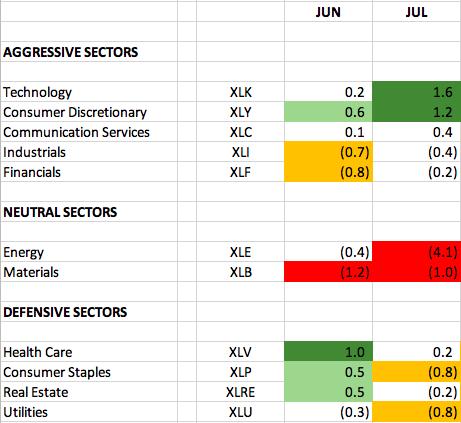
The numbers reflect how much a sector, on average, outperforms or underperforms the S&P 500 over the past 10 years. The dark green-shaded areas show significant outperformance (1.0 or greater). The light green-shaded areas show solid outperformance (from 0.5 to 1.0). The yellow-shaded areas show underperformance (-0.5 to -1.0). The red-shaded areas show significant underperformance (-1.0 or greater). Where there is no shading, there tends to be more neutral performance (-0.4 to 0.4).
Leadership in June has tended to come from consumer discretionary (XLY) - especially when we consider what follows in July. Here's what the XLY looks like as we enter June:
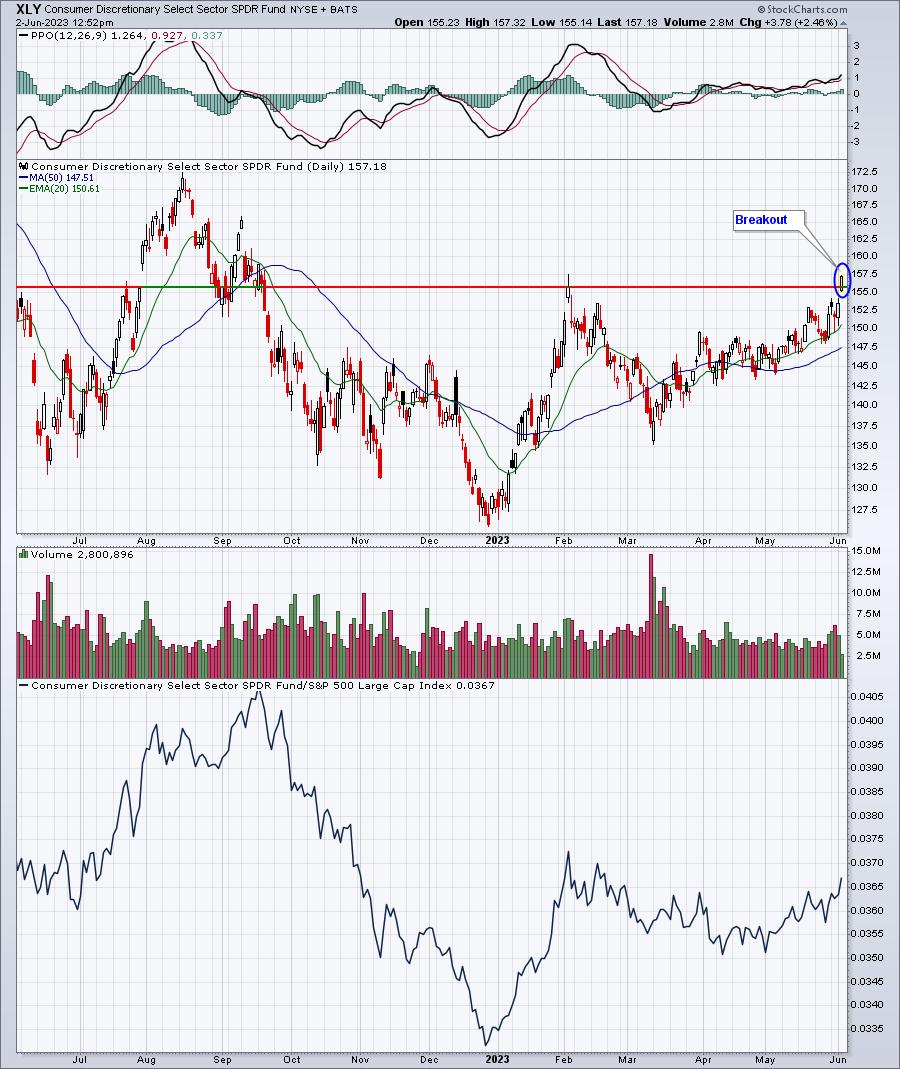
The XLY has been trending higher for nearly 3 months. If we can establish a breakout just before two of the best calendar months of the year for the XLY, that would be a major bonus.
Industry Performance
Let's take a look at the industry heat map within consumer discretionary to drill down to the best seasonal strength in June and July over the past decade among the various industry groups (relative to the S&P 500):
Consumer Discretionary (XLY):
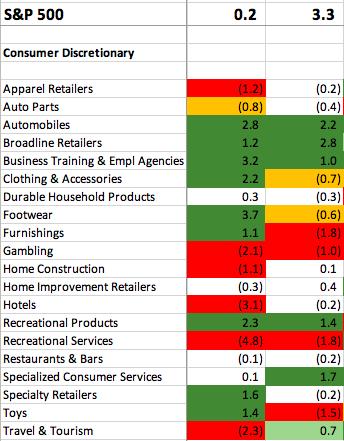
The June/July historical strength in consumer discretionary has been led by several groups, but most notably automobiles ($DJUSAU).
Here are industry groups (within sectors other than consumer discretionary) that tend to perform much better than the benchmark S&P 500 during June:
Technology (XLK):
- software, renewable energy
Communication Services (XLC):
- publishing
Industrials (XLI):
- delivery services
Financials (XLF):
- none
Health care (XLV):
- biotech, medical equipment, health care providers
Consumer staples (XLP):
- nondurable household products
Real Estate (XLRE):
- none
Utilities (XLU):
- water
Energy (XLE):
- none
Materials (XLB):
- none
Stocks for June
We've selected our Top 20 seasonal stocks for June. Several names represent sectors and industry groups that have been discussed above. Others simply stand out in June based on their own historical track record.
The stocks this month are as follows:
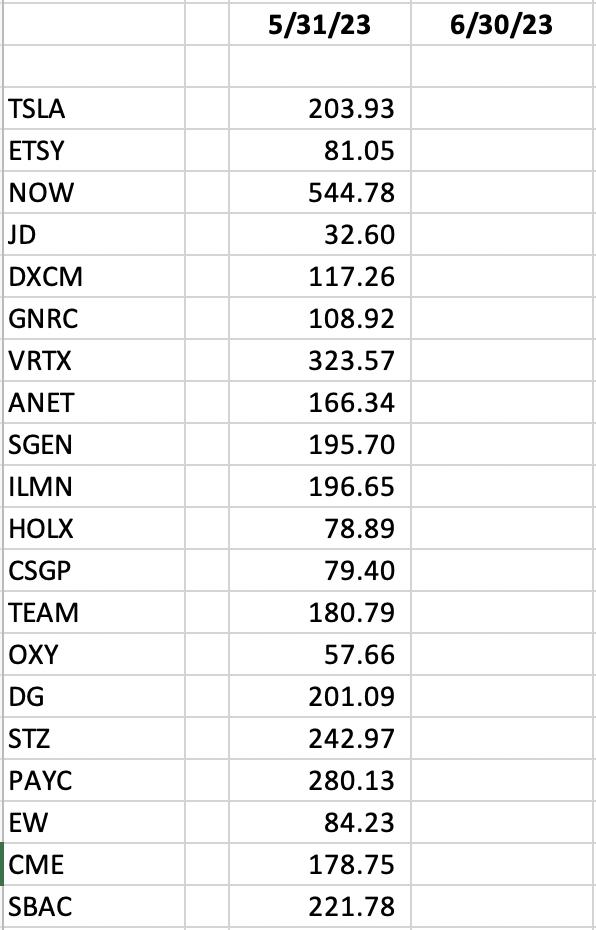
A "Seasonality - June 2023" ChartList (annotated with 1 or 2 support levels to watch) has been created and will be available for viewing/download on our website later today. You must be a StockCharts.com Extra or Pro member to download our ChartLists. Basic members and non-StockCharts.com members can view the charts one at a time.
Happy trading!
Tom