
EB Monthly Seasonality Report - June 2025
A Look Back At May Stocks:
Last month, we released our list of the Top 20 stocks that had strong historical track records during the month of May. Here are how they performed in May 2025, in order of best to worst performer:
- AVGO: +25.77%
- NVDA: +24.06%
- MU: +22.76%
- AMD: +13.74%
- EPAM: +11.20%
- CRWD: +9.91%
- NFLX: +6.67%
- ON: +5.84%
- IT: +3.64%
- LYV: +3.58%
- MRVL: +3.12%
- MCK: +0.84%
- CZR: -0.67%
- EA: -0.90%
- TMUS: -1.92%
- TTWO: -3.02%
- ALB: -4.77%
- ENPH: -7.18%
- HUM: -11.10%
- REGN: -18.12%
The percentages represent the returns from the April 30th close to the May 31st close. The average performance of all 20 stocks (+4.17%) was nice, but lagged the S&P 500 (+6.28%) and the NASDAQ 100 (+9.18%). Our biggest May winner was Broadcom, Inc. (AVGO, +25.77%), a semiconductor stock ($DJUSSC). Several semiconductor stocks led our May performance, but other stocks failed to keep pace. The overall weak performance of our May seasonal stocks vs. both the S&P 500 and NASDAQ 100 was mostly attributable to large growth stocks significantly outperforming the rest of the market. Like I mentioned earlier, our semiconductor stocks performed exceptionally well on a relative basis, but beyond that, most of our May seasonal stocks underperformed our key indices.
May continued our April strength off of the April 7th bottom and that was reflected in 15 of our 20 seasonal stocks gaining ground during the month.
S&P 500 June Performance
The annualized performance of the S&P 500 (since 1950) during the month of June hasn't been great historically, but we have seen strength in June the past decade. In fact, the May through July period has been the best 3-consecutive-calendar-month period over the past 10 years, even besting the historically strong 4th quarter, October through December.
Since 1950, however, June has produced an annualized return of just 2.14% on the S&P 500, which ranks 9th among all calendar months. Here's a breakdown of strong and weak performance periods throughout June on the S&P 500:
- June 1-6: +32.93%
- June 7-11: -16.95%
- June 12-17: +11.66%
- June 18-27: -21.03%
- June 28-30: +27.49%
The NASDAQ's June performance (+11.93%) since 1971 has been much stronger than the S&P 500's, as the NASDAQ has gained at least 5% in June in 5 of the past 6 calendar years. The following seasonality chart covers the 2019 through 2024 period for the NASDAQ 100, highlighting not only the June strength, but the May through July 3-month strength:
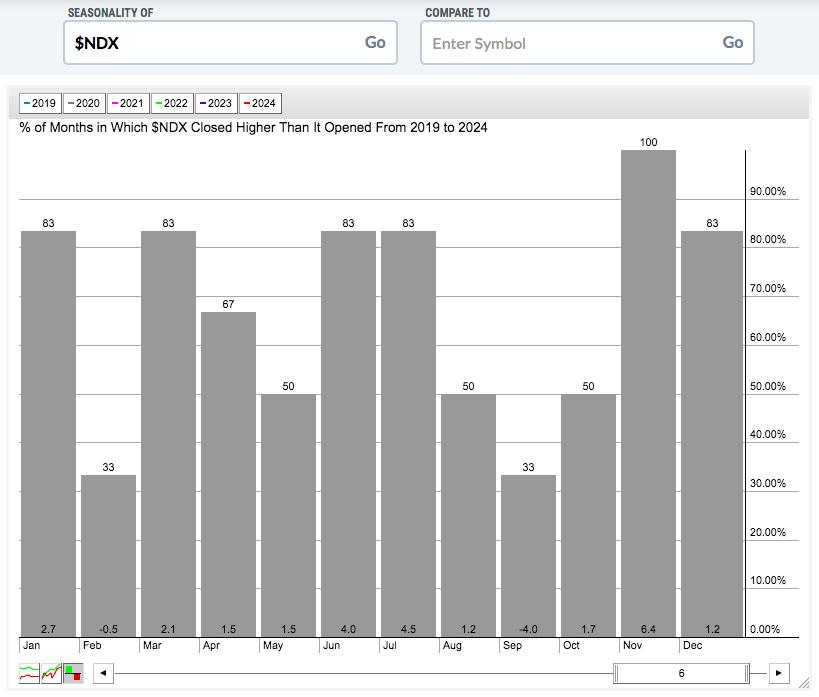
It'll be interesting to see if this recent summer strength holds true again in 2025, especially with so many folks bearish and believing that the S&P 500 will return to the April low. I'm not among those bearish folks. I see the market heading higher ahead.
Anyone following the "Go Away in May" hype train that media outlets routinely promote has missed average 3-month returns (May through July) of 10% during the years 2019 through 2024. That's a game changer for many investment portfolios and is one more exclamation point why following the media will make investing nearly impossible.
Sector Performance
There are no significant outperformers among sectors during the month of June. Financials (XLF), materials (XLB), and utilities (XLU) tend to be weak relative performers, however. The strongest relative performer, historically, is consumer discretionary (XLY), which could really benefit the underlying strength of U.S. stocks if that is the case again this year. Here's the current technical outlook of the XLY as we head into June:
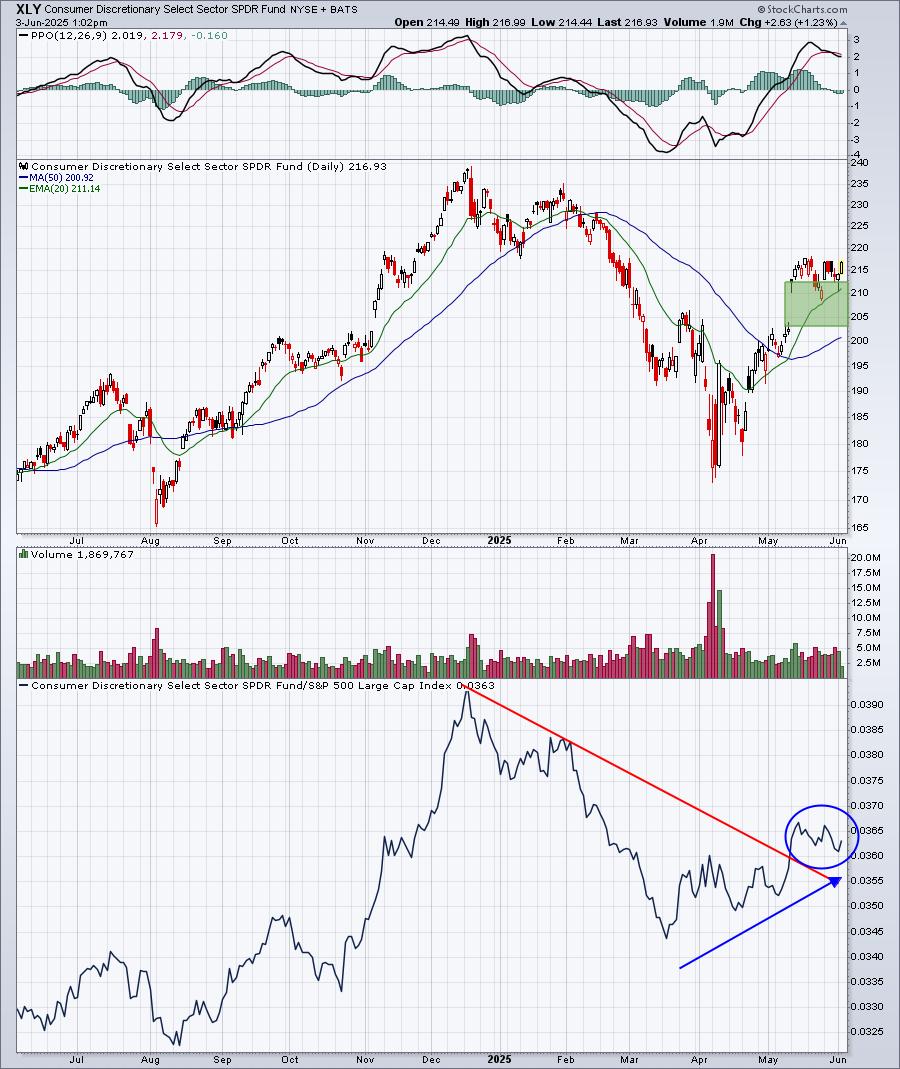
I love the turn higher in relative strength off the March relative low (bottom panel). This tells us that consumer discretionary is leading U.S. stocks higher, a very bullish development. Also, check out the recent successful 20-day EMA tests and the bullish configuration of the chart - price action above the rising 20-day EMA, which is positioned above the rising 50-day SMA. All systems are GO here if the XLY can make another breakout, clearing 218-219 on a closing basis. Continue to watch support at the rising 20-day EMA initially and then the gap and price support, highlighted by the green-shaded area.
Industry Performance
Let's focus on consumer discretionary stocks, where we've seen the best relative sector strength during June since this secular bull market began in 2013. Automobiles ($DJUSAU) have historically performed very well in June, led by June strength in Tesla, Inc. shares (TSLA). First, let's look at the DJUSAU chart and then the TSLA seasonal chart:
$DJUSAU
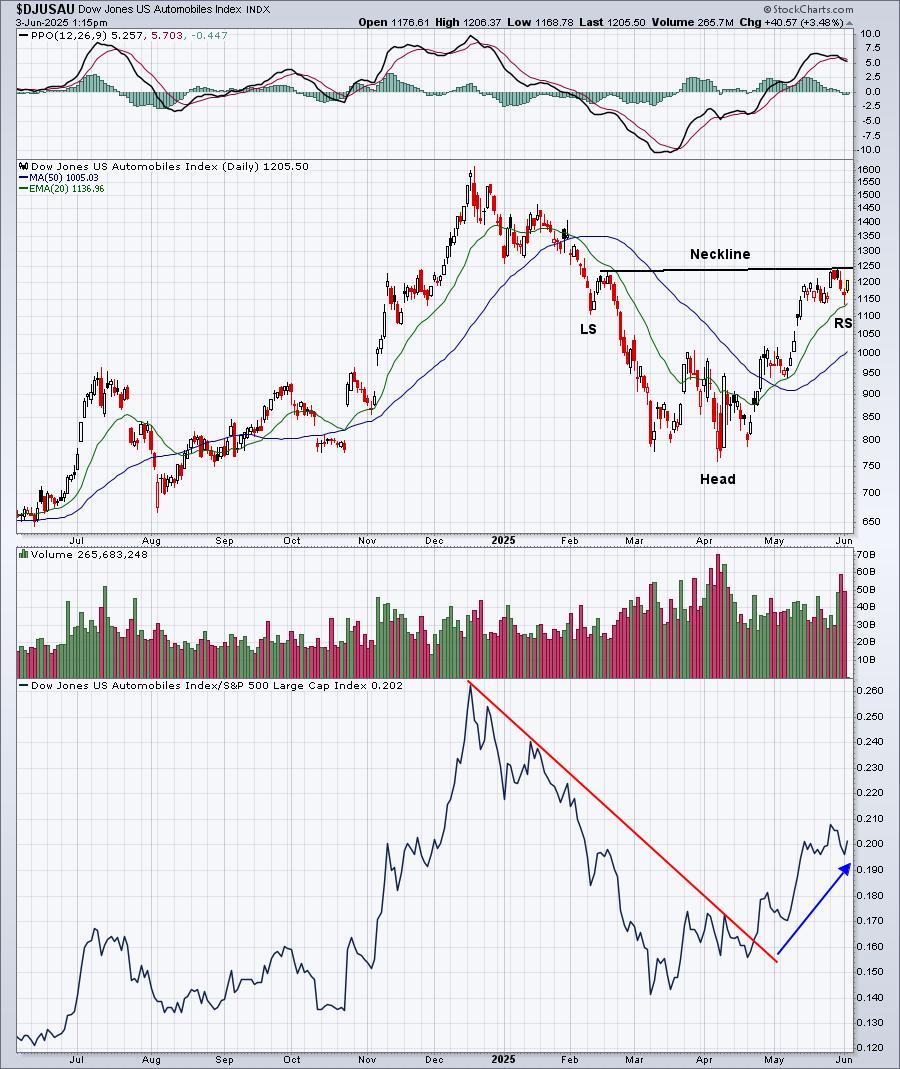
I could absolutely see autos have a solid month of June, given current technical conditions. The DJUSAU is trending higher on both absolute and relative bases. The rising 20-day EMA has provided excellent support in recent weeks and the only technical hurdle ahead appears to be neckline resistance in a bullish, reversing head & shoulders pattern. To confirm, however, we need to see this breakout above the 1250 area.
TSLA
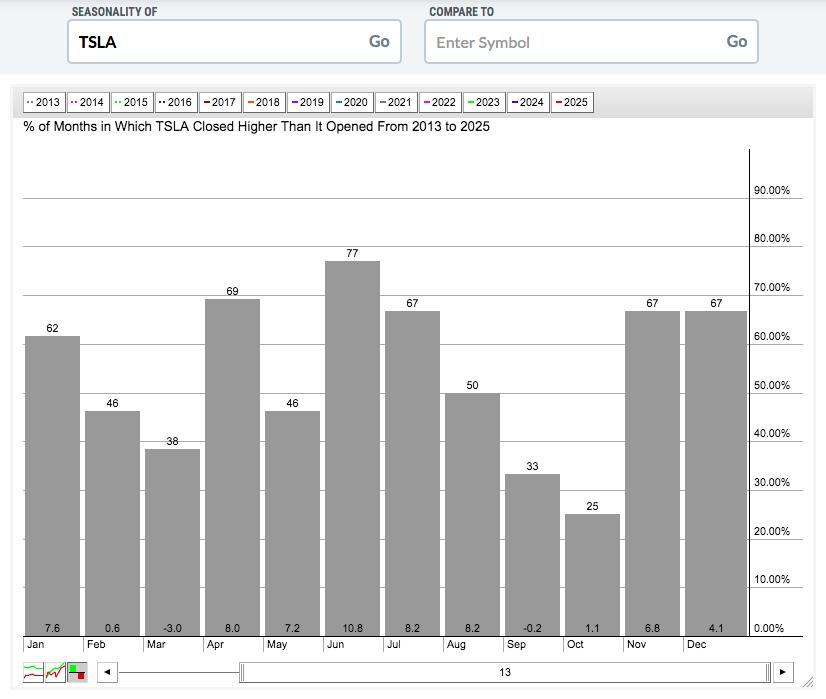
TSLA has moved higher more often in June than any other calendar month and it's produced the highest average monthly return during June since the secular bull market began in 2013. Keep this in mind should TSLA (and autos) clear recent closing highs.
Here are all industry groups that tend to perform much better than the benchmark S&P 500 during June:
Technology (XLK):
- software, computer hardware
Consumer Discretionary (XLY):
- autos, business training & employment agencies, recreational products, specialty retailers, clothing & accessories, broadline retailers, footwear
Communication Services (XLC):
- publishing
Industrials (XLI):
- delivery services
Financials (XLF):
- none
Health care (XLV):
- medical equipment
Consumer staples (XLP):
- nondurable household products
Real estate (XLRE):
- none
Utilities (XLU):
- none
Energy (XLE):
- none
Materials (XLB):
- none
Stocks for June
A "Seasonality - June 2025" ChartList (annotated with 1 or 2 support levels to watch) has been created and will be added to our website later today. Here is a quick link and password, however, so that you can download it now:
Link: June Seasonality
Password: SEASCL8456
You must be a StockCharts.com Extra or Pro member to download our ChartLists. Basic members and non-StockCharts.com members can view the charts one at a time.
Happy trading!
Tom