
EB Monthly Seasonality Report - July 2022
I have not prepared a monthly seasonality report for much of 2022 as I was generally bearish the S&P 500. So pointing out stocks that historically perform well would have been misleading, in my opinion. Seasonality is a secondary consideration of mine, not a primary one. I don't buy and sell stocks simply because they've historically performed well during a certain period of time. If they have a history of doing so AND the technical outlook is bullish, then I can take the position with more confidence. But I'd be cautious about buying a stock simply based on its seasonal performance.
S&P 500 Performance
Here's a breakdown of the annualized performance of the S&P 500 (since 1950) during the month of July:
July 1-17: +25.57%
July 18-23: -19.22%
July 24-31: +16.74%
July tends to be a fairly strong calendar month for U.S. equities, mostly because equity prices tend to move higher ahead of quarterly earnings season, which typically begins in mid-July. Since 1950, the S&P 500 has moved higher in July in 42 of the 72 years, producing an annualized return of +13.80%. That ranks July as the 4th best calendar month of the year, trailing only November (+19.91%), December (+18.62%), and April (+18.08%) in terms of annualized performance. Its probability of finishing the month higher than where it closed in June is 58.33% (42 of 72 years), ranking it 8th of the 12 calendar months in that category.
Sector Performance
Before we look at individual stocks, let's get an overview of how the various sectors and industries have performed during July (and August) over the past decade (during this secular bull market):
Sector Heat Map:
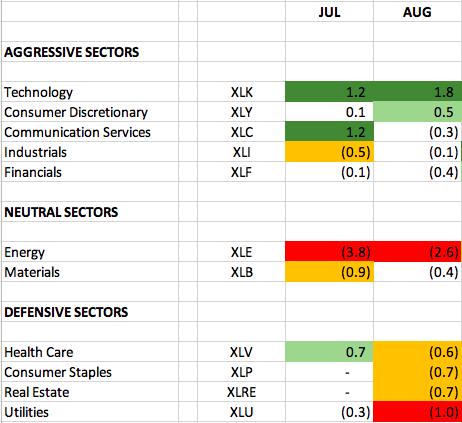
The numbers reflect how much a sector, on average, outperforms or underperforms the S&P 500 over the past 10 years. The dark green-shaded areas show significant outperformance (1.0 or greater). The light green-shaded areas show solid outperformance (from 0.5 to 1.0). The yellow-shaded areas show underperformance (-0.5 to -1.0). The red-shaded areas show significant underperformance (-1.0 or greater). Where there is no shading, there tends to be more neutral performance (-0.4 to 0.4).
When I look at these historical July numbers, technology (XLK) and communication services (XLC) - two aggressive sectors - are where we typically see relative strength in July. But only the XLK follows it up with more relative strength in August. I really like the way technology is set up technically as well:
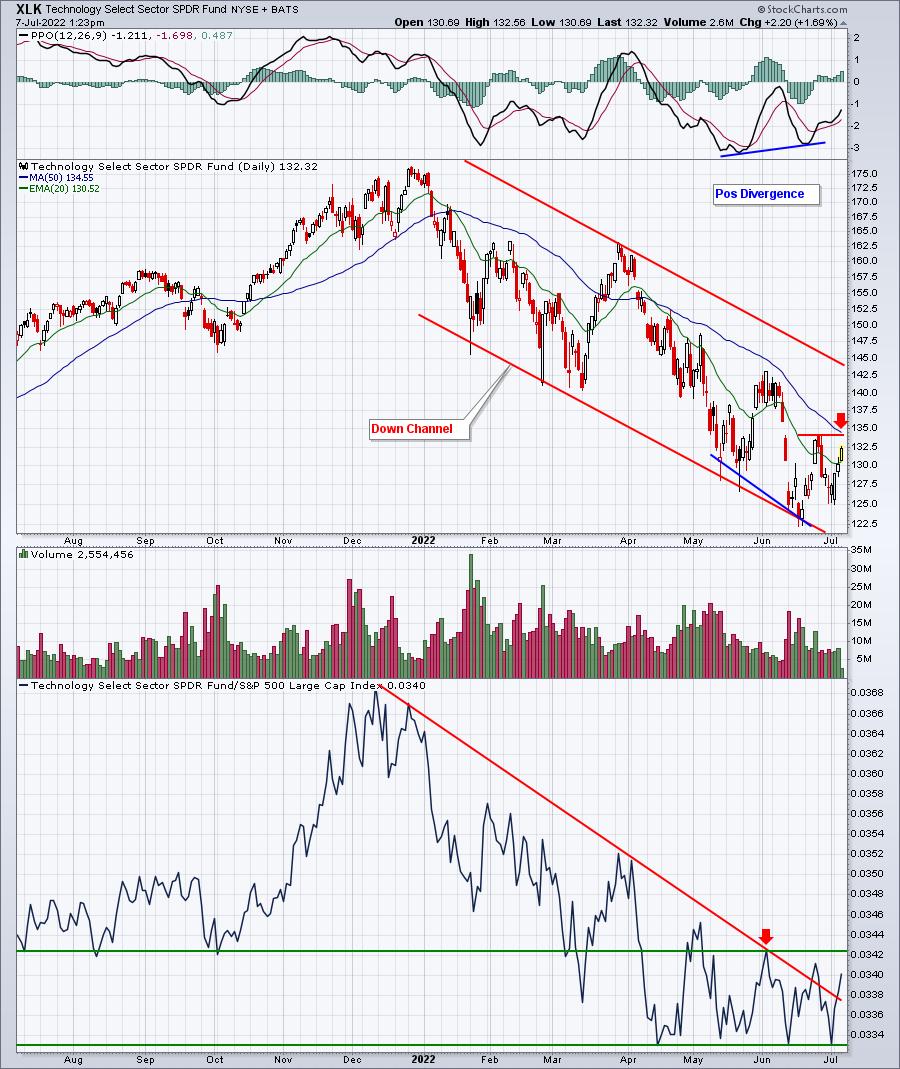
The XLK has been trending down throughout 2022, but a positive divergence has printed and note that the XLK's relative low in April has held, even though it's moved lower on an absolute basis. That's bullish rotation. The 134-135 price resistance area is what I'm watching. Clearing that would be big technically and further support the notion that the mid-June low was THE low.
I pay attention to historical signals, but the current technical picture always trumps seasonality, in my opinion. The XLK appears to be quite bullish on both counts right now.
Industry Performance
Let's take a look at the industry heat map within technology (XLK) to drill down to the best seasonal strength in July and August over the past decade among the various industry groups (relative to the S&P 500):
Technology (XLK):
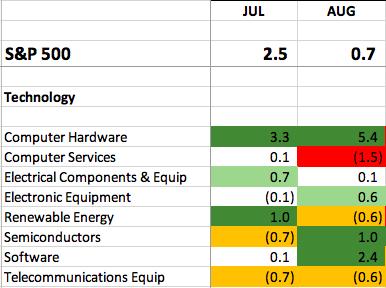
The computer hardware ($DJUSCR) and renewable energy ($DWCREE) groups tend to lead technology higher in July. The former strengthens even further into August. Here's how the DJUSCR looks right now:
DJUSCR:
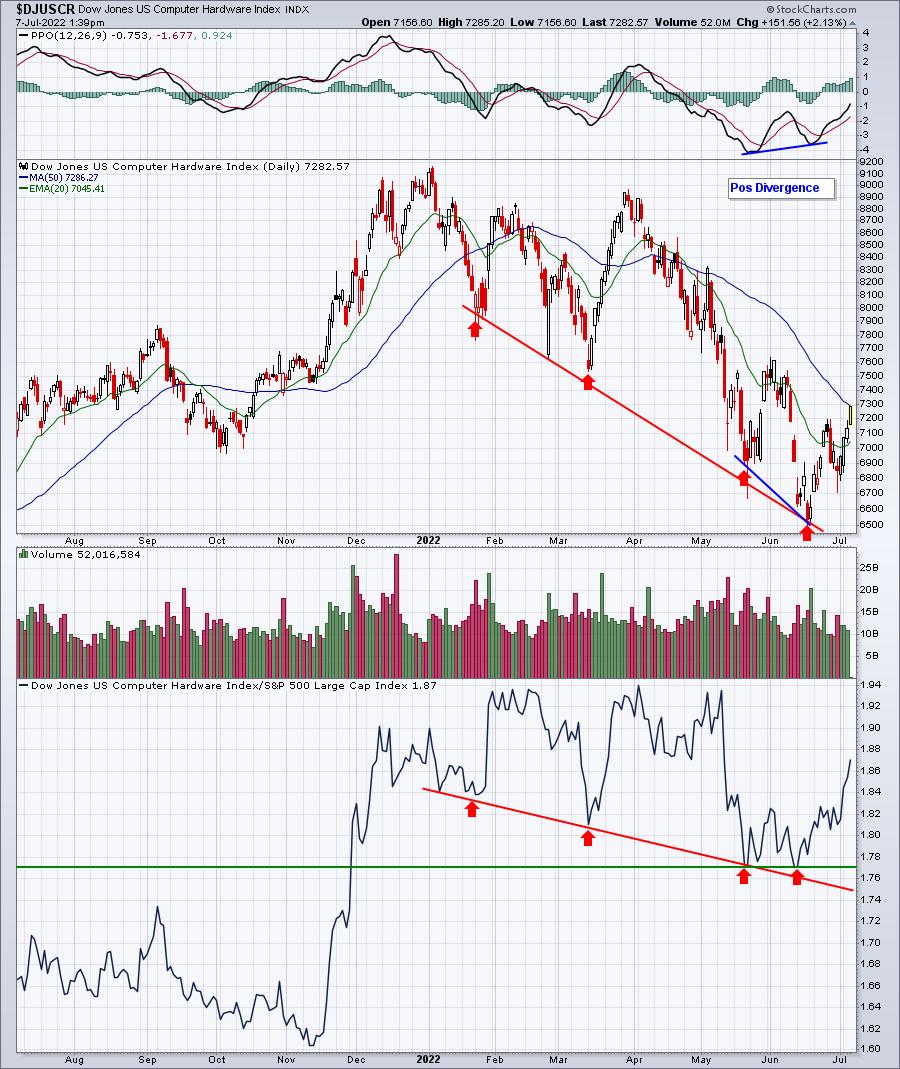
Computer hardware is showing a very subtle bullish rotation as it's most recent absolute price low only saw its relative low match the prior relative low. Previously, each absolute lower low in 2022 was accompanied by a lower relative low as well. There's also a positive divergence in play and we're just now seeing a very important 50-day SMA test. Failure at this level wouldn't be horrible news, but I would prefer to see the now-rising 20-day EMA hold as support to confirm a new uptrend is in play.
Here are industry groups (within sectors other than echnology) that tend to perform much better than the benchmark S&P 500 during April:
Consumer Discretionary (XLY):
- broadline retailers, recreational products, specialized consumer services
Communication Services (XLC):
- internet
Industrials (XLI):
- delivery services, defense
Financials (XLF):
- specialty finance
Health care (XLV):
- biotechnology, medical equipment
Consumer staples (XLP):
- nondurable household products
Real estate (XLRE):
- none
Utilities (XLU):
- water
Energy (XLE):
- none
Materials (XLB):
- aluminum
Stocks for April
We've selected our Top 20 seasonal stocks for July from the S&P 500 and NASDAQ 100. Several names represent sectors and industry groups that have been discussed above. Others simply stand out in July based on their own historical track record.
The stocks this month are as follows:
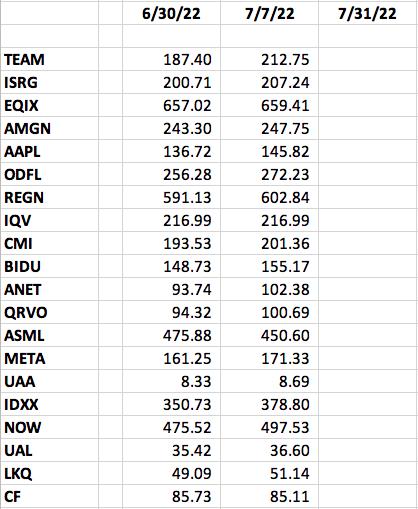
The prices for July 7 were as of approximately 1:00-2.00pm ET.
A "Seasonality - July 2022" ChartList will be created and will be available for viewing/download on our website later today. You must be a StockCharts.com Extra or Pro member to download our ChartLists. Basic members and non-StockCharts.com members can view the charts one at a time. The charts will be annotated with a key support level (or two) to watch on any pullback.
Happy trading!
Tom