
EB Weekly Market Report - Monday, August 26, 2024
No EB Weekly Portfolio Report
We did not send out a weekly portfolio report this weekend, because we had sold all stocks in our stock portfolios, leaving only our Model ETF Portfolio, which returned 1.90% last week vs. the S&P 500's return of 1.45%. We'll send out our next EB Weekly Portfolio Report this Friday or Saturday.
Latest Portfolio DRAFT
We waited until after Fed Chair Jerome Powell's Jackson Hole speech was completed and we could evaluate initial rotation before drafting the 10 equal-weighted stocks for our 3 stock portfolios - Model, Aggressive, and Income. This draft will take place at 5:30pm ET this afternoon. Room instructions will be sent out via a separate email.
ChartLists Updated
I updated the following ChartLists over the weekend and they should all be available for your viewing/downloading pleasure on our website:
- Strong Earnings (SECL)
- Strong Future Earnings (SFECL)
- Raised Guidance (RGCL)
- Strong AD (SADCL)
- Bullish Trifecta (BTCL)
- Seasonality - September 2024 (SEASCL)
- All Upcoming Earnings
- Upcoming Earnings - Relative Strength
Weekly Market Recap
Major Indices
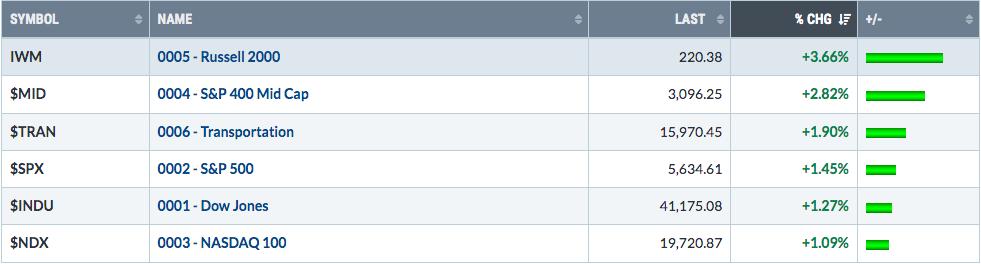
I will shift gears in my analysis and guidance when I feel market action dictates it. Market action can change quickly in the near-term. My long-term guidance really hasn't changed throughout the duration of this entire secular bull market. I am BULLISH long-term and have not wavered.
Short-term is a different story. I'm typically bullish, following the overall secular bull market to the upside. There are signals from time to time, however, that do tell me to be cautious. That was most definitely the case in late July and early August. It wasn't so much the news as it was the behavior of stocks, particularly small caps, which fell apart after the last Fed meeting. Also, there were very clear signs of economic weakness, though not a recession. If the economic weakness were to deteriorate further, a possible recession could lie ahead. The lowering of interest rates is now almost guaranteed as Fed Chief Powell announced from Jackson Hole, WY on Friday that Fed policy now needs to change. That signals rate cuts, starting in September. The only question now is how quickly they'll cut and how much they'll cut at each meeting. This is GREAT news as the Fed is saying inflation is DEAD. They've killed it. This, in turn, means that the Fed can now devote its full arsenal and resources to their OTHER mandate, maximizing employment.
Sectors
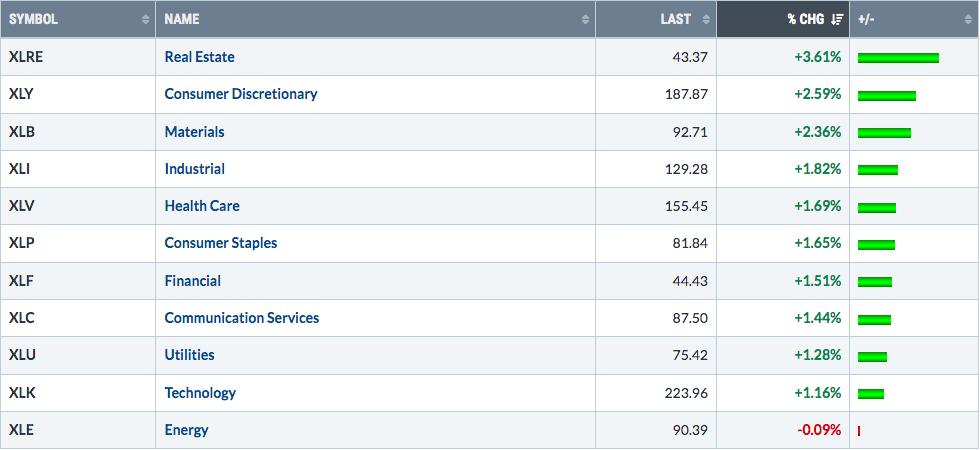
Energy was the only sector last week that failed to participate in essentially what was a wide-participation rally. The culprit? Falling crude oil prices ($WTIC):
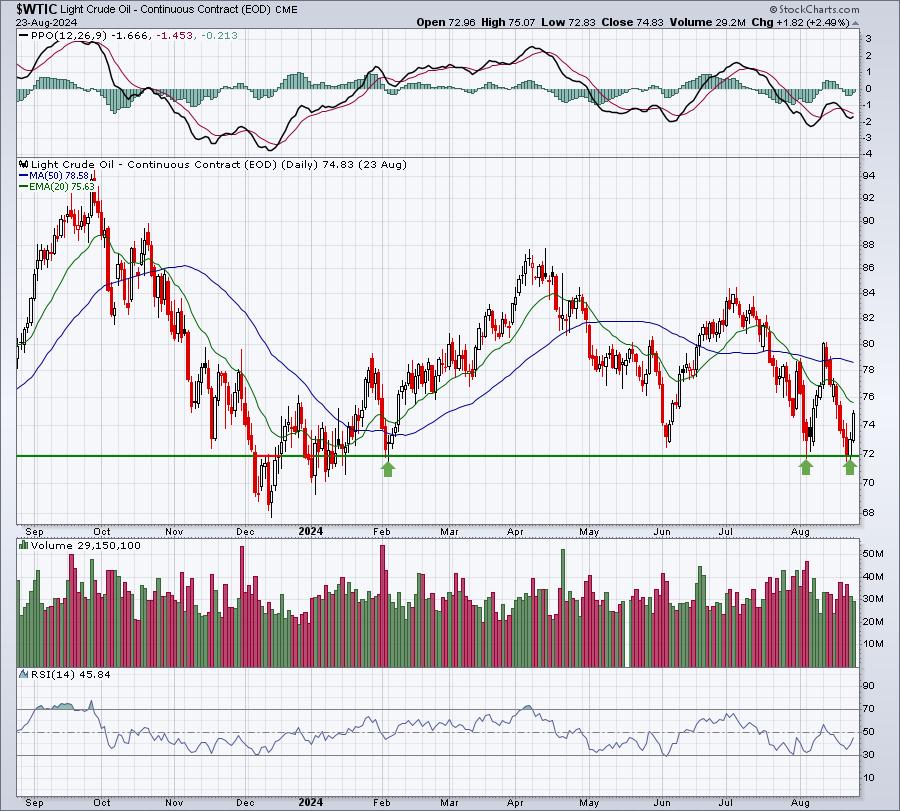
Crude rallied late in the week, but not before testing its lowest level since January 2024. That weakness in crude oil prices spooked in energy investors. Assuming crude oil can continue its rally from Thursday and Friday, I'd expect to see recovery in energy as well.
Unfortunately, last week's rally was not led by technology. It's always more bullish to see this group perform well, because of its 32% representation in the S&P 500. Technology leadership is also a signal of a "risk-on" environment, which is when U.S. equities are at their strongest. Nonetheless, stocks rallied as more and more companies participated in the advance.
Top 10 Industries Last Week
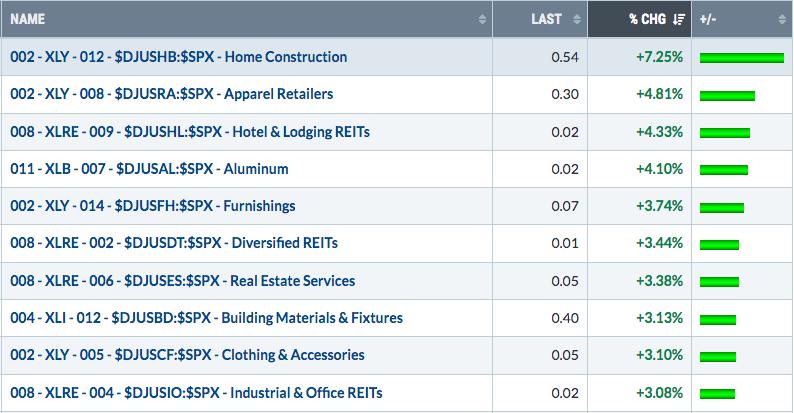
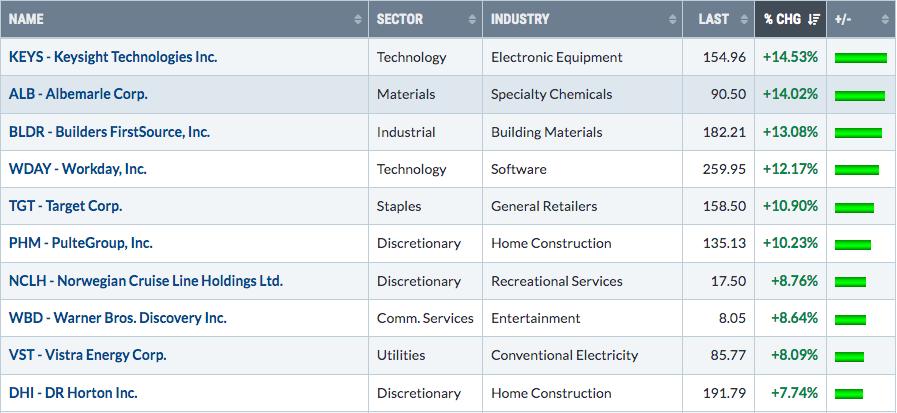
The economically-sensitive home construction group soared 7.25% as a group, mostly due to a falling 10-year treasury yield ($TNX). The TNX fell close to 10 basis points last week, prompting a drop in mortgage rates, which obviously benefit the housing area.
Bottom 10 Industries Last Week
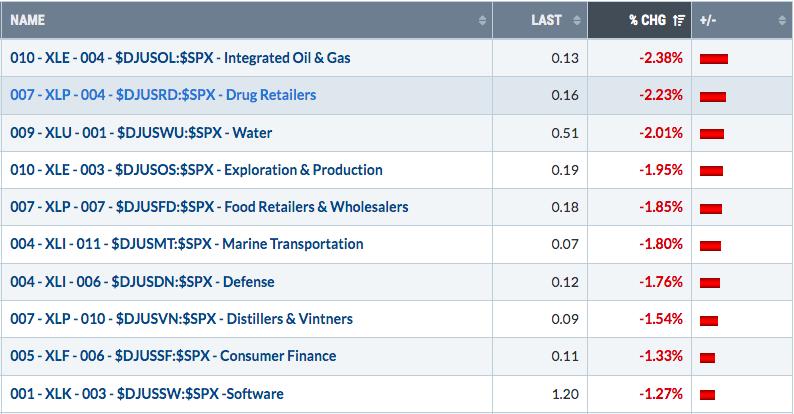
As I mentioned before, the drop in crude oil prices adversely impacted energy stocks. 2 of the bottom 4 industry groups resided in energy - not a shocker. Meanwhile, industries from defensive sectors showed relative weakness, a solid signal that U.S. equities are likely to remain somewhat resilient during what historically is a bearish upcoming period. I still expect to see some weakness in September and, potentially, October, but I don't believe we'll move below the August low.
Top 10 Stocks - S&P 500/NASDAQ 100
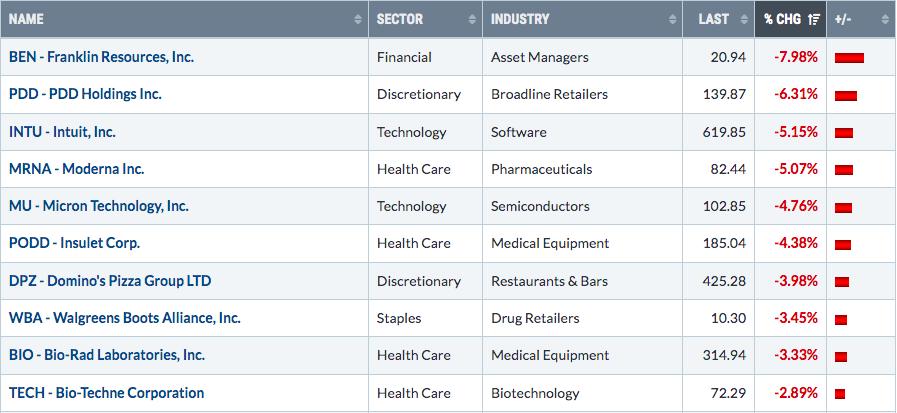
Bottom 10 Stocks - S&P 500/NASDAQ 100
Big Picture
Here's an update of the Big Picture, 100-year chart of the S&P 500:
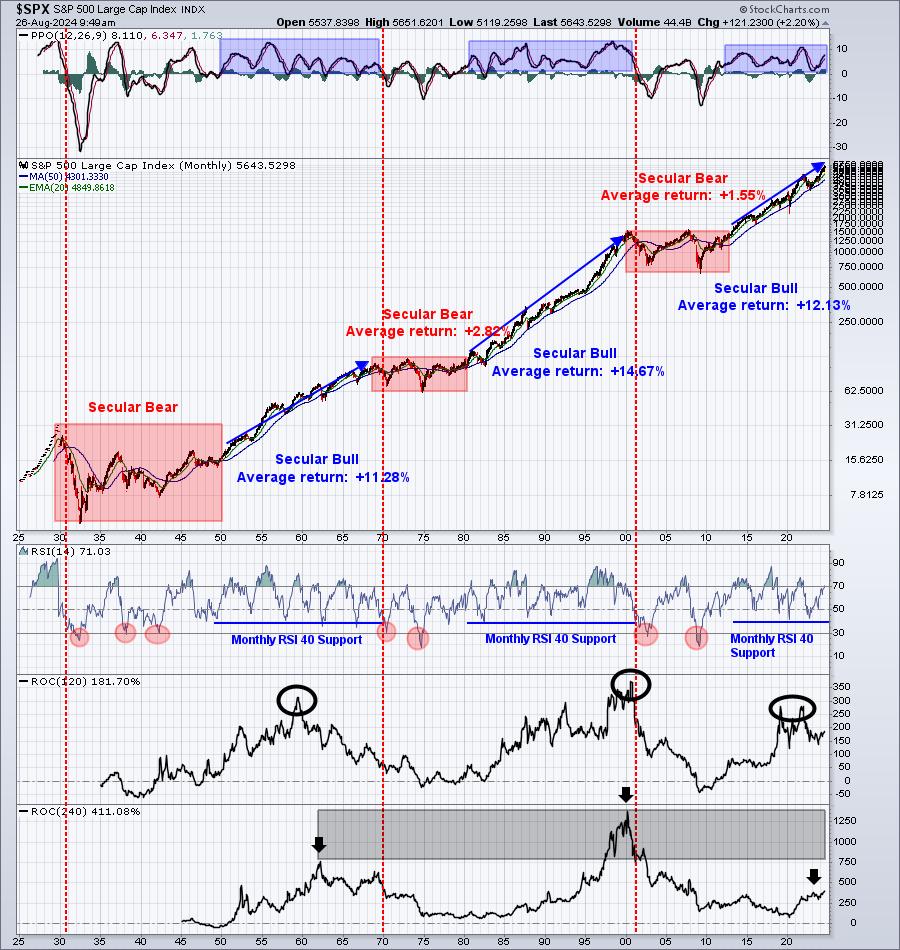
In the bottom panel, the 240-month rate of change (20 years) is starting to move up again and is now at its highest level since this secular bull market began. The exact same thing occurred in 1960 and 1990, right in the middle of both of those secular bull markets. Those new highs ushered in the 2nd half of both of those secular bull markets. If it's happening for a 3rd time, it's further evidence that this secular bull market is only halfway home and that the next secular bear market isn't likely to begin until well into the 2030s - great news for those still looking to build their retirement accounts and overall net worth.
All of the election noise, economic noise, Fed noise, interest rate noise, etc. is drowned out by this Big Picture chart. Step back, reflect on history, and be confident in higher prices down the road - from a LONG-TERM perspective. It helps keep your sanity, especially when listening to media outlets that constantly spew misinformation.
Rotation/Intermarket Analysis
Here's the latest look at our key intraday ratios as we follow where the money is traveling on an INTRADAY basis (ignoring gaps):
QQQ:SPY
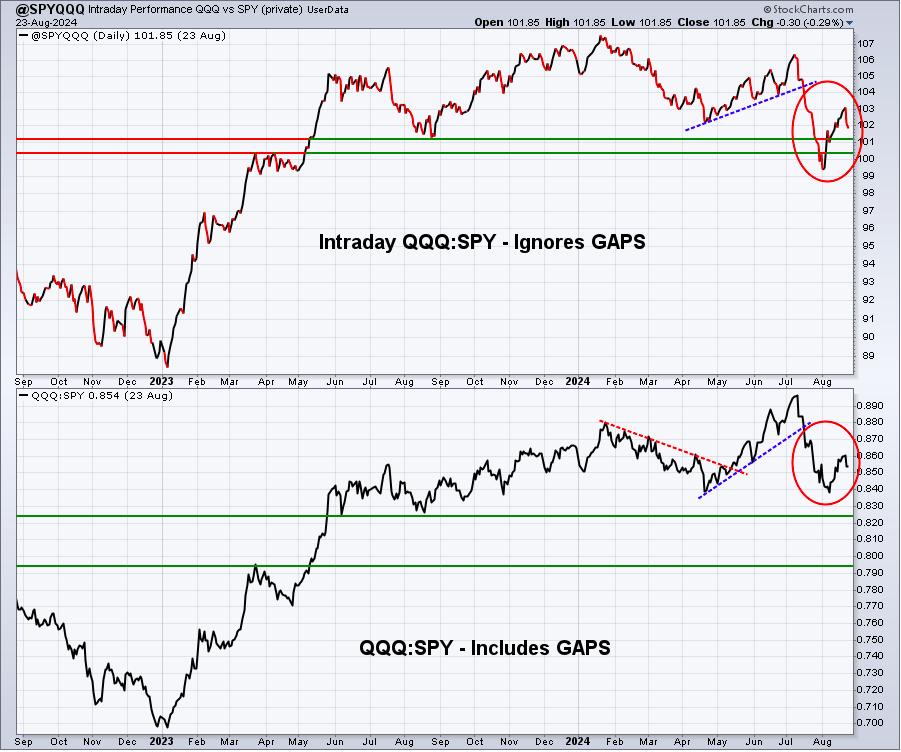
Risk-on areas of the market tend to struggle during late summer months and that's what we saw last week. The QQQ is more aggressive than the SPY, so this QQQ:SPY ratio dropping is an indication of rotation into more value-oriented areas of the market.
Also, this chart is actually calculated QQQ:SPY, despite its "@SPYQQQ" name.
IWM:QQQ
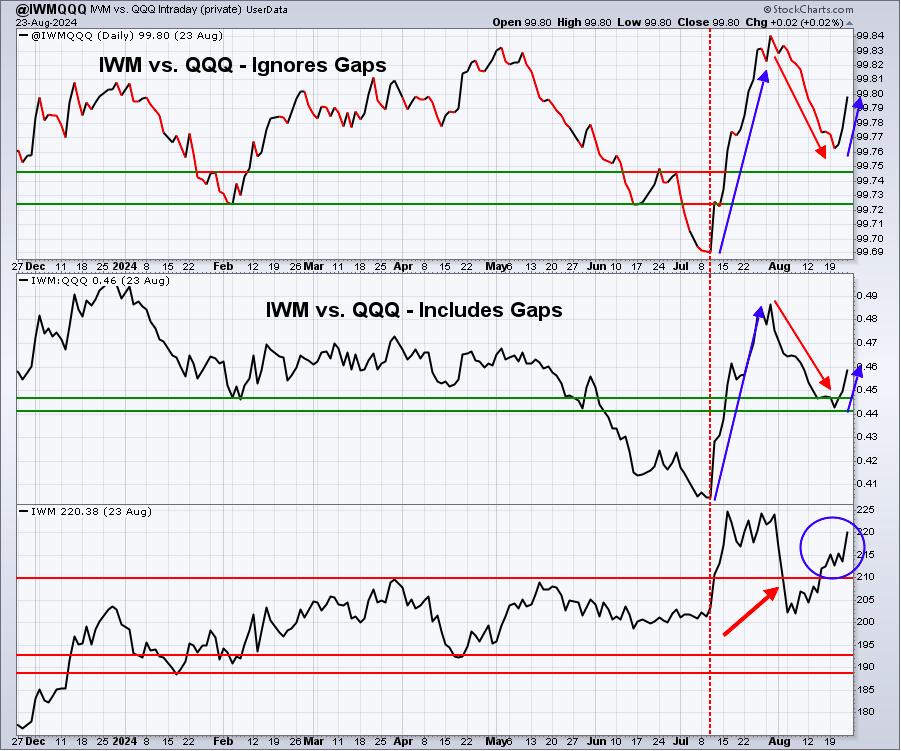
There was a big surge in the IWM relative to the QQQ after the Fed Chief Powell insinuated that the fed funds rate will be decreased, beginning in September. That spurred many areas within small caps, especially smaller banks and that resulted in a surge in the relative strength of the IWM.
XLY:XLP
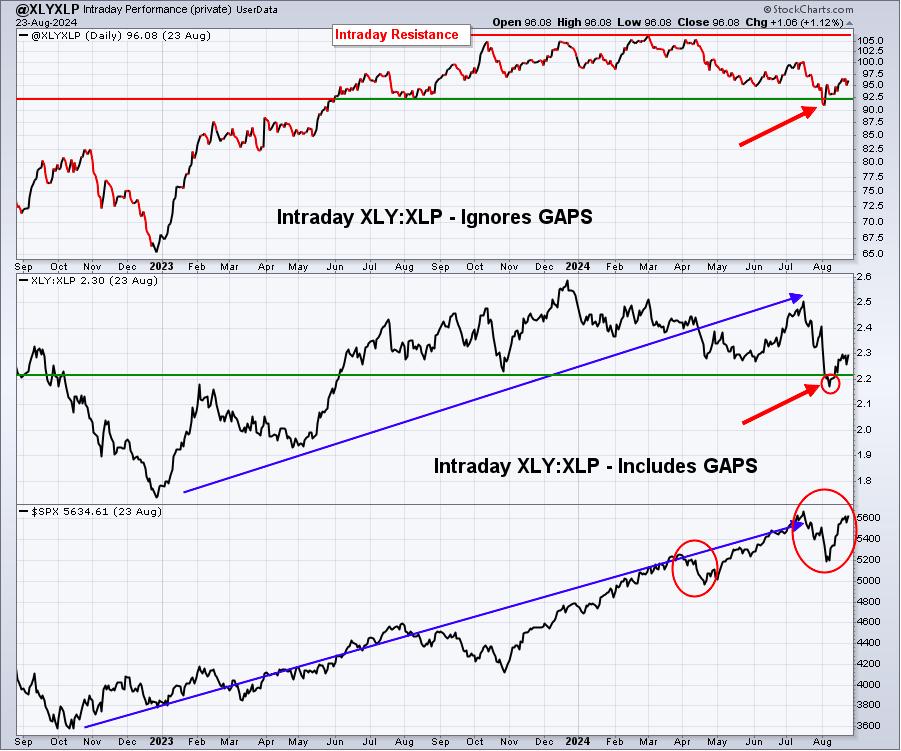
The XLY:XLP is slowly regaining its footing after a significant decline in the 2nd half of July. I would expect this ratio to continue to climb as we approach year end, though I do expect many value-oriented stocks in consumer staples (XLP) to also perform well.
Sentiment
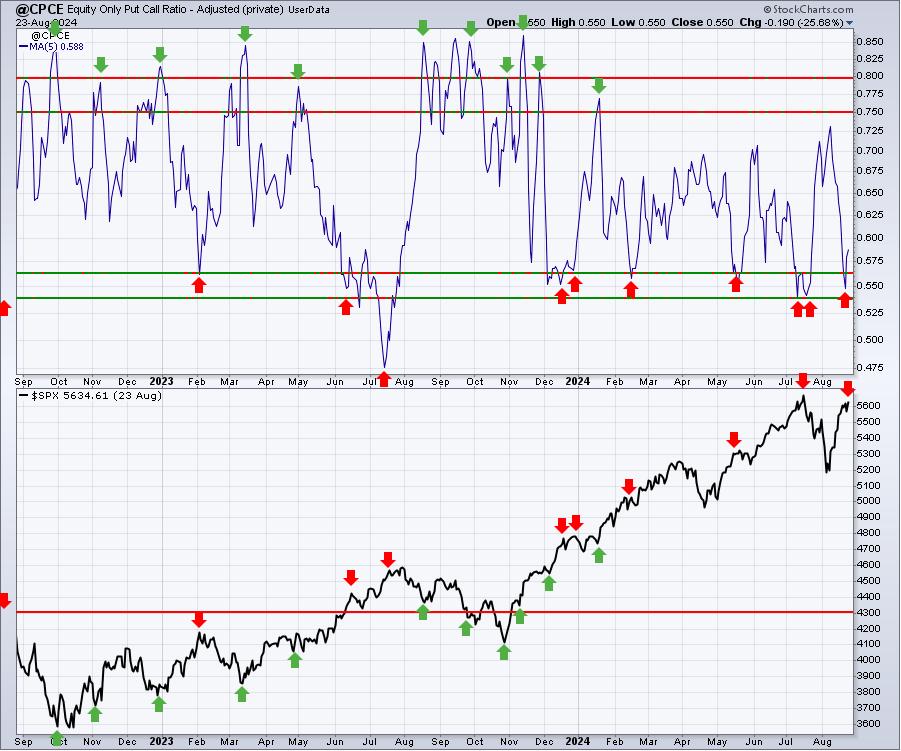
5-day SMA ($CPCE)
This is my favorite sentiment indicator and it has a long history of marking key short-term market bottoms and tops. After last week's rally, however, the 5-day SMA of the CPCE dropped back into neutral territory, providing us little in the way of short-term clues:
Industry Groups
Last week, I mentioned 4 industry groups that had already broken out and 3 of those 4 went on to post nice additional gains last week (pipelines was the exception). I then discussed 5 more industry groups where I was watching for absolute breakouts. 3 were stymied last week by the price resistance identified, while 2 of the groups made the breakout I was looking for:
Health Care Providers:
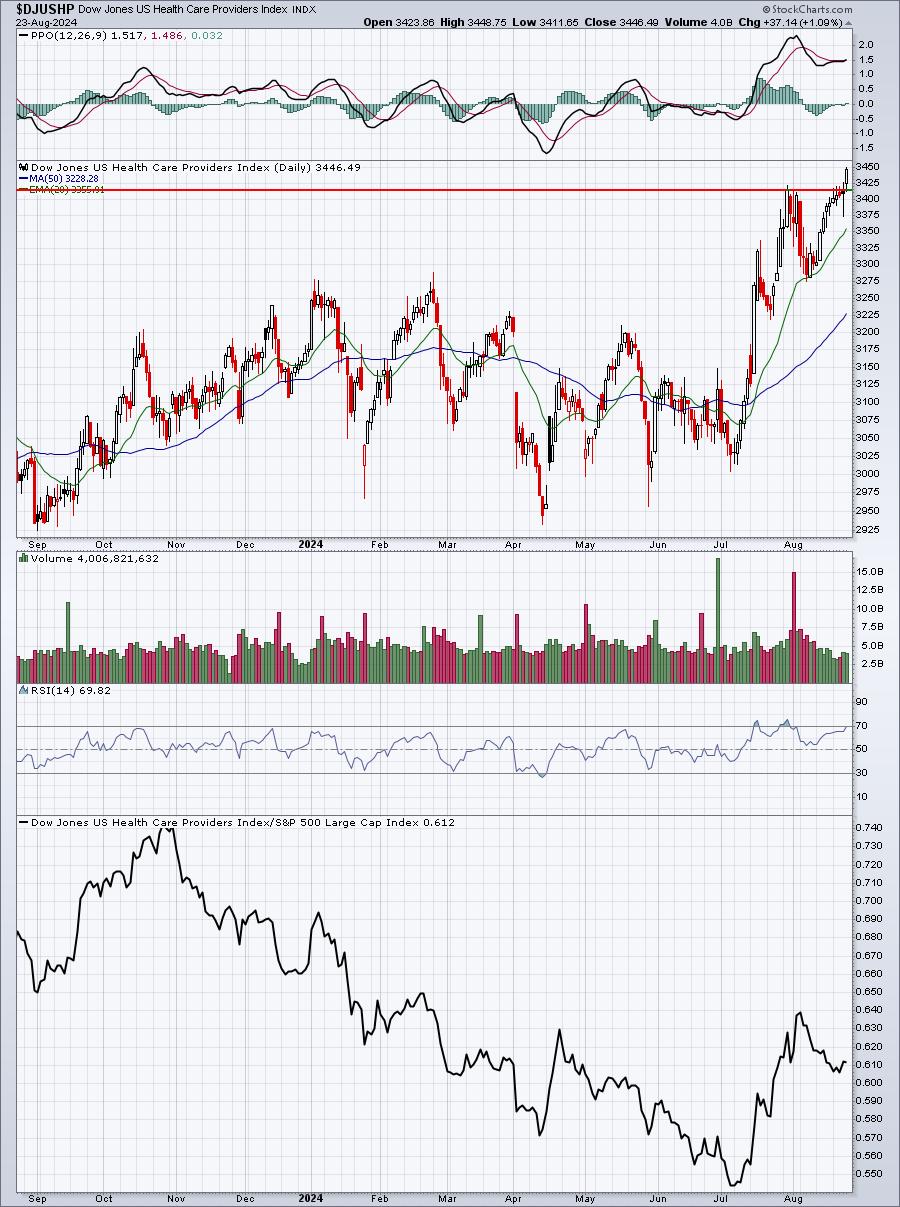
As you can see from this chart, the DJUSHP can be quite volatile, moving from false breakouts to false breakdowns in a matter of a couple weeks. The action the past 7 weeks or so, however, has been exceptionally bullish, so I'd lean towards this strength continuing.
Specialized Consumer Services:
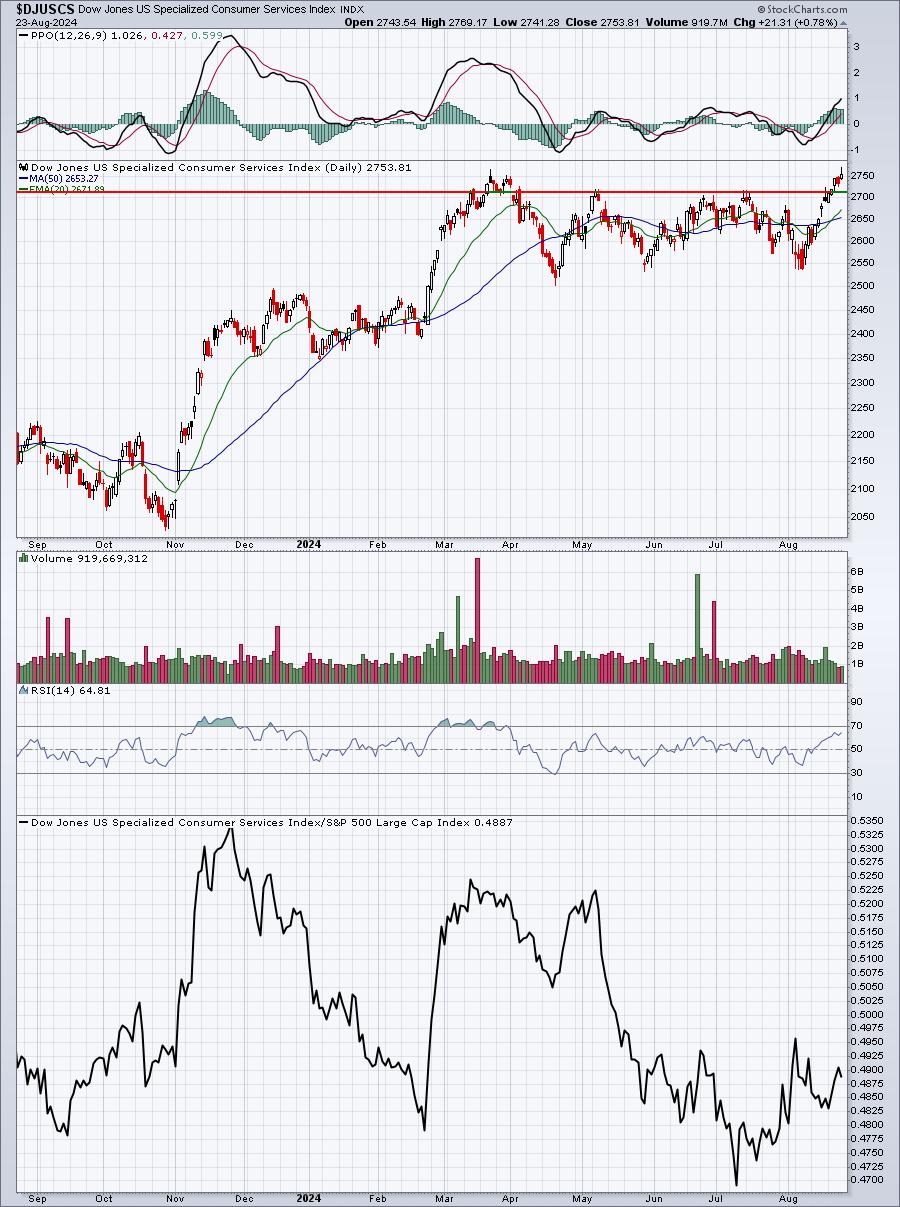
The DJUSCS broke out above the triple top resistance, but also had further overhead price resistance near 2750. That too was cleared at Friday's close, though the candle wasn't massively bullish as it closed well off its intraday high. Still, a breakout is a breakout.
Long-Term Trade Setup
Since beginning this Weekly Market Report nearly one year ago, I've discussed the long-term trade candidates below that I really like. Generally, these stocks have excellent long-term track records and many pay nice dividends that mostly grow every year. Only in very specific cases (exceptions) would I consider a long-term entry into a stock that has a poor or limited long-term track record. Below is a quick recap of what I see on each as of its Friday, August 23, 2024 close:
- JPM - just broke out again, looks poised for further gains into year end
- BA - hasn't performed well, but continues to trade and hold in a 160-180 support area
- FFIV - trending higher, I expect more strength into year end
- MA - further shift into financials will help continue this uptrend
- GS - love the absolute and relative strength here
- FDX - easily beating its rival UPS, expect further upside
- AAPL - has recovered nicely from its August swoon
- CHRW - huge earnings-related gap in August has this one on the move
- JBHT - broke to 4-month high on Friday
- STX - primarily trending higher since adding, now bouncing back from August selloff
- HSY - still consolidating, but AD line improving - sign of move higher?
- DIS - remains mired in downtrend off March/April high, big support just beneath 180
- MSCI - rallying strongly off April low
- SBUX - new CEO (former Chipotle CEO) lifted the stock nearly two weeks ago
- KRE - trending higher and poised for growth as upcoming rate cuts take effect
- ED - consistent utility stock near 52-week high
- AJG - reversing candle on Friday with neg divergence, could see short-term decline, still love long-term
- NSC - trying to kickstart a trend change in what's been mostly sideways action for last 3-4 years
Keep in mind that our Weekly Market Reports favor those more interested in the long-term market picture. Therefore, the list of stocks above are stocks that we believe are safer (but nothing is ever 100% safe) to own with the long-term in mind. Nearly everything else we do at EarningsBeats.com favors short-term momentum trading, so I wanted to provide an explanation of what we're doing with this list.
No stocks are being added to our Long-Term Trade list this week. We'll likely add anywhere from 2-5 candidates during September, as seasonal weakness could provide us opportunities on the long side.
Looking Ahead
Upcoming Earnings:
There is little happening this week in terms of earnings. There are still a large number of companies reporting, but few that have the potential to move the market. This is NOT a list of ALL companies reporting this week, so please be sure to check for earnings of any companies that you own or add. Any companies in BOLD represent stocks in one of our Portfolios:
- Monday: PDD ($203 billion)
- Tuesday: BMO ($63 billion)
- Wednesday: NVDA ($3.04 trillion), CRM ($251 billion), CRWD ($65 billion), VEEV ($32 billion)
- Thursday: DELL ($77 billion), MRVL ($59 billion), ADSK ($54 billion), LULU ($33 billion)
- Friday: None
Key Economic Reports:
- Monday: July durable goods
- Tuesday: June Case-Shiller home price index, June FHFA house price index
- Wednesday: None
- Thursday: Initial jobless claims, Q2 GDP (2nd estimate), July pending home sales
- Friday: July personal income/spending, August Chicago PMI, August consumer sentiment
Historical Data
I'm a true stock market historian. I am absolutely PASSIONATE about studying stock market history to provide us more clues about likely stock market direction and potential sectors/industries/stocks to trade. While I don't use history as a primary indicator, I'm always very aware of it as a secondary indicator. I love it when history lines up with my technical signals, providing me much more confidence to make particular trades.
Below you'll find the next two weeks of historical data and tendencies across the 3 key indices that I follow most closely:
S&P 500 (since 1950)
- Aug 26: -2.29%
- Aug 27: -3.57%
- Aug 28: -6.44%
- Aug 29: +32.75%
- Aug 30: -28.08%
- Aug 31: +9.88%
- Sep 1: +27.13%
- Sep 2: +62.42%
- Sep 3: +4.54%
- Sep 4: -40.02%
- Sep 5: -17.78%
- Sep 6: +26.84%
- Sep 7: -8.58%
- Sep 8: +8.58%
NASDAQ (since 1971)
- Aug 26: +31.29%
- Aug 27: +12.09%
- Aug 28: -13.87%
- Aug 29: +78.68%
- Aug 30: -43.06%
- Aug 31: +16.28%
- Sep 1: +57.15%
- Sep 2: +75.21%
- Sep 3: -64.43%
- Sep 4: -50.80%
- Sep 5: -53.75%
- Sep 6: +12.35%
- Sep 7: +38.60%
- Sep 8: -6.25%
Russell 2000 (since 1987)
- Aug 26: +2.90%
- Aug 27: +40.74%
- Aug 28: +21.92%
- Aug 29: +157.75%
- Aug 30: -78.17%
- Aug 31: +1.28%
- Sep 1: +39.71%
- Sep 2: +94.68%
- Sep 3: -60.70%
- Sep 4: +38.95%
- Sep 5: -60.38%
- Sep 6: +5.47%
- Sep 7: +31.72%
- Sep 8: +50.64%
The S&P 500 data dates back to 1950, while the NASDAQ and Russell 2000 information date back to 1971 and 1987, respectively.
Final Thoughts
Can we just transport to late October, please? There was very good news last week as Fed Chief Powell announced the Fed was prepared to change its policy, meaning that rate cuts are on the way. How many? How large? Well, that'll remain somewhat uncertain, but we now do know that cuts are coming and that removes a major uncertainty for the stock market. Chalk one up to the bulls. Rotation will be the most important part of my analysis over the next couple months, as it typically is.
Here are a handful of things to consider as we move into the last week of August and prepare for the worst calendar month of the year:
- Rotation. Over the last 20 years, technology (XLK) has averaged losing 0.7% during the month of September. Since the secular bull market began in 2013, the XLK has dropped an average of 2.2% in September, the only month the XLK has a negative average return. While nothing is guaranteed, we need to be prepared to look at other areas of the market over the next several weeks.
- Volatility ($VIX). The average gain in the VIX during September over the past two decades has been 8.2%. An interesting fact, however, is that the VIX has only risen during one-third of Septembers during this time frame. The takeaway? When the VIX moves up in September, it usually SOARS higher. Don't be shocked by another VIX move above 20 at some point over the next several weeks.
- Growth vs. Value. The historical 4-consecutive-month relative advantage of growth over value (IWF:IWD) comes to an end this Friday. The playing field will now be much more level for stocks overlooked during the Spring and Summer rally.
- Semiconductors. How could semis NOT be something to prepare for this week. After all, it's poster child, NVIDIA Corp (NVDA) reports its quarterly earnings results after the bell on Wednesday, August 28th. There are a number of other key earnings out on Wednesday and Thursday of this week - check out the upcoming earnings in the "Looking Ahead" section above.
- Technical Outlook. While I do expect to see much better relative performance out of small and mid caps, I'm still not sold on the fact that we won't have at least one more drop in September/October that provides a scare to folks. It's likely to be something to do with the economy. Also, we still have the Presidential Election coming and that could drop a few bombs. The goal for me remains to try to keep my capital intact as best I can until the more seasonally-favorable Q4 period arrives.
- History. I'll be discussing some historical themes to be aware of at tonight's Portfolio DRAFT, which starts at 5:30pm ET. It'll be recorded, but hopefully I'll see you for the LIVE version!
Feedback
If you'd like to share your thoughts on our Weekly Market Report, positive or negative, you can reach us at "[email protected]".
Happy trading!
Tom