
EB Monthly Seasonality Report - September 2022
A Look Back At August Stocks:
Last month, we provided a list of the Top 20 stocks that had strong historical track records during the month of August. Here are how they performed in August 2022:
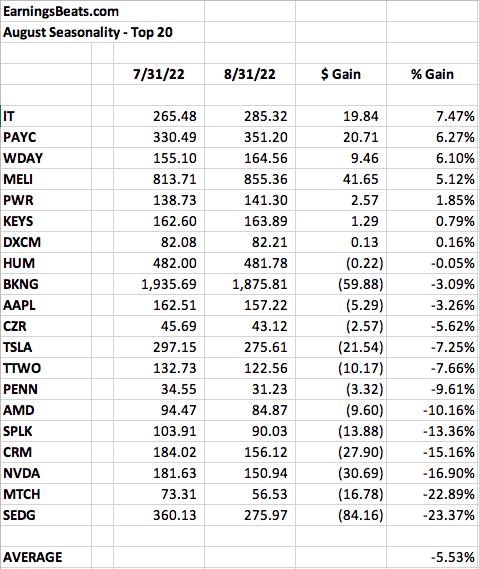
The average performance of -5.53% was slightly worse than the NASDAQ's August performance of -5.13%. The S&P 50 fared a bit better at -4.08%.
S&P 500 September Performance
Here's a breakdown of the annualized performance of the S&P 500 (since 1950) during the month of September:
- September 1-3: +33.83%
- September 4-10: -17.13%
- September 11-16: +27.65%
- September 17-26: -29.53%
- September 27-30: -8.40%
September is the big bear historically. September has risen just 32 of the last 71 years. That means it's ended lower than it started 39 times in the past 72 years. It's the only month to see falling prices more often than rising prices. The first half of September vs. the second half breakdown between bullish and bearish behavior, however, is rather stunning. Check this out:
- September 1-16: +9.46%
- September 17-30: -23.50%
Historically, the first half of September is rather normal. It's the second half of September that typically carries the most bearishness. Unfortunately, that tw0-week period is just ahead of us. Can the bulls hold up under both short-term selling pressure and historical weakness?
Sector Performance
Before we look at individual stocks, let's get an overview of how the various sectors and industries have performed during September (and October) over the past decade (during this secular bull market):
Sector Heat Map:
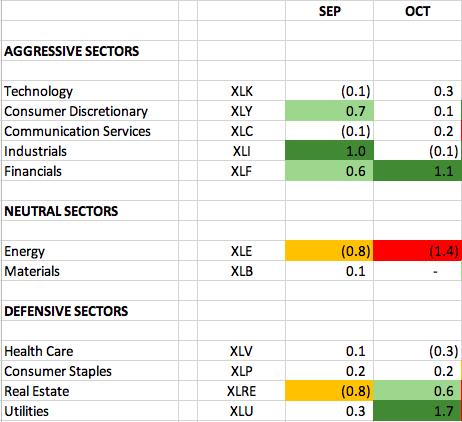
The numbers reflect how much a sector, on average, outperforms or underperforms the S&P 500 over the past 10 years. The dark green-shaded areas show significant outperformance (1.0 or greater). The light green-shaded areas show solid outperformance (from 0.5 to 1.0). The yellow-shaded areas show underperformance (-0.5 to -1.0). The red-shaded areas show significant underperformance (-1.0 or greater). Where there is no shading, there tends to be more neutral performance (-0.4 to 0.4).
During this secular bull market (since 2013), September hasn't really proven to be a horrific month for aggressive sectors - at least not on a relative basis. Industrials (XLI) and financials (XLF) tend to see the most relative strength in September and October. Industrials head into this bullish relative historical period with a recent relative strength breakout:
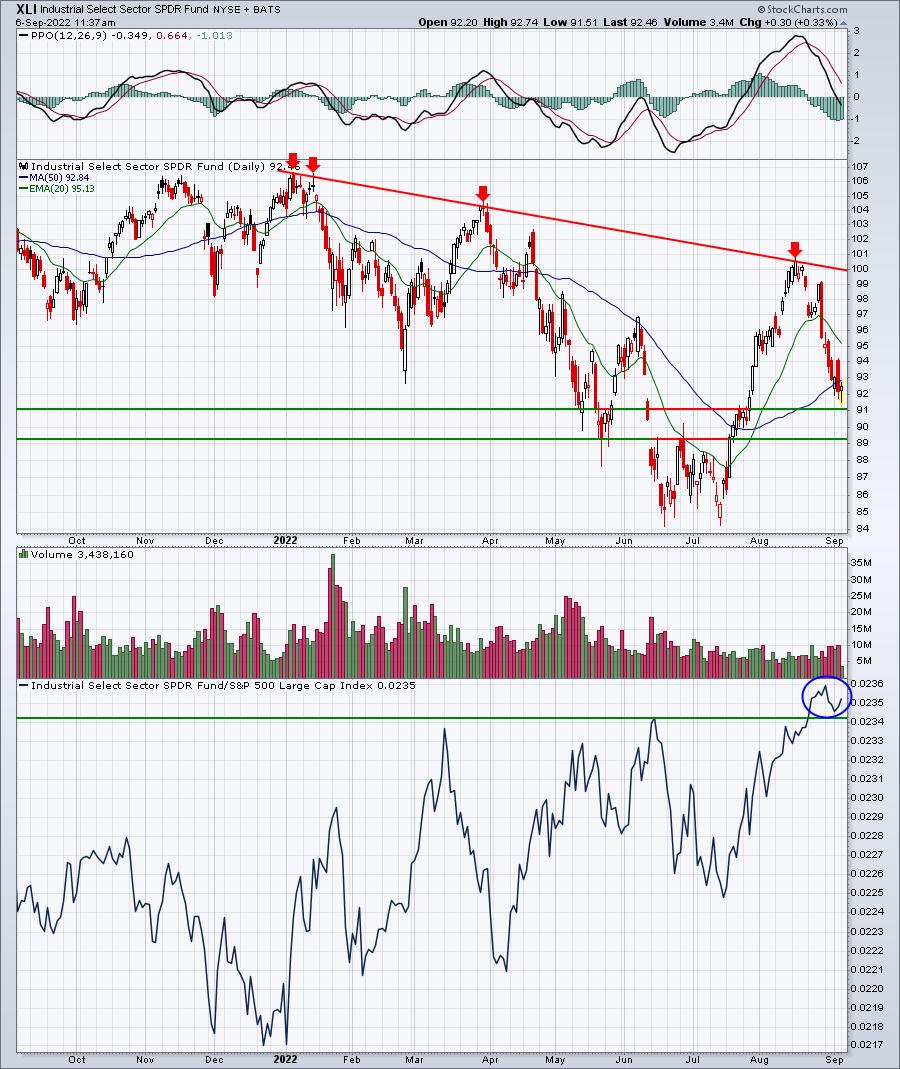
You can see that there's still much work to do on the absolute price chart, but money is rotating INTO industrials and that's a solid development for the sector.
Industry Performance
Let's take a look at the industry heat map within the industrials (XLI) to drill down to the best seasonal strength in September and October over the past decade among the various industry groups (relative to the S&P 500):
Industrials (XLI):
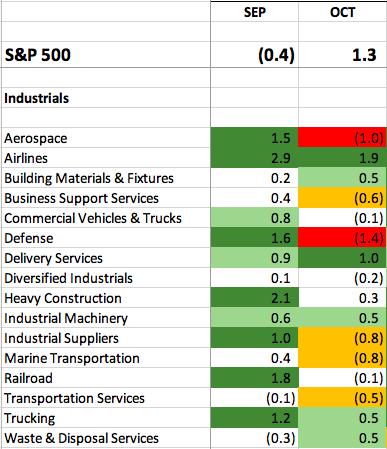
As you can see, there tends to be a lot of relative strength among the various industry groups within industrials. While airlines ($DJUSAR) show the most relative strength in September and October, it's actually the heavy construction group ($DJUSHV) that interests me technically right now:
DJUSHV:
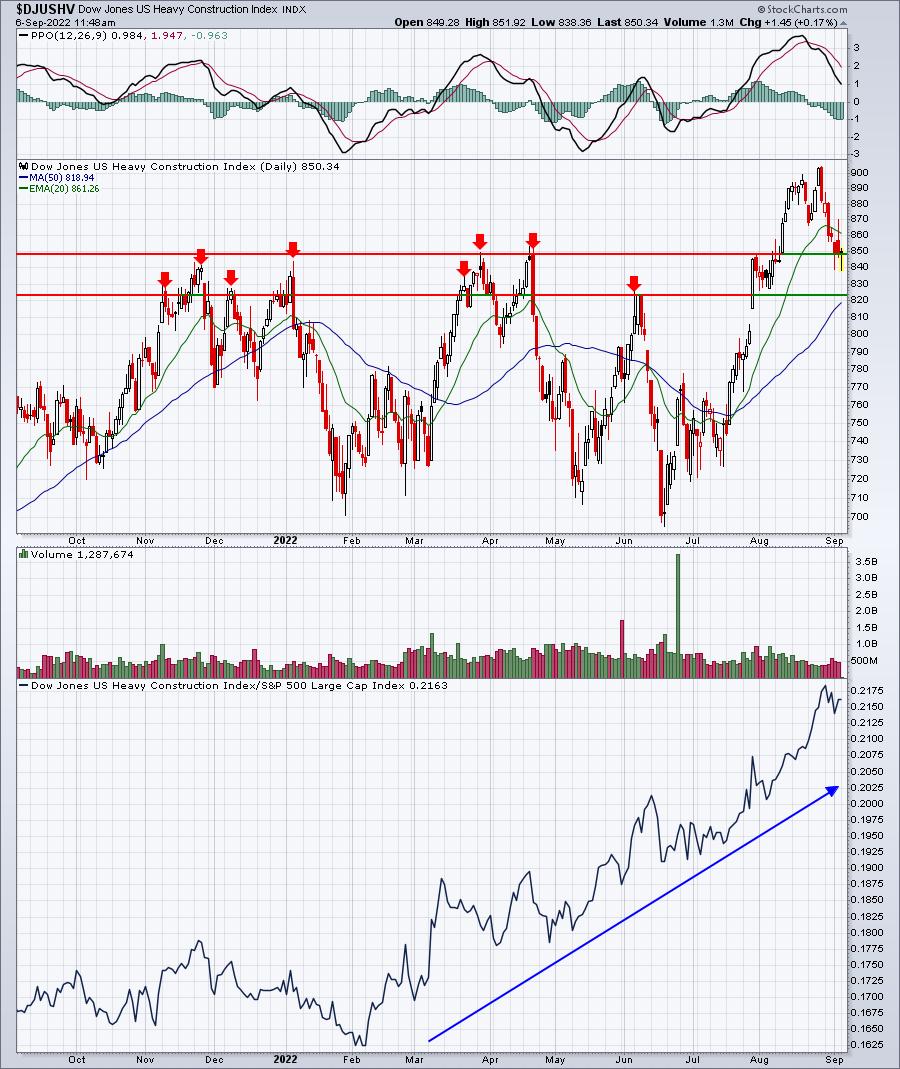
The DJUSHV showed lots of overhead price resistance between 825 and 850 for months, before finally breaking out in early August. The recent selling has taken us back to what now is price support from 825 to 850.
Here are industry groups (within sectors other than industrials) that tend to perform much better than the benchmark S&P 500 during September:
Technology (XLK):
- semiconductors
Consumer Discretionary (XLY):
- tires, footwear, recreational products, home improvement, durable household products, recreational services, auto parts, restaurants & bars
Communication Services (XLC):
- fixed line telecommunications
Financials (XLF):
- insurance brokers, life insurance
Health care (XLV):
- none
Consumer staples (XLP):
- brewers, distillers & vintners
Real estate (XLRE):
- none
Utilities (XLU):
- none
Energy (XLE):
- exploration & production
Materials (XLB):
- aluminum
Stocks for September
We've selected our Top 20 seasonal stocks for September from the S&P 500 and NASDAQ 100. Several names represent sectors and industry groups that have been discussed above. Others simply stand out in September based on their own historical track record.
The stocks this month are as follows:
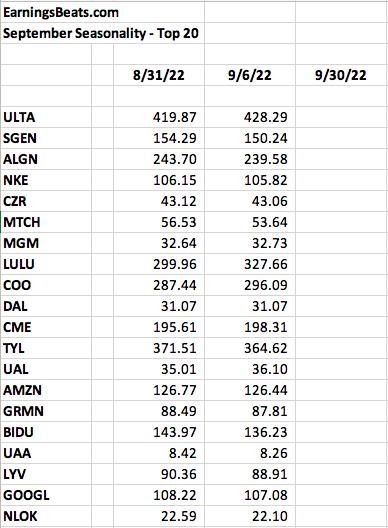
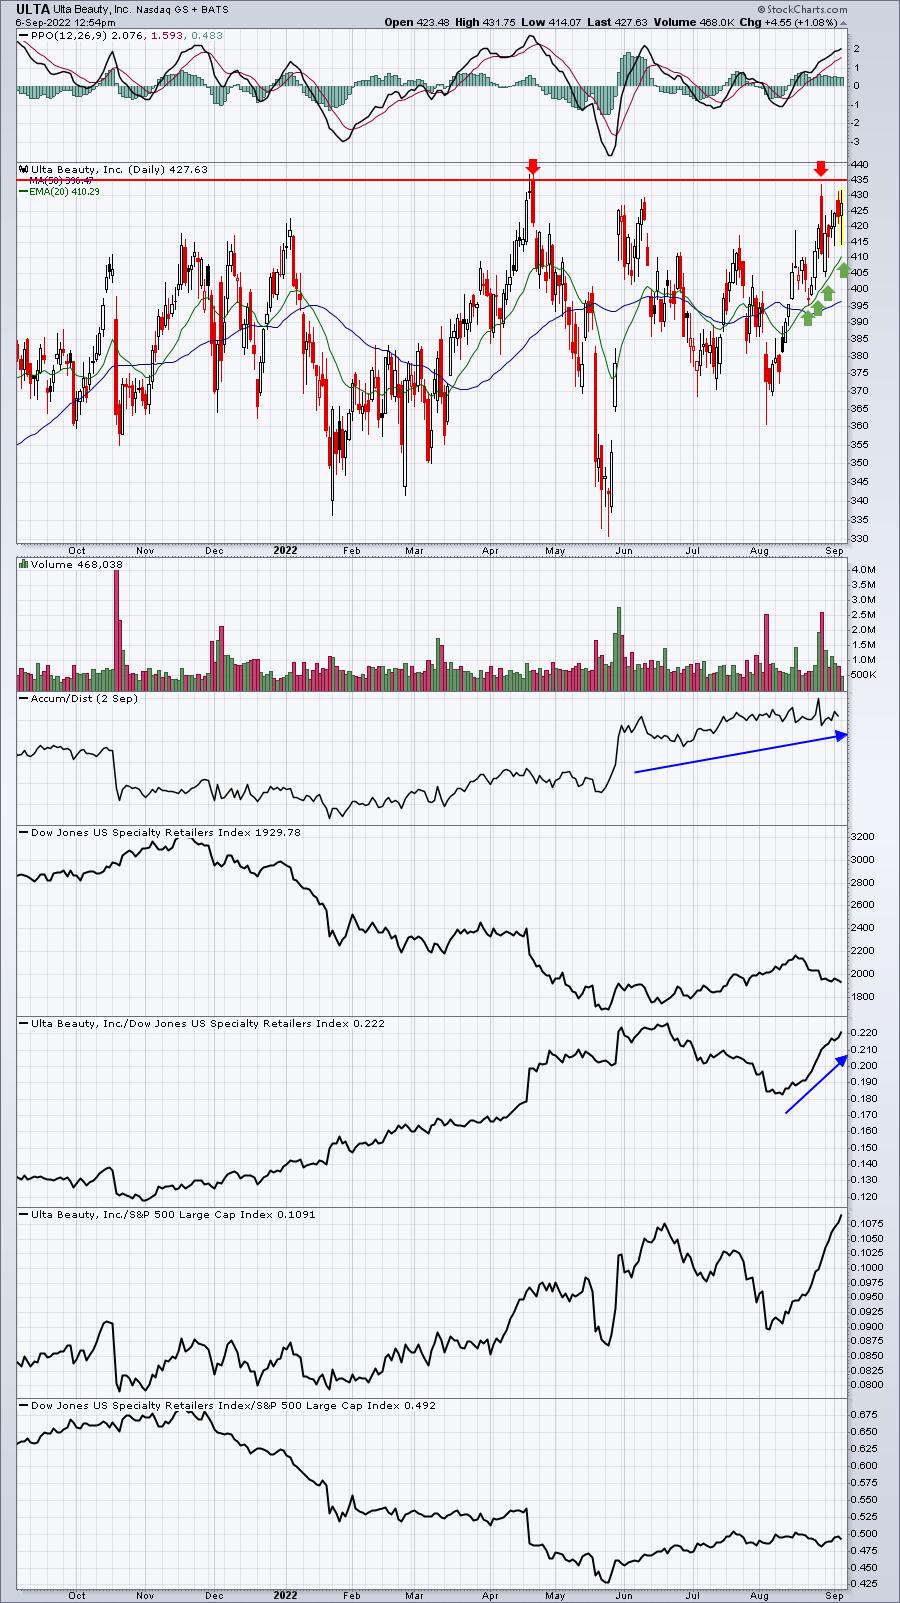
ULTA is the best September performer, but I don't buy stocks on historical tendencies alone. I like to buy a stock that technically warrants a buy AND has the seasonal bullishness as well. As I look at ULTA, I'd consider buying either on a breakout above key price resistance at 435 OR wait for a pullback to its rising 20-day EMA, currently just above 410:
A "Seasonality - September 2022" ChartList has been created and will be available for viewing/download on our website later today. You must be a StockCharts.com Extra or Pro member to download our ChartLists. Basic members and non-StockCharts.com members can view the charts one at a time. The charts will be annotated with a key support level (or two) to watch on any pullback.
If you'd like to download/view the ChartList now, the following is the link. Be sure to type in the password SEASCL5392 when prompted:
September Seasonality ChartList
If, for any reason, the link above does not work, we'll have this ChartList available on our website later today.
Happy trading!
Tom