
EB Monthly Seasonality Report - September 2023
A Look Back At August Stocks:
One month ago, we provided a list of the Top 20 stocks that had strong historical track records during the month of August. Here are how they performed in August 2023, in order of best to worst performance:
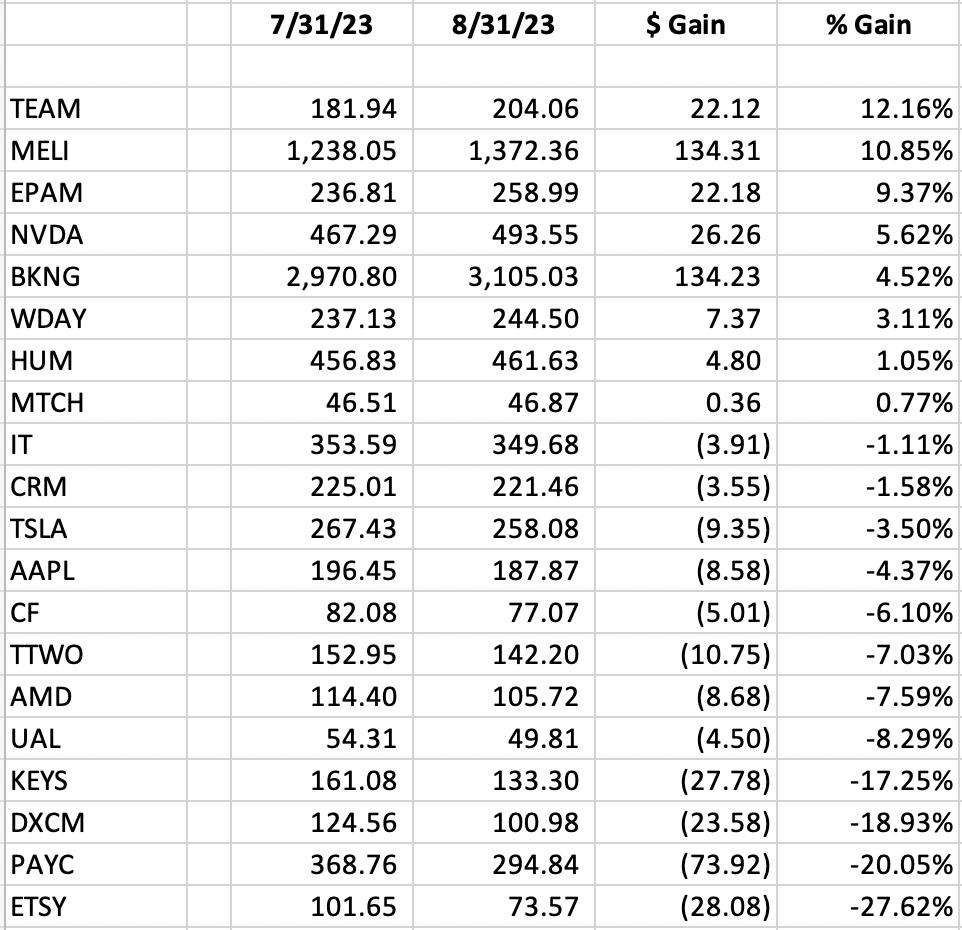
The percentages represent the returns from the July 31st close to the August 31st close. The average performance of all 20 stocks (-3.80%) trailed both the S&P 500 performance (-1.63%) and the NASDAQ performance (-1.48%). Our Top 20 Seasonality stocks trailed the benchmark indices mostly because of those bottom 4 stocks all of which reported quarterly results that Wall Street reacted poorly.
It's interesting to note that ETSY was our worst performer on this entire list. Last month, I recognized ETSY's strong July performance, but also posted the following:
"Etsy, Inc. (ETSY, +20.14%) was our #1 stock for July and it performed like it. After downtrending for 4-5 months, ETSY began to surge in early July and now it's just one day away from its latest quarterly earnings surprise. ETSY was at a 52-week relative low vs. its specialized consumer services peers ($DJUSCS) as it ended the 2nd quarter, so I'm not exactly expecting a big report tomorrow. Could ETSY's run be over? Well, I certainly would not feel comfortable holding it into its earnings report. The AD line has been going straight down since March. It didn't budge to the upside during that 20% July rally, which is worrisome. But anything can happen and usually does, especially when it comes to earnings reports."
And this is why we never use Seasonality as our primary indicator. It's a secondary indicator that should be used to help corroborate our technical opinion, not to replace it. Look what happened to ETSY:
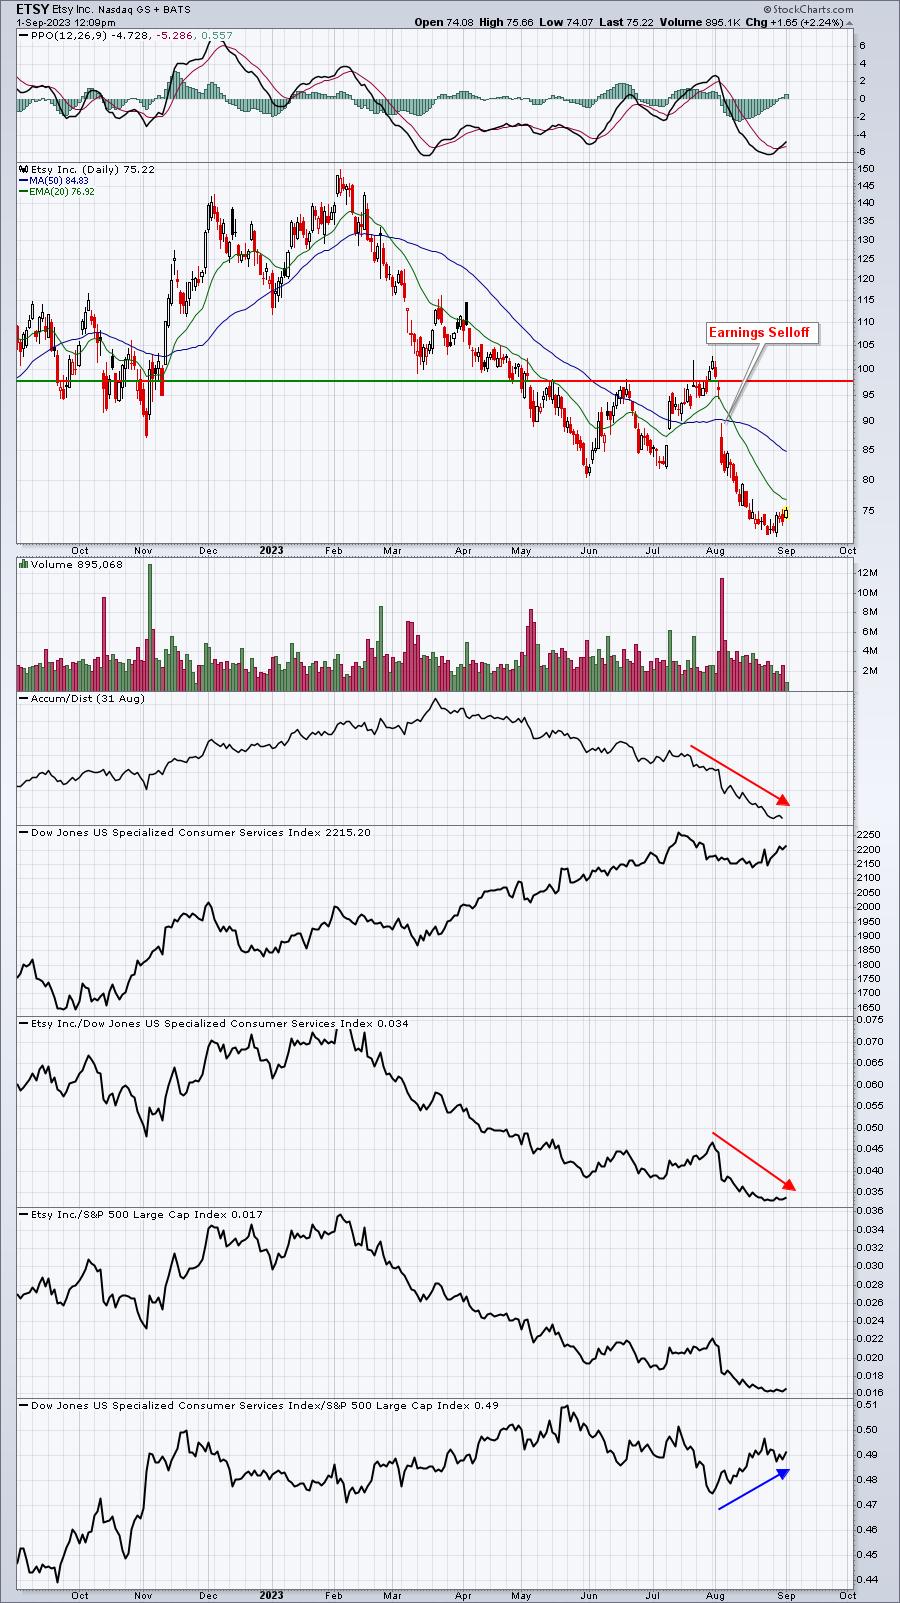
Note a couple things here. First, ETSY's peer group (bottom panel) actually performed well on a relative basis in August. But Wall Street hated ETSY's quarterly earnings report and ETSY's AD line and relative strength deteriorated further and even more rapidly during August. So while seasonality was bullish for ETSY, we should never ignore what's happening technically on a chart.
S&P 500 September Performance
Here's a breakdown of the annualized performance of the S&P 500 (since 1950) during the month of August:
- September 1-3: +31.68%
- September 4-10: -14.08%
- September 11-16: +23.28%
- September 17-30: -25.85%
Here's another way to look at September performance:
- September 1-16: +8.67%
- September 17-30: -25.85
September, while being the worst calendar month of the year, isn't bad the entire month. The first half (September 1 through 16) performs about equal to the S&P 500's 9% annual rate of return over the past 73 years. It's the second half of September (September 17 through September 30) that does the damage. September, in the aggregate, has gained ground 32 of 72 Septembers since 1950, which is the worst among all calendar months. September's annualized return since 1950 is -7.81% and ranks dead last among all calendar months.
September is also the beginning of a bullish historical period for value stocks vs. growth stocks. Check out this RELATIVE seasonality chart since this secular bull market began in 2013:
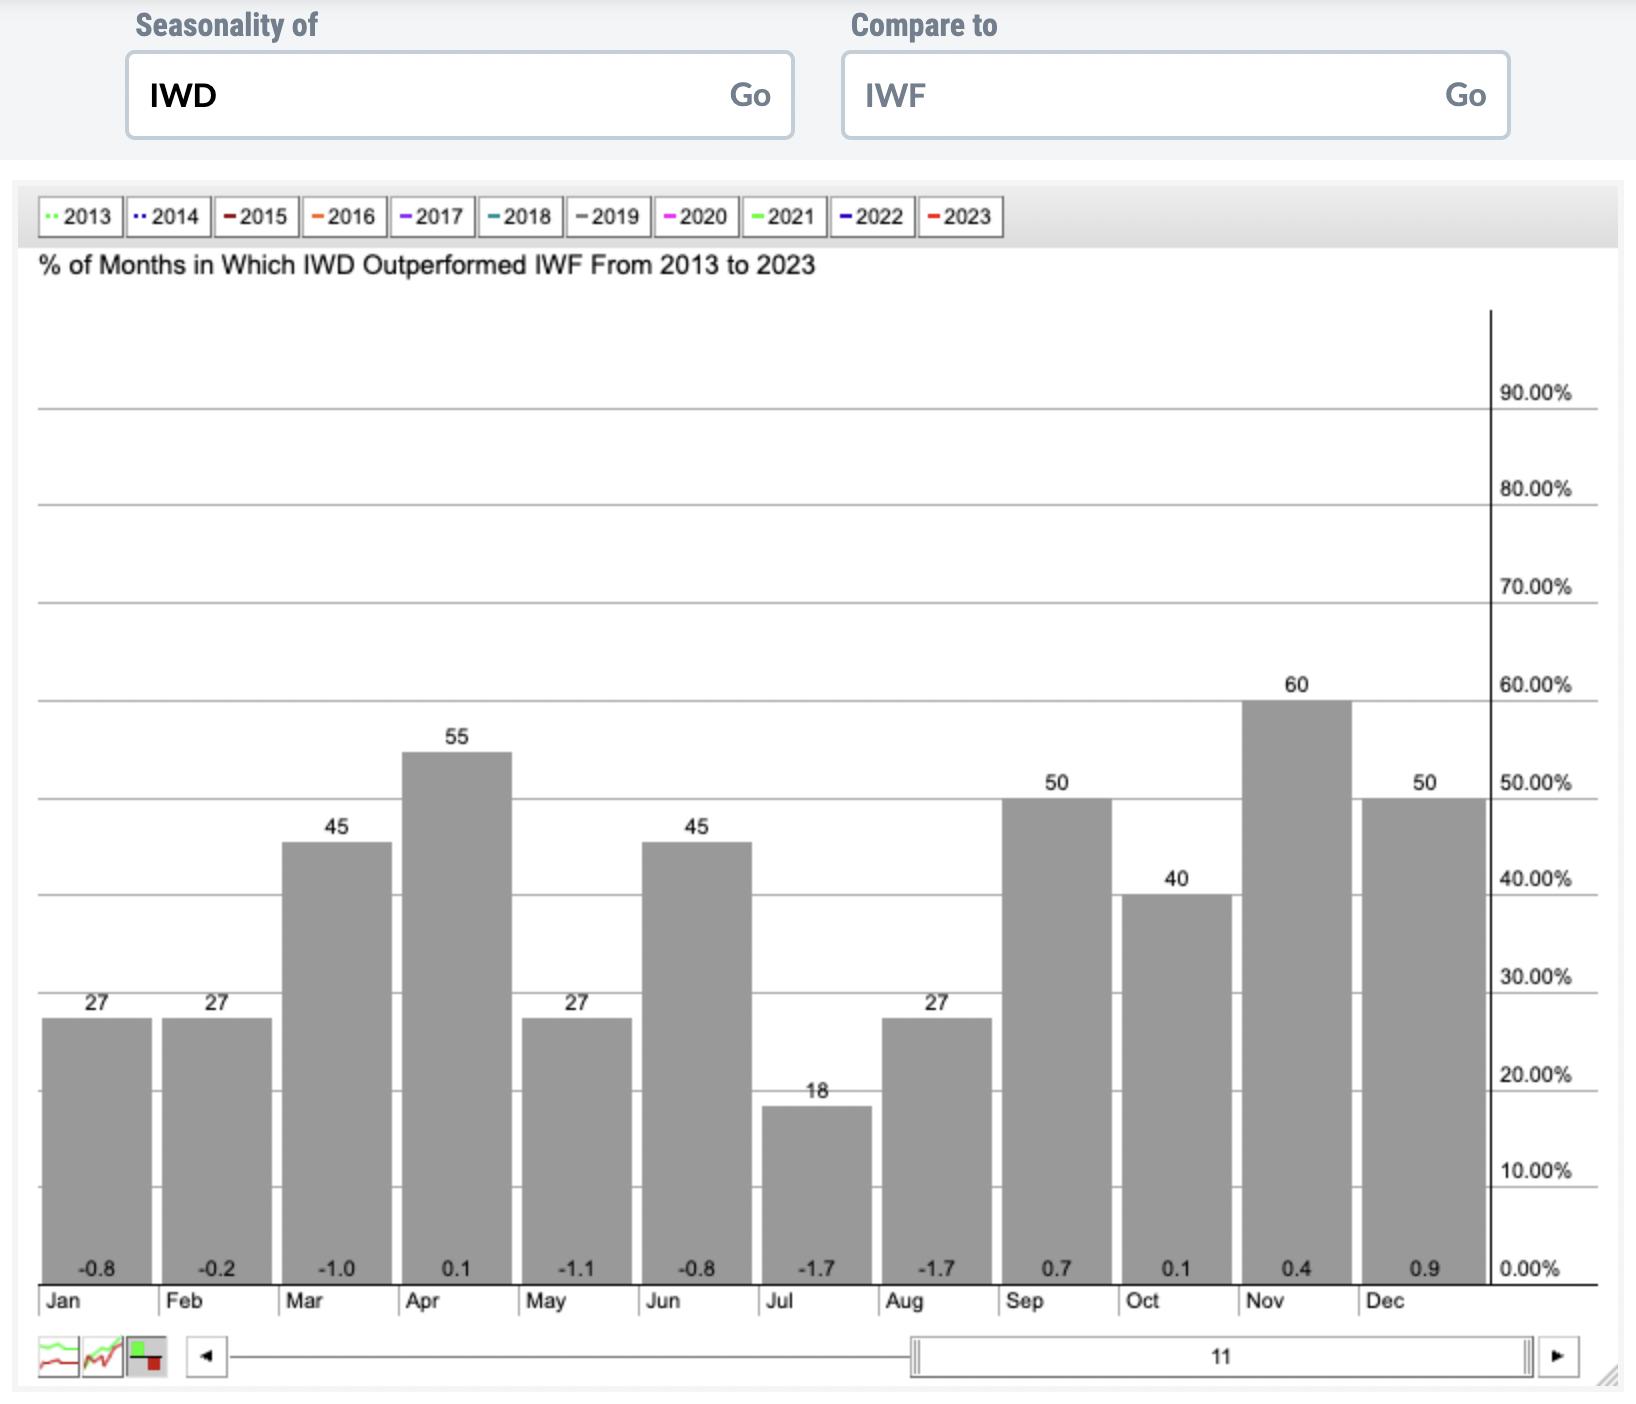
The IWD (large cap value) has a history of outperforming the IWF (large cap growth) from September through December, after trailing during nearly every other month from January through August. If you add the average monthly returns at the bottom for September through December, you get total outperformance of 2.1 percentage points since this secular bull market began. If you add the other 8 months, you get total UNDERPERFORMANCE of 7.2 percentage points. Again, relative strength of value vs. growth rebounds from now through the end of the year - at least historically. Therefore, I'll be watching for Wall Street to rotate into value stocks, areas like industrials, financials, and energy.
Sector Performance
Before we look at individual stocks, let's get an overview of how the various sectors and industries have performed during September (and October) over the past decade (during this secular bull market):
Sector Heat Map:
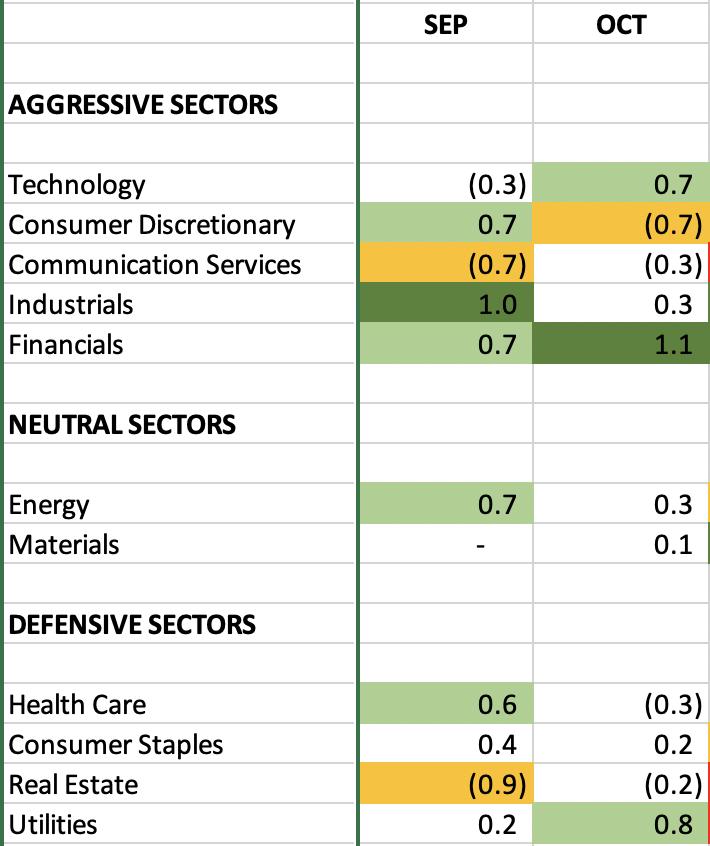
The numbers reflect how much a sector, on average, outperforms or underperforms the S&P 500 over the past 10 years. The dark green-shaded areas show significant outperformance (1.0 or greater). The light green-shaded areas show solid outperformance (from 0.5 to 1.0). The yellow-shaded areas show underperformance (-0.5 to -1.0). The red-shaded areas show significant underperformance (-1.0 or greater). Where there is no shading, there tends to be more neutral performance (-0.4 to 0.4).
Leadership in September has come from industrials (XLI). Here's what the XLI looks like as we enter September:
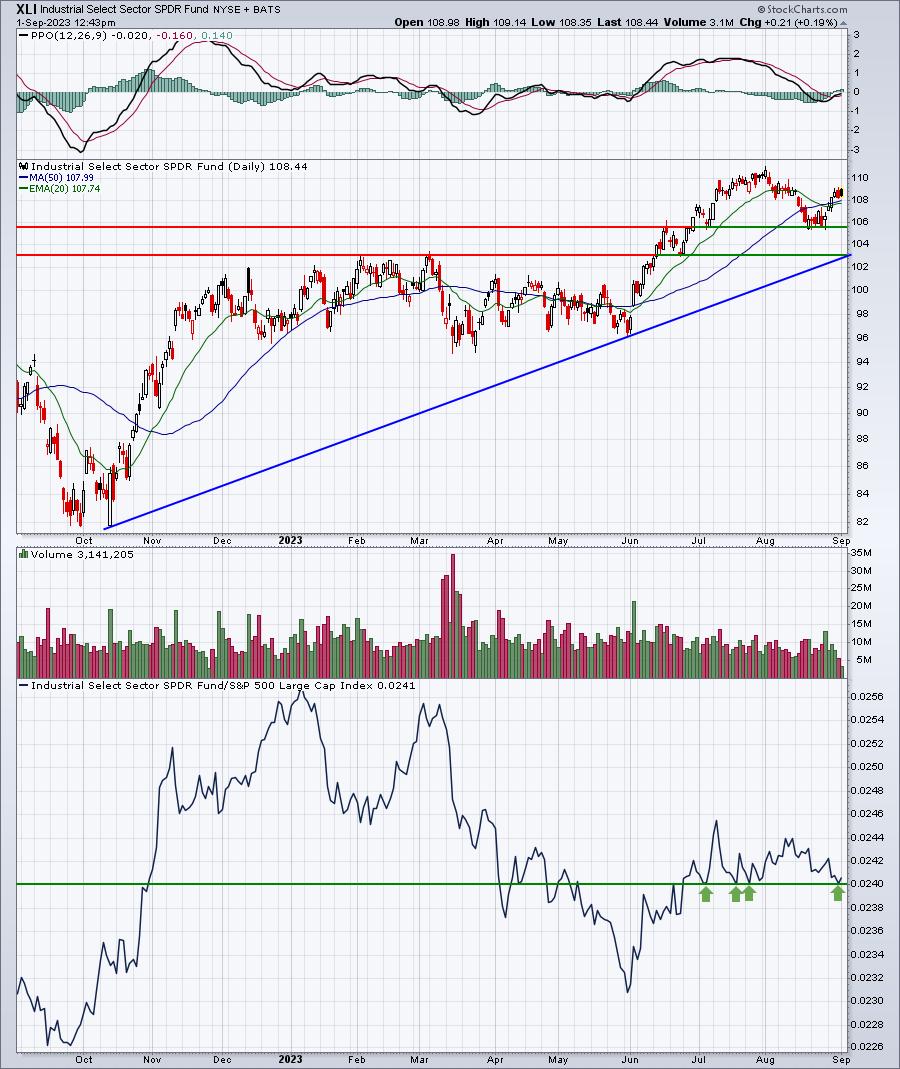
The XLI looks pretty solid here as we enter September and I believe the group is poised to lead us over the next several weeks. Technical support resides near 103 as that's where both price support AND trendline support converge. Also note that the relative support (vs. the S&P 500) is at 0.0240. If both the absolute and relative support fail, then we'd need to re-evaluate. Until that happens, however, I'd consider the XLI to be the best sector as we move throughout the balance of the year.
Industry Performance
Let's take a look at the industry heat map within industrials to drill down to the best seasonal strength in September and October over the past decade among the various industry groups (relative to the S&P 500):
Industrials (XLI):
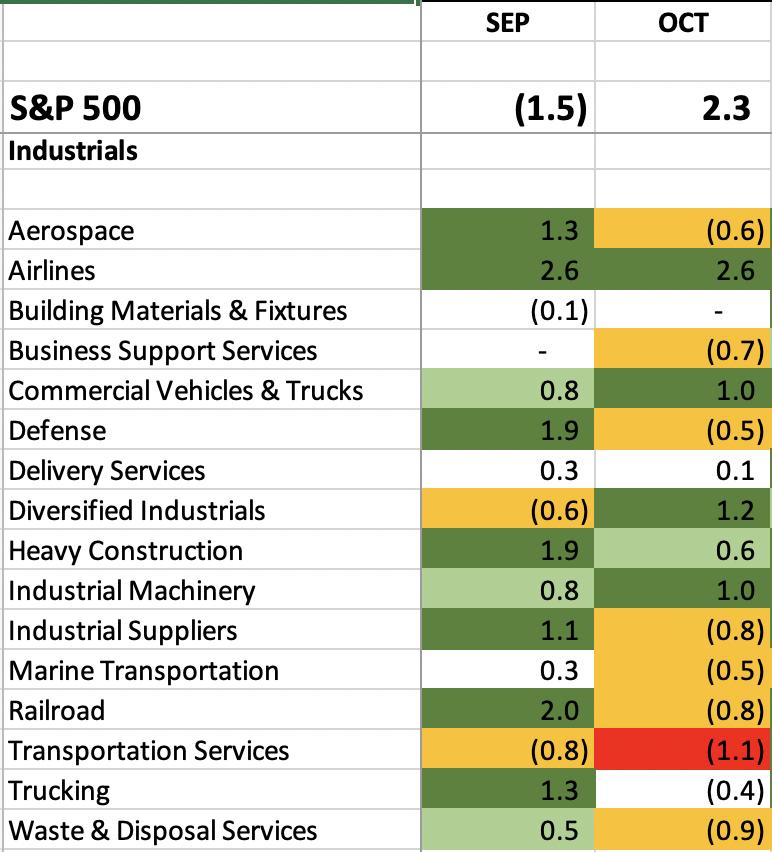
The September historical strength in industrials has been led by two key industries, airlines ($DJUSAR) and railroads ($DJUSRR). Interestingly, neither of these industry groups look good on their daily charts. The long-term weekly charts look much better, however. I've discussed airlines recently, so let's look at the railroads:
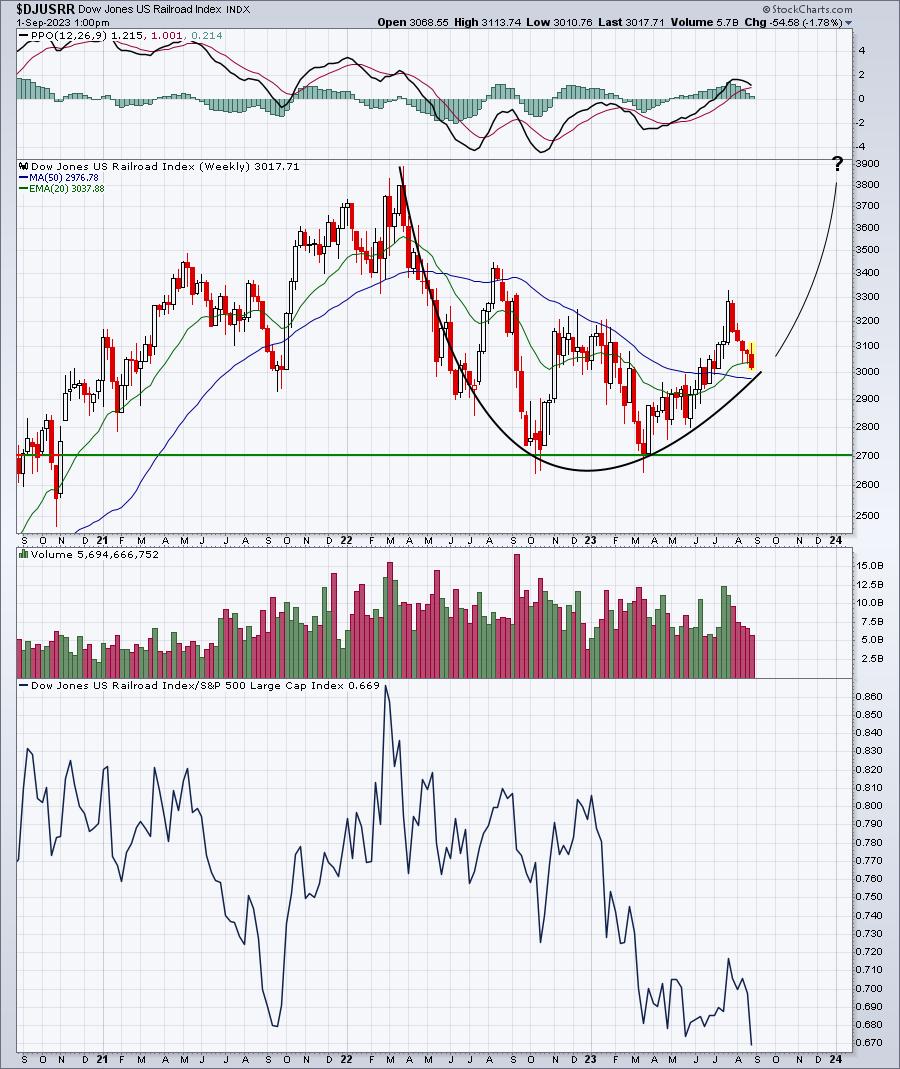
A long-term cup perhaps? I know relative strength needs to improve as the bottom panel above shows the DJUSRR at a multi-year relative low vs. the S&P 500. A rebound from here wouldn't be out of the question, based on the historical performance of railroads over the balance of the year. Check this out:
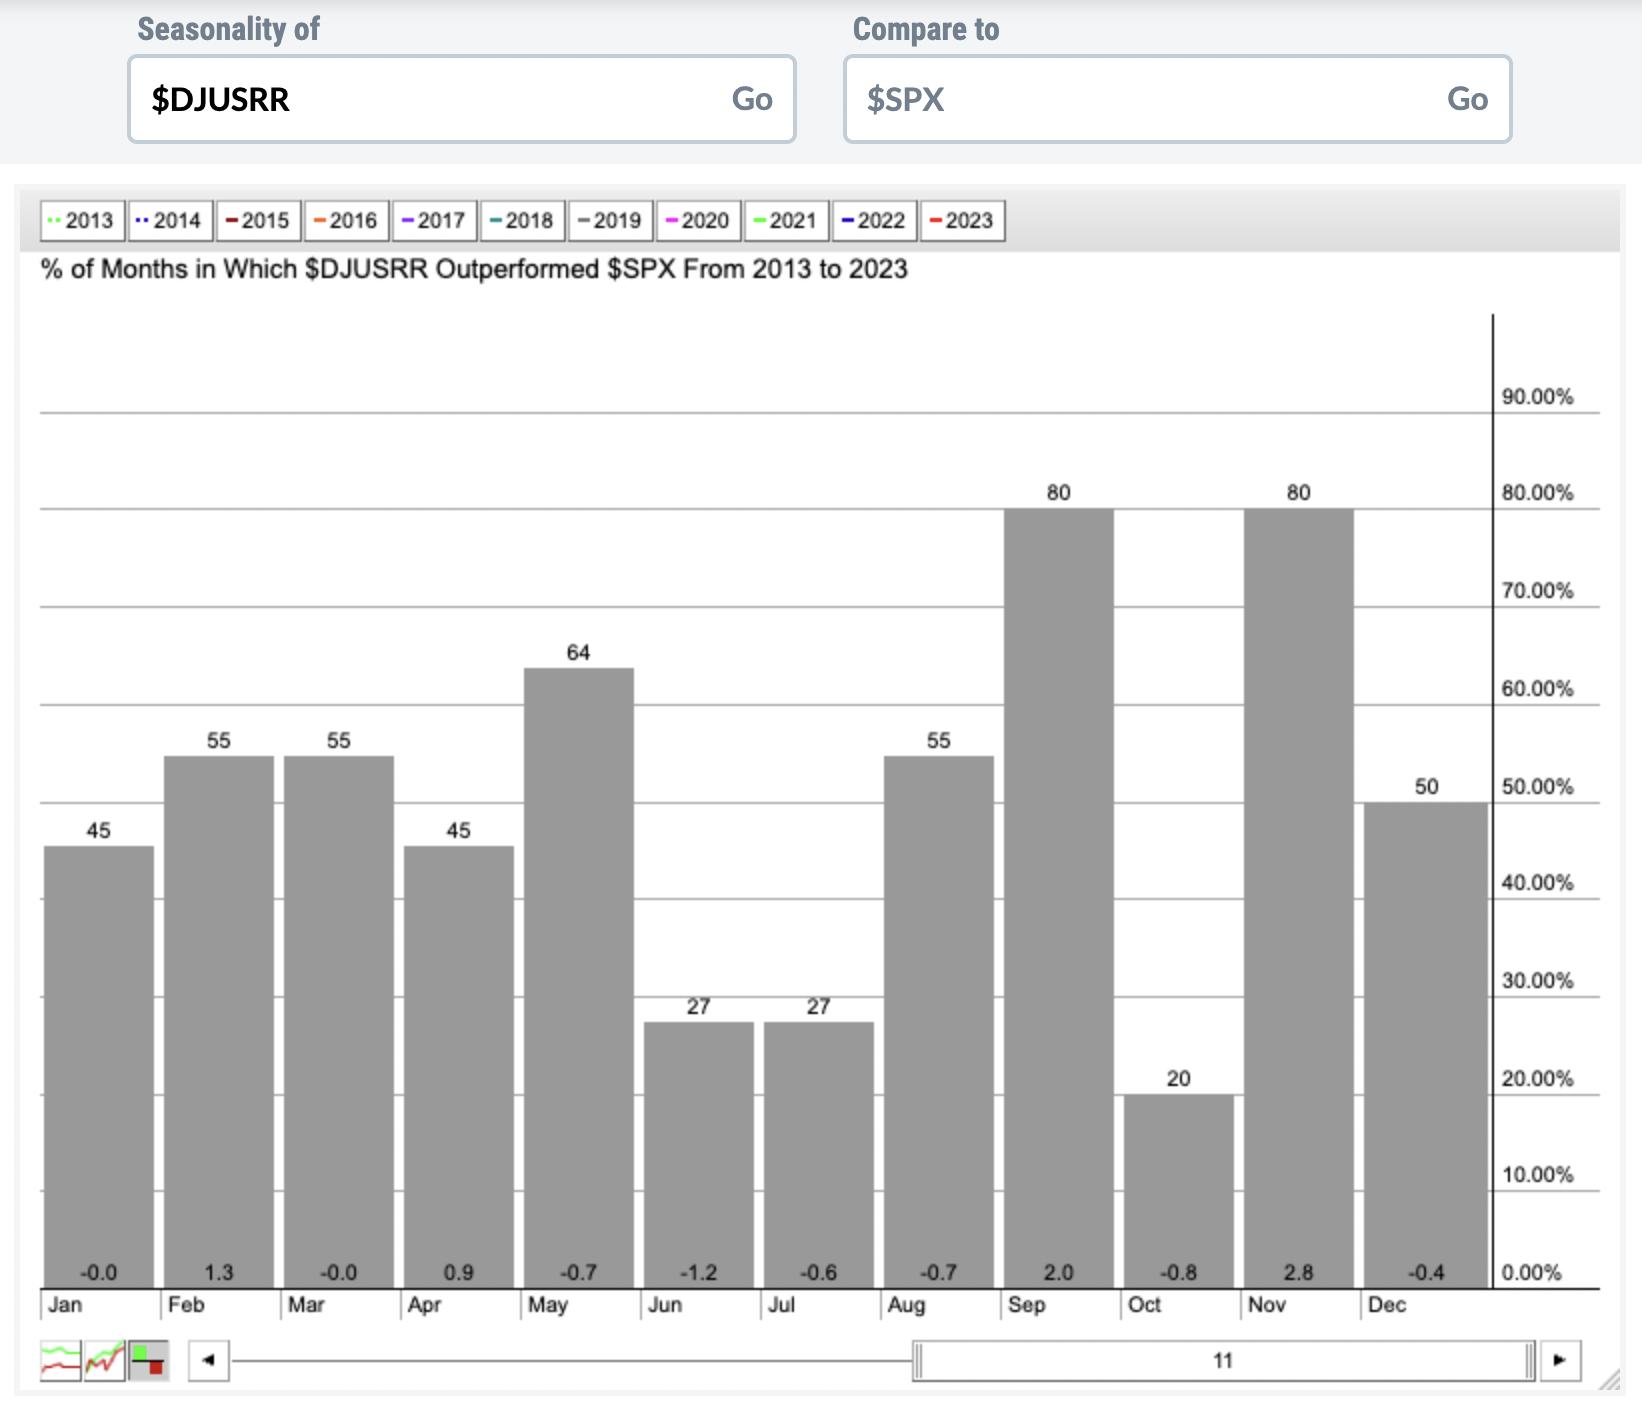
During the September through December period, the DJUSRR averages outperforming the S&P 500 by 3.6 percentage points since 2013. During the other 8 months, the DJUSRR averages underperforming the S&P 500 by 1.0 percentage point. At least on a historical basis, we're moving into the seasonal sweet spot for railroads. We'll soon find out if it helps.
Here are industry groups (within sectors other than industrials) that tend to perform much better than the benchmark S&P 500 during September:
Technology (XLK):
- semiconductors
Consumer Discretionary (XLY):
- footwear, recreational products, home improvement retailers, specialty retailers, apparel retailers, auto parts, restaurants & bars
Communication Services (XLC):
- media agencies
Financials (XLF):
- insurance brokers, life insurance
Health care (XLV):
- none
Consumer staples (XLP):
- brewers, tires, distillers & vintners
Real Estate (XLRE):
- none
Utilities (XLU):
- none
Energy (XLE):
- exploration & production
Materials (XLB):
- none
Stocks for September
We've selected our Top 20 seasonal stocks for September. Several names represent sectors and industry groups that have been discussed above. Others simply stand out in September based on their own historical track record.
The stocks this month are as follows:
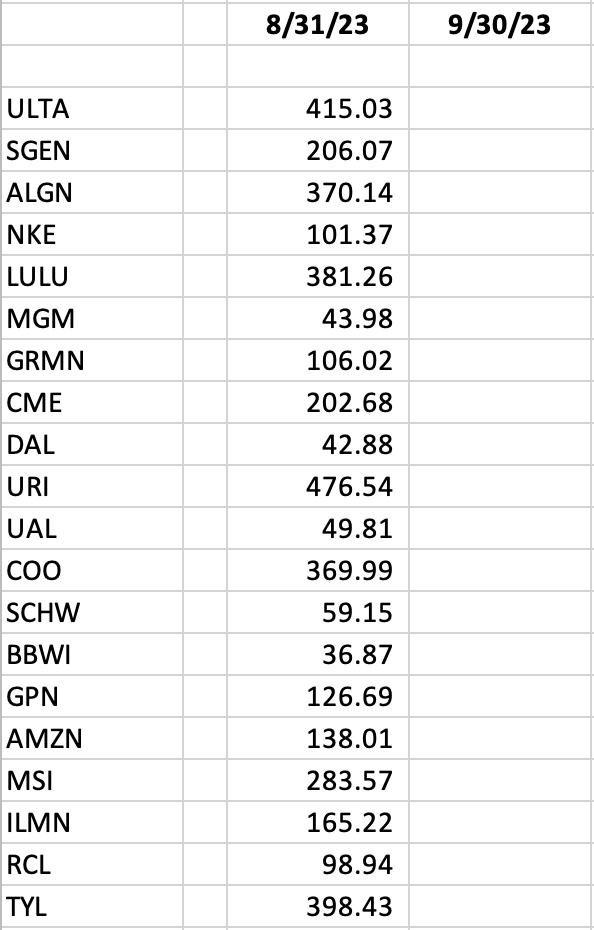
A "Seasonality - September 2023" ChartList (annotated with 1 or 2 support levels to watch) has been created and will be available for viewing/download on our website later this weekend. You must be a StockCharts.com Extra or Pro member to download our ChartLists. Basic members and non-StockCharts.com members can view the charts one at a time.
Happy trading!
Tom