
EB Weekly Market Report - Monday, September 25, 2023
Thanks to everyone that has provided feedback after our first three EB Weekly Market Reports. Please keep it coming! We've read every comment and intend for this report to evolve over the next few weeks based on changes that we believe make sense, along with making a few changes based on your suggestions. One change that we absolutely are trying to address is how our report appears in your email. We understand it's annoying to scroll back and forth to read our content. The appearance currently depends on your email provider, but we'll have a solution that will work for everyone. Please continue to provide us your feedback. You can reach out to us at "[email protected]". Again, we read every comment so now is a GREAT time to have your voice heard.
Below is our fourth EB Weekly Market Report. As you will see, each EB Weekly Market Report will address different areas and asset classes. It's a different report with a unique perspective, unlike our Daily Market Reports, which focus much more on the here and now. We intend to publish on either Sunday or Monday of every week, but ultimately we'd like to publish on Sundays - ahead of the opening bell on Monday. When I'm traveling or otherwise busy on the weekend, Monday will be our other option. This weekly report replaces our Monday EB Daily Market Report and provides all of our members with a broader "Big Picture" outlook on the U.S. stock market. Our market outlook will focus more on longer-term weekly charts, as opposed to the daily charts more often used in our EB Daily Market Report. We believe it enhances our current product lineup and appeals to everyone - those with a longer-term mindset and those focused primarily on the near-term.
Because of our "top-down" approach to trading, it makes a lot of sense to begin each week with a Big Picture focus, citing the current long-term technical outlook and how that might impact the market given our short-term signals that we discuss daily. Our EB Weekly Market Report will also provide a consistent, once-per-week review at key sentiment and intermarket relationships that we value so highly at EarningsBeats.com and has helped us to guide our members through a very tumultuous 3-4 year period, beginning with the 2020 pandemic, right through the most recent 2022 cyclical bear market and subsequent 2023 secular bull market advance.
We'll also review the prior week's action and provide trade setups, but mostly with a longer-term mindset - think of longer-term swing trading, which should appeal to those of you that like the idea of longer-term momentum trading, providing wider stops and targets.
Here's Week 4.
Weekly Market Recap
Major Indices
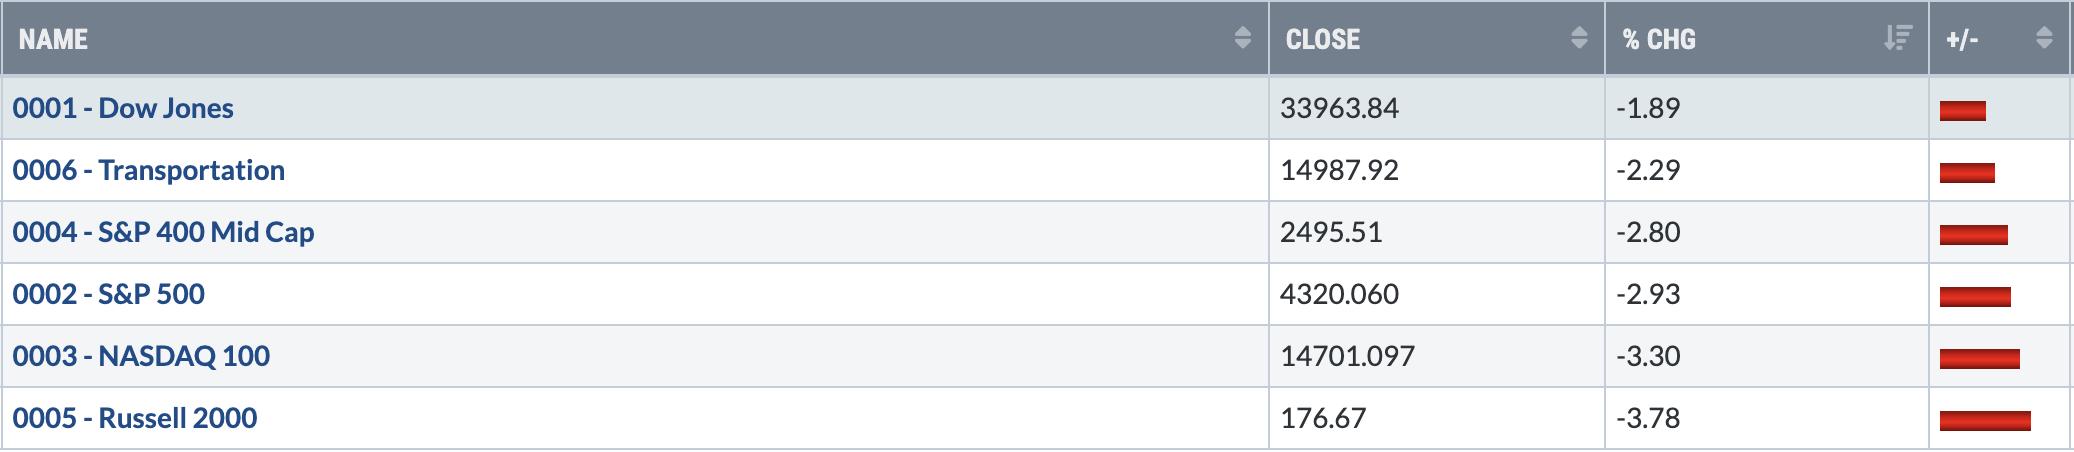
It was a rough week for U.S. equities, across the board. There weren't many safe havens as the very bearish time from September 20th through September 26th kicked in. The NASDAQ shows this significant seasonal weakness extending right through the end of September, while the Russell 2000 doesn't exit its historical period of bearishness until the second week of October. While I believe we're moving closer and closer to a tradable bottom, there's little suggesting that we won't see lower lows in the week ahead.
Sectors
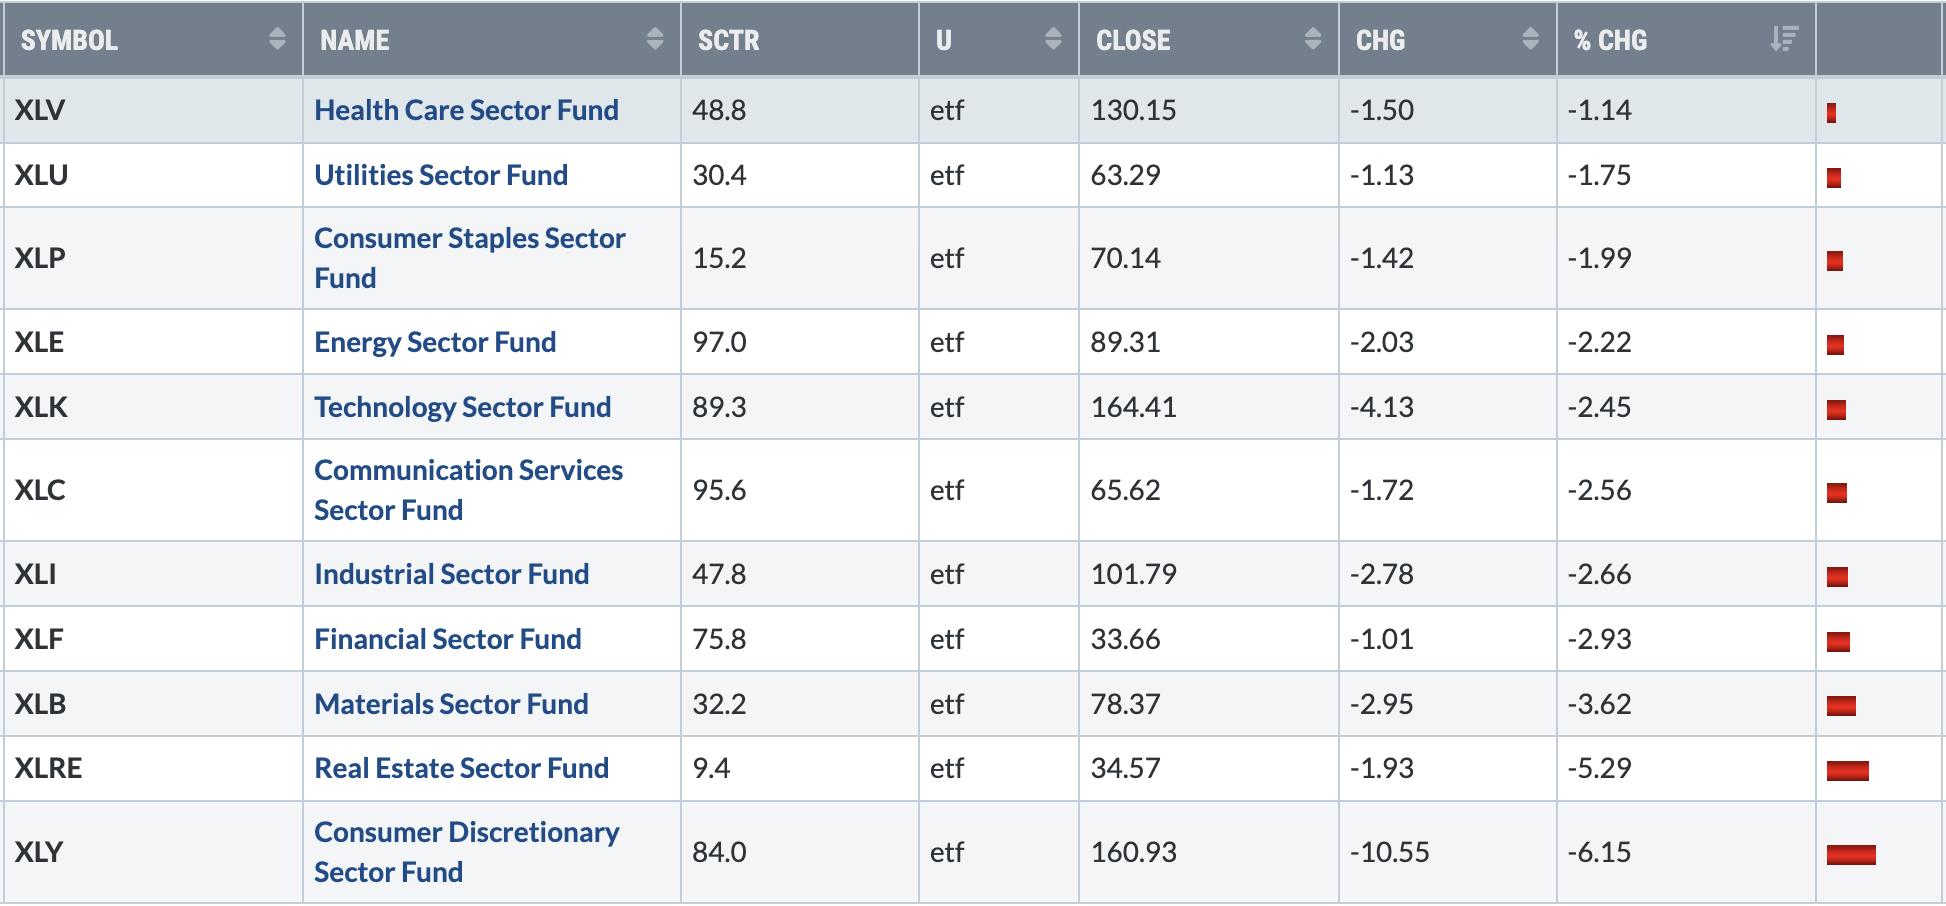
Again, it was difficult to find much in the way of safety last week, though if we dig a little deeper into health care, we'll find that health care providers ($DJUSHP) trailed only reinsurance ($DJUSIU) as the best-performing industry group across the entire market for the week. It clearly outperformed all other health care areas though:

This is a group that I highlighted in our very first EB Weekly Market Report in early September. At that time, we were hitting a key channel support low. Here's that chart - updated:
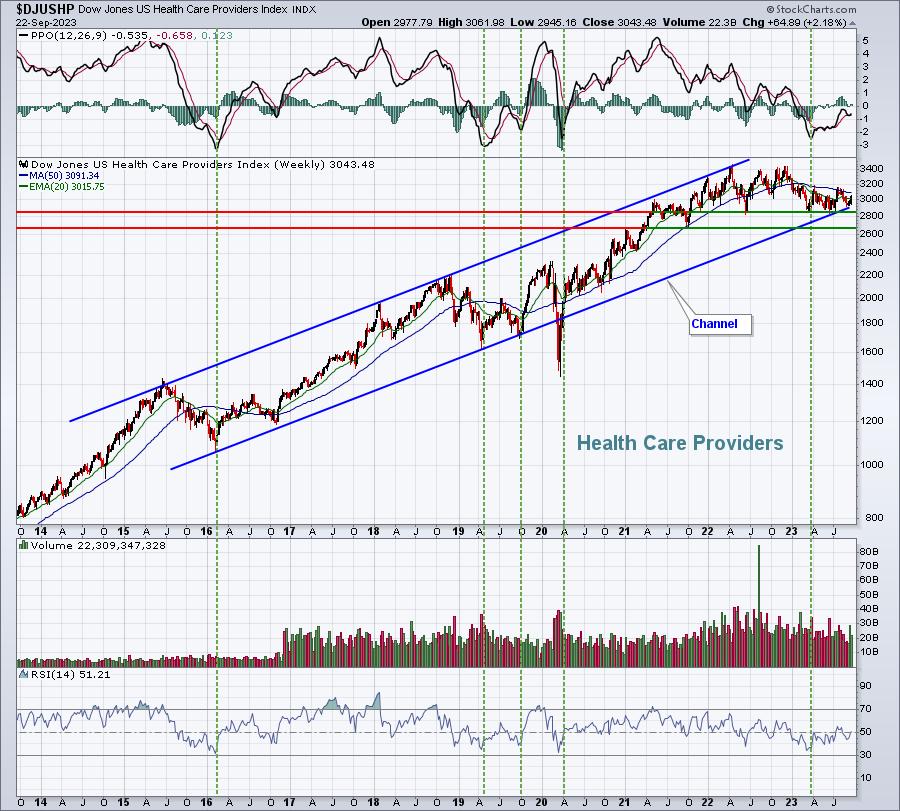
The timing of a rebound couldn't have been much better.
Meanwhile, consumer discretionary (XLY) underperformed consumer staples (XLP) by a wide margin. That was the first week in the last five weeks that the XLY trailed the XLP. I consider it more of a short-term setback than a long-term problem, but it's a relationship that I watch very, very closely, and it was clearly negative last week.
Top 10 Industries Last Week
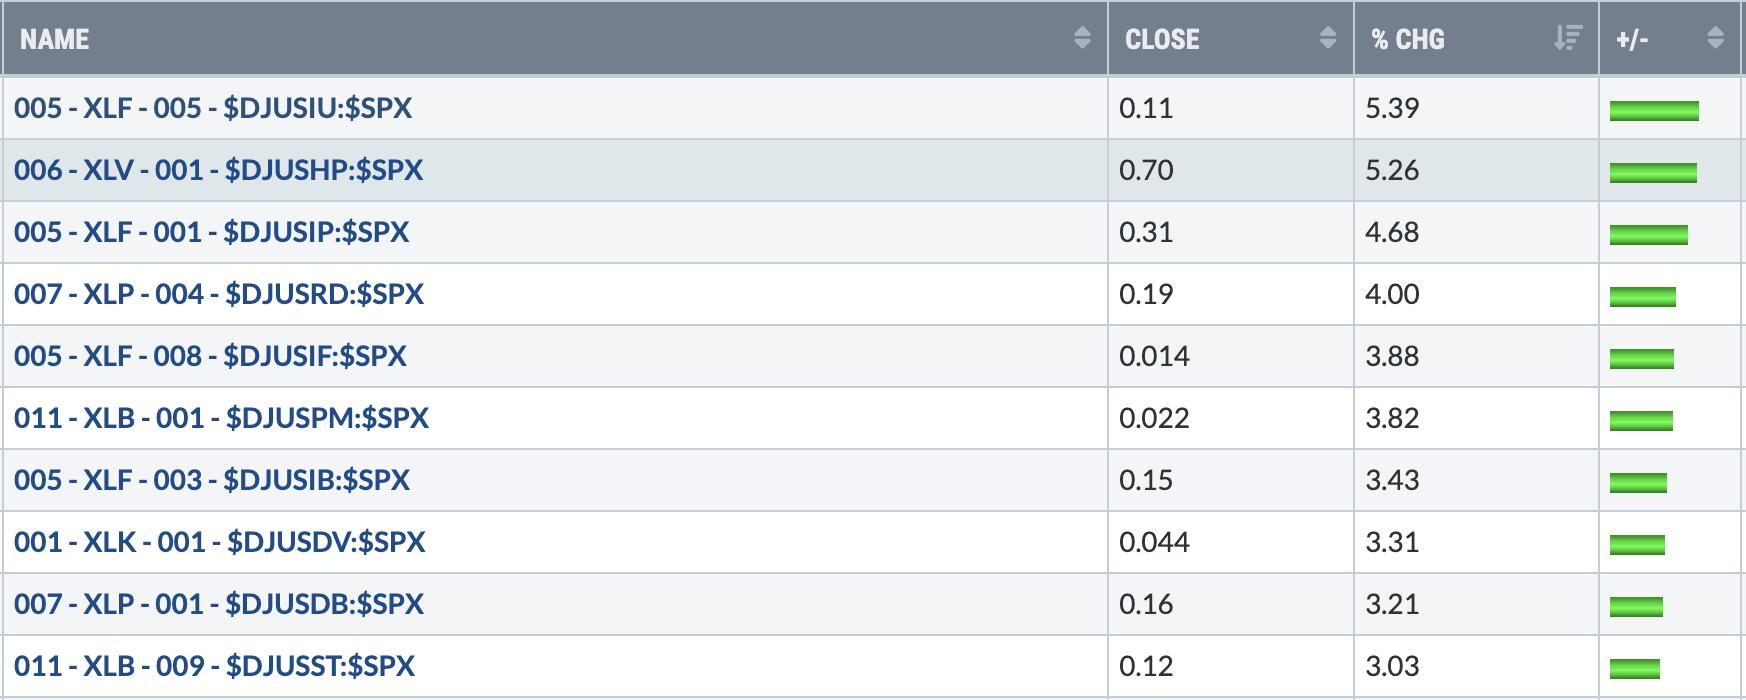
I've numbered industry groups in this ChartList by including the sector that they're in. You can see that the best industry groups last week mostly resided in value-oriented areas like financials (XLF), health care (XLV), staples (XLP), and materials (XLB). One sector not represented, however, is industrials (XLI). I'm expecting to see strength in the XLI sooner rather than later. It didn't happen last week. The XLI did outperform the S&P 500, but it remained mostly in the "middle of the pack" in terms of sector performance.
It's notable that property & casualty insurance ($DJUSIP) not only ranked 3rd last week, but also broke above key price resistance established in February 2023. Check this out:
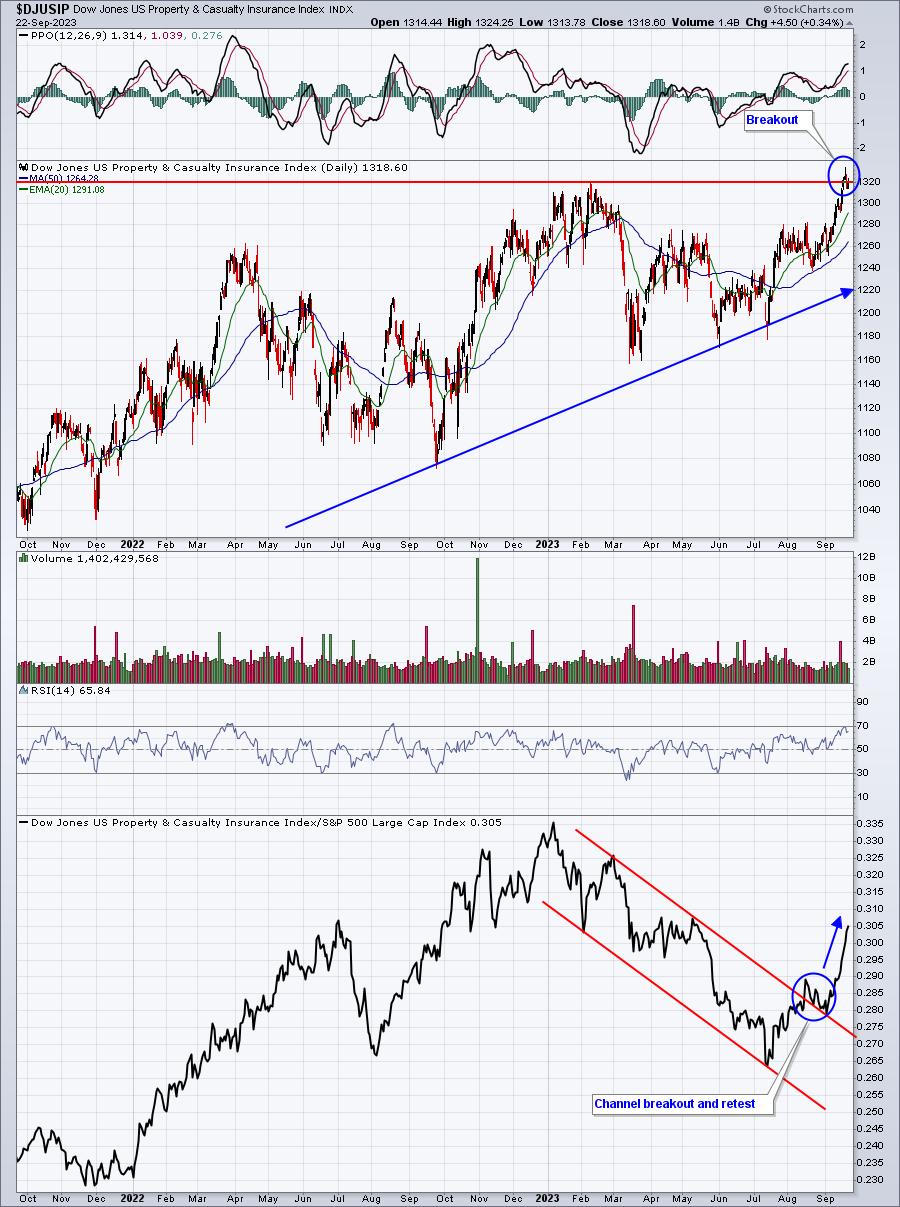
Remember, we're looking for rotation into more value-oriented areas in Q4 as money rotates away from growth for a period, and the DJUSIP is a perfect example of this. It is SOARING relative to the S&P 500. If you trade individual stocks, consider groups like this that are now showing leadership.
Bottom 10 Industries Last Week
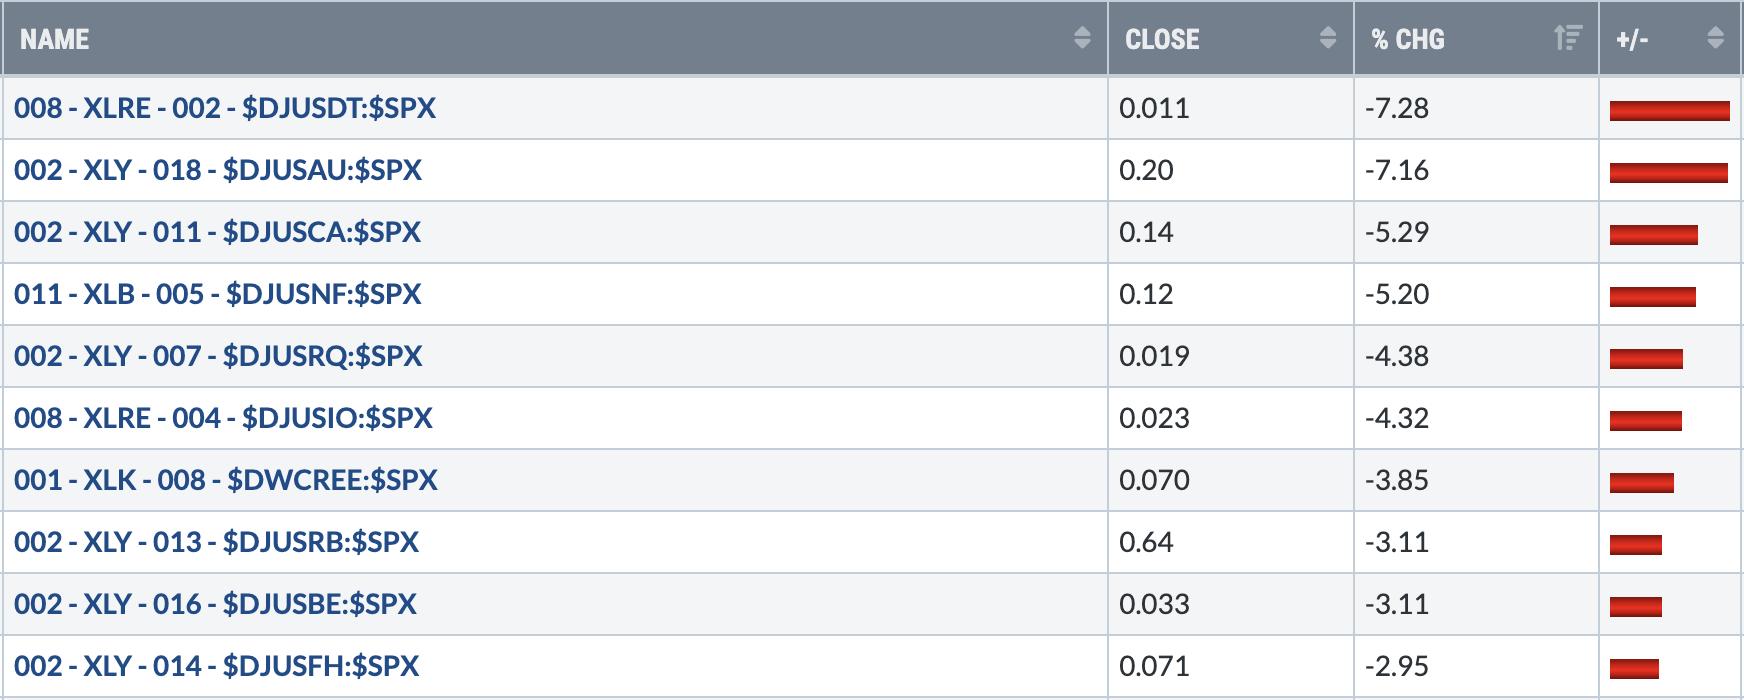
And here is the flip side to that rotation story. Of the 10 bottom industry groups last week, 6 came from consumer discretionary. Two others came from real estate (XLRE), which cannot get out of its own way. One group that I thought could be due for a nice rebound - recreational services ($DJUSRQ) - broke down in a big way, dropping another 4.4% to tack on to its huge decline since late-July.
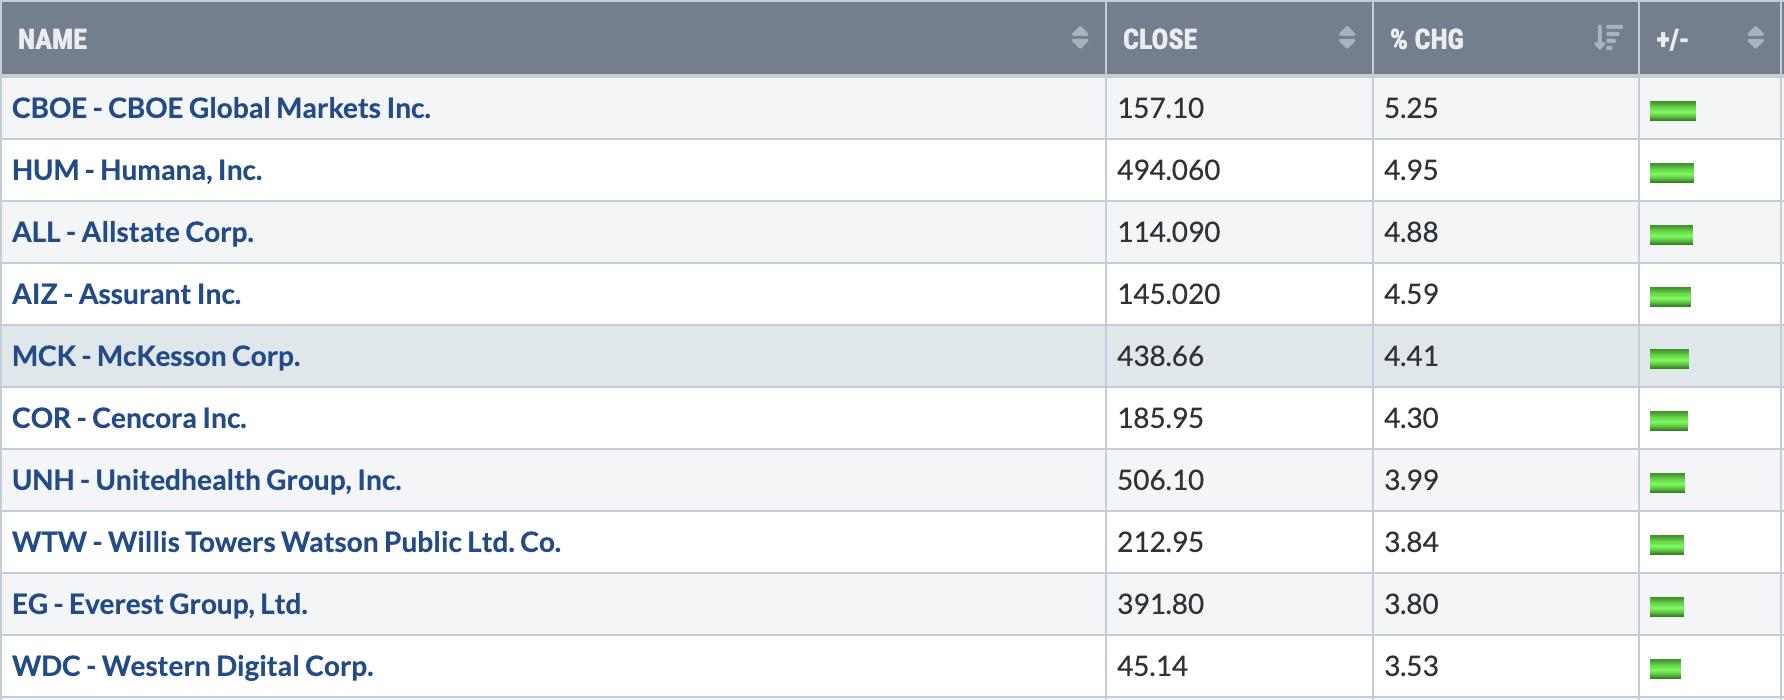
Top 10 Stocks - S&P 500/NASDAQ 100
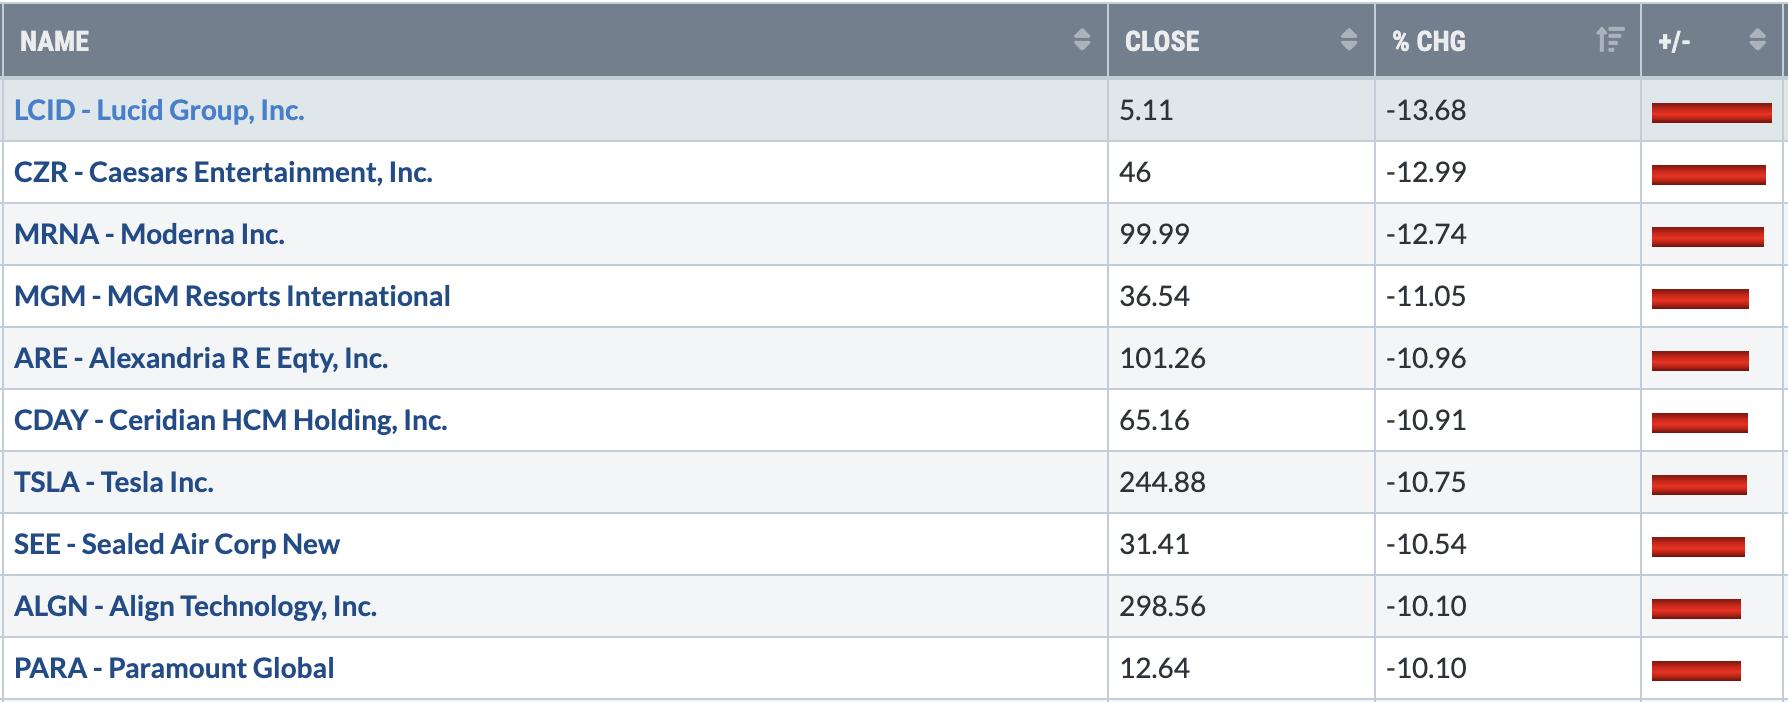
Bottom 10 Stocks - S&P 500/NASDAQ 100
Big Picture - September 2023
This is a chart that doesn't change much from week to week. Accordingly, beginning in October 2023, I will only provide this chart in the first EB Weekly Market Report of each calendar month.
Just as I did last week, I'm providing a quick refresher. What's interesting is that not much has changed on this long-term chart. But if you listen to the media, the sky began falling last week. This chart helps us keep perspective in mind. For more details on the chart, please refer to our first EB Weekly Market Report (three weeks ago):
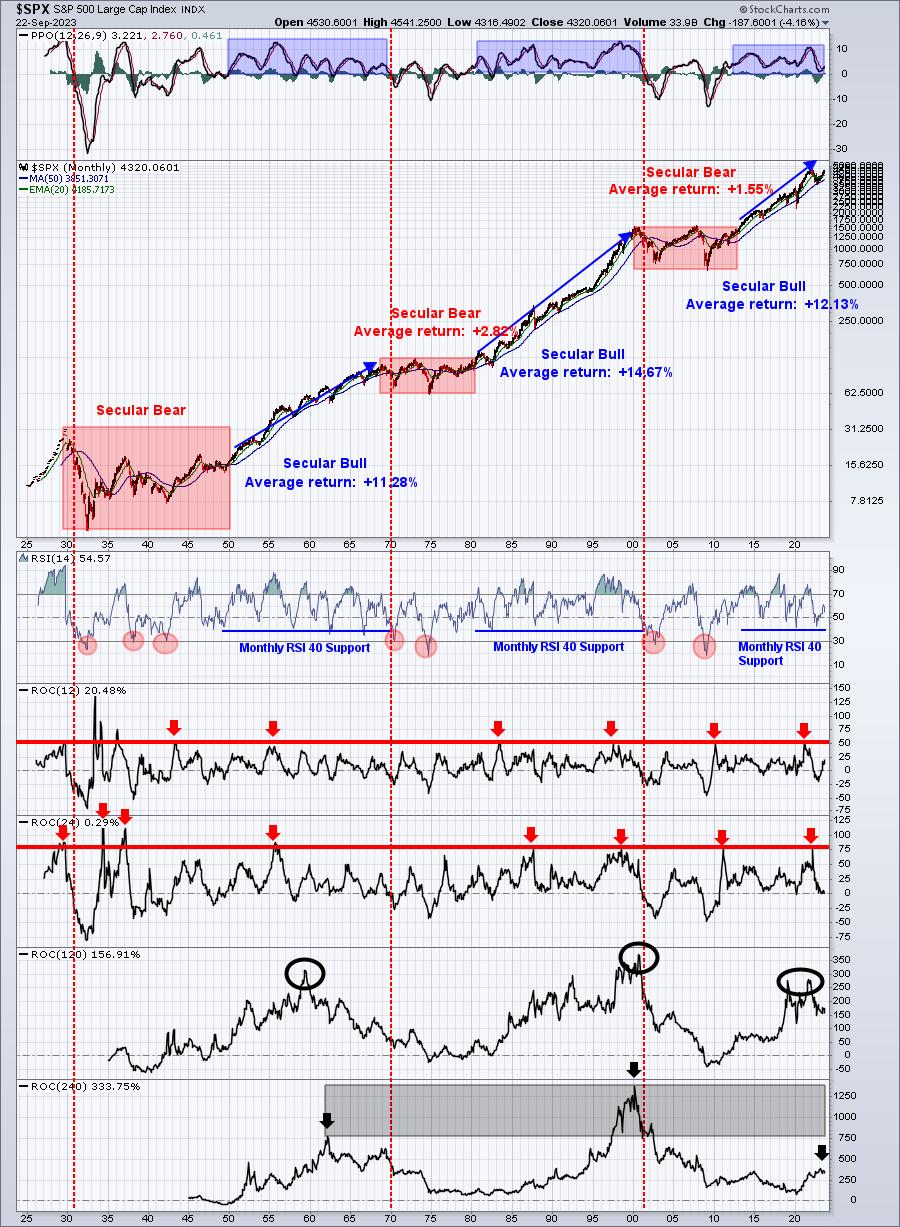
September Update:
Please refer to commentary from our first EB Weekly Market Report. It takes a LOT to change long-term perspective. Nothing has changed in the past three weeks. It's extremely important that we ALWAYS keep this chart in mind when evaluating the market from week-to-week or month-to-month.
Major Indices
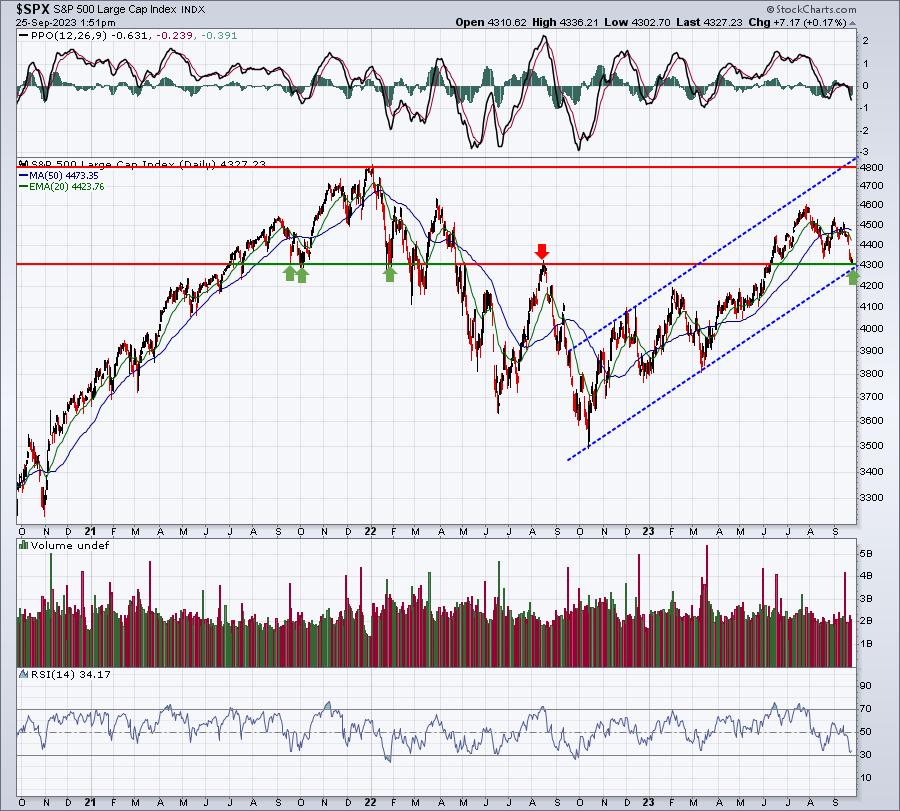
I have two comments this week on the S&P 500. First, while many others are writing off the stock market, especially given last week's massacre, I'm looking at this as a GREAT opportunity heading into Q4. The S&P 500 has solid price support at 4305. Trendline support comes in very close to this level as well, though trendlines can be drawn rather subjectively. Check out this chart:
My second thought is this. The short-term 60-minute chart of the S&P 500 is showing a positive divergence, which will only be stronger if the S&P 500 moves lower one more time. Check this out:
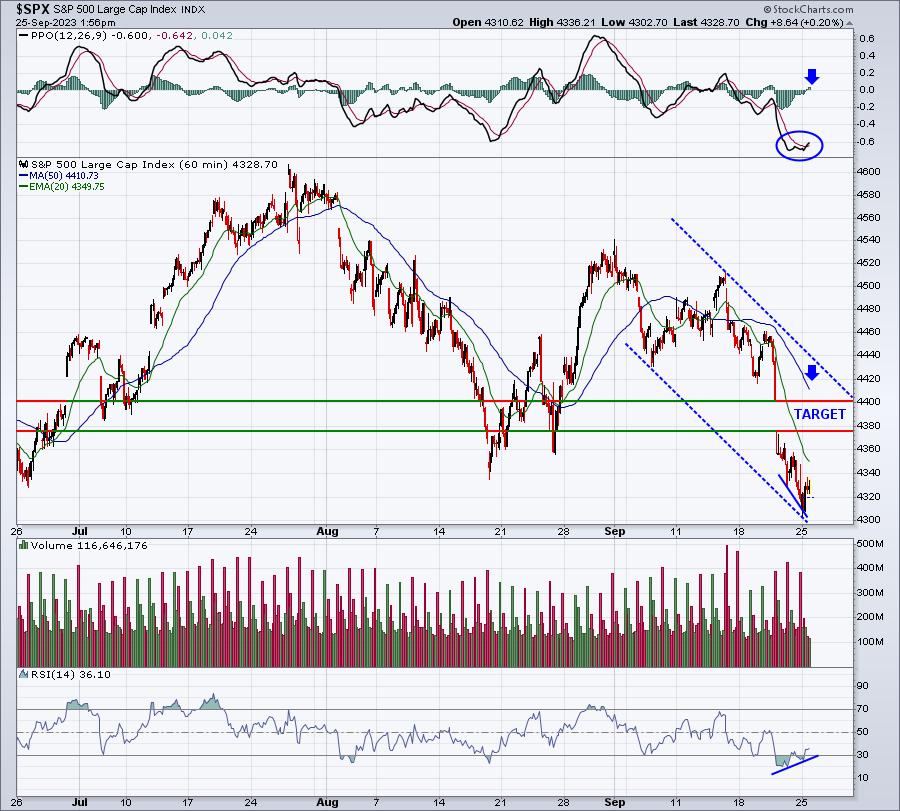
The positive divergence is slight right now, but another low would likely accompany a significant positive divergence. I would look for a short-term target of 4375-4400. If the S&P 500 breaks what is setting up to be a down channel to the upside, that would be a very bullish signal for Q4.
Sentiment
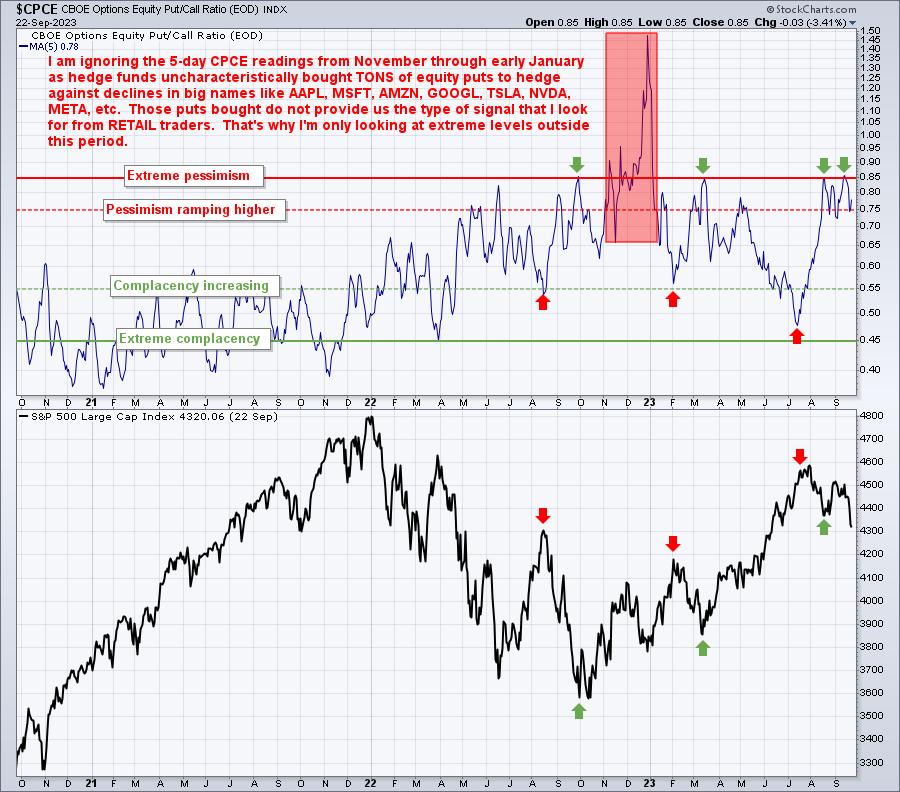
Equity-only put-call ratio ($CPCE):
Once again, I believe it's very important to discuss the 5-day SMA of the CPCE. We were at .85 last week and we remain at .78 right now, which is still an extremely bearish reading. Remember, however, that this is a CONTRARIAN indicator. High readings tend to mark very important stock market bottoms. This number is quite likely to jump after today's close as the reading from 5 days ago was .61 and, according to cboe.com, today's number will likely be much higher and it will replace the .61 number. If today's CPCE turns out to be .81, then the 5-day SMA will jump to .83 level again. A .91 reading today would send this moving average back to .85 again. Here's the current state of this sentiment reading:
PORTFOLIO STRATEGY CHANGE:
I began moving from the IWM to the TNA this morning. I might be a little early pulling the trigger, but my signals are telling me we are very close to a reversal and move higher. The seasonally weak July 17th through September 26th period ends tomorrow at the close. Sentiment tells me the rubber band is stretching further and further and that we should expect a bounce-back rally very soon. The beginnings of positive divergences are showing up on 60-minute charts. The hourly positive divergences on the QQQ and IWM are more pronounced than the SPY. Trendline support is being tested. And the key 4305 support level on the S&P 500 was tested this morning as we reached a low of 4302.
Please keep in mind that you are responsible for your own trades. I communicate my opinions and my own personal trading strategies via EarningsBeats.com, but you are absolutely FREE to disagree with my approach. That's what makes a market. I'm certainly not right all the time and I may not be right this time. But I believe the RISK has shifted to being short and that now represents a solid risk to reward entry on the long side.
One other consideration. The S&P 500 has printed lower lows 13 of the past 15 days, with no two days of consecutive higher lows. This is the definition of a downtrend. Some of you might want to see some form of price confirmation of a bottom before turning more bullish. That could be two consecutive days of higher highs and lows. Even though we're trying to finish in positive territory, there's still plenty of time left in the trading day and we could be at our lows again at the day's close. I point this out because many traders do not like to ASSUME a trend will change. Rather, they want to see it first. A more conservative approach would be to see the market show some strength before entering. It's completely up to you.
Crude Oil and Copper
These are two commodities that provide us global signals of economic demand vs. supply. Sometimes, they can be clouded with geopolitical concerns (especially crude oil), but they do provide us solid signals that we need to pay attention to. To illustrate this, let me highlight both of these commodities and their correlation with the S&P 500:
Crude Oil:
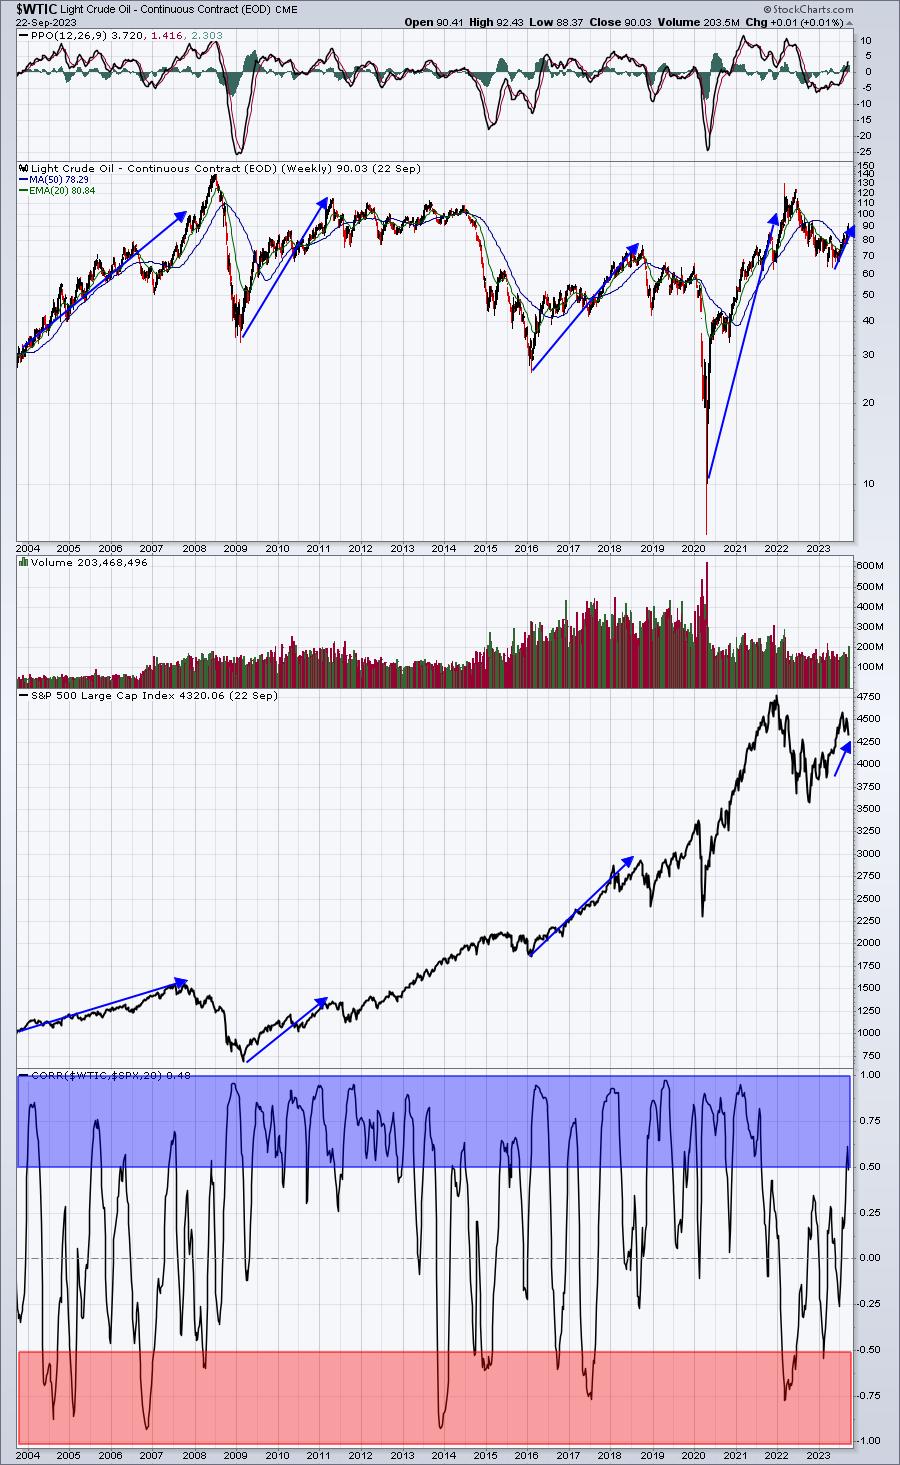
Check out that bottom panel. We see MUCH more positive correlation between crude oil and the S&P 500 than negative, or inverse, correlation. Think about it. Crude oil prices can be driven by geopolitical concerns or supply considerations, because of OPEC, but mostly it's driven by global demand. So when crude oil rises, it typically results from demand from improving economies around the globe. If economies are strong or strengthening, profits of S&P 500 companies should be rising, suggesting that higher PE ratios might be appropriate.
Unfortunately, most media outlets LOVE to discuss the negatives of higher crude oil prices, particularly potential inflationary concerns. History, however, tells us to WELCOME increasing oil prices with open arms. Check out the above chart. Nearly every time over the past 30 years that crude oil trends higher, the S&P 500 goes higher with it. In fact, the red-shaded area above highlights the VERY few times that we've seen inverse correlation beyond the -0.50 level. My conclusion? Don't worry about higher energy costs, they're more beneficial than detrimental.
Copper:
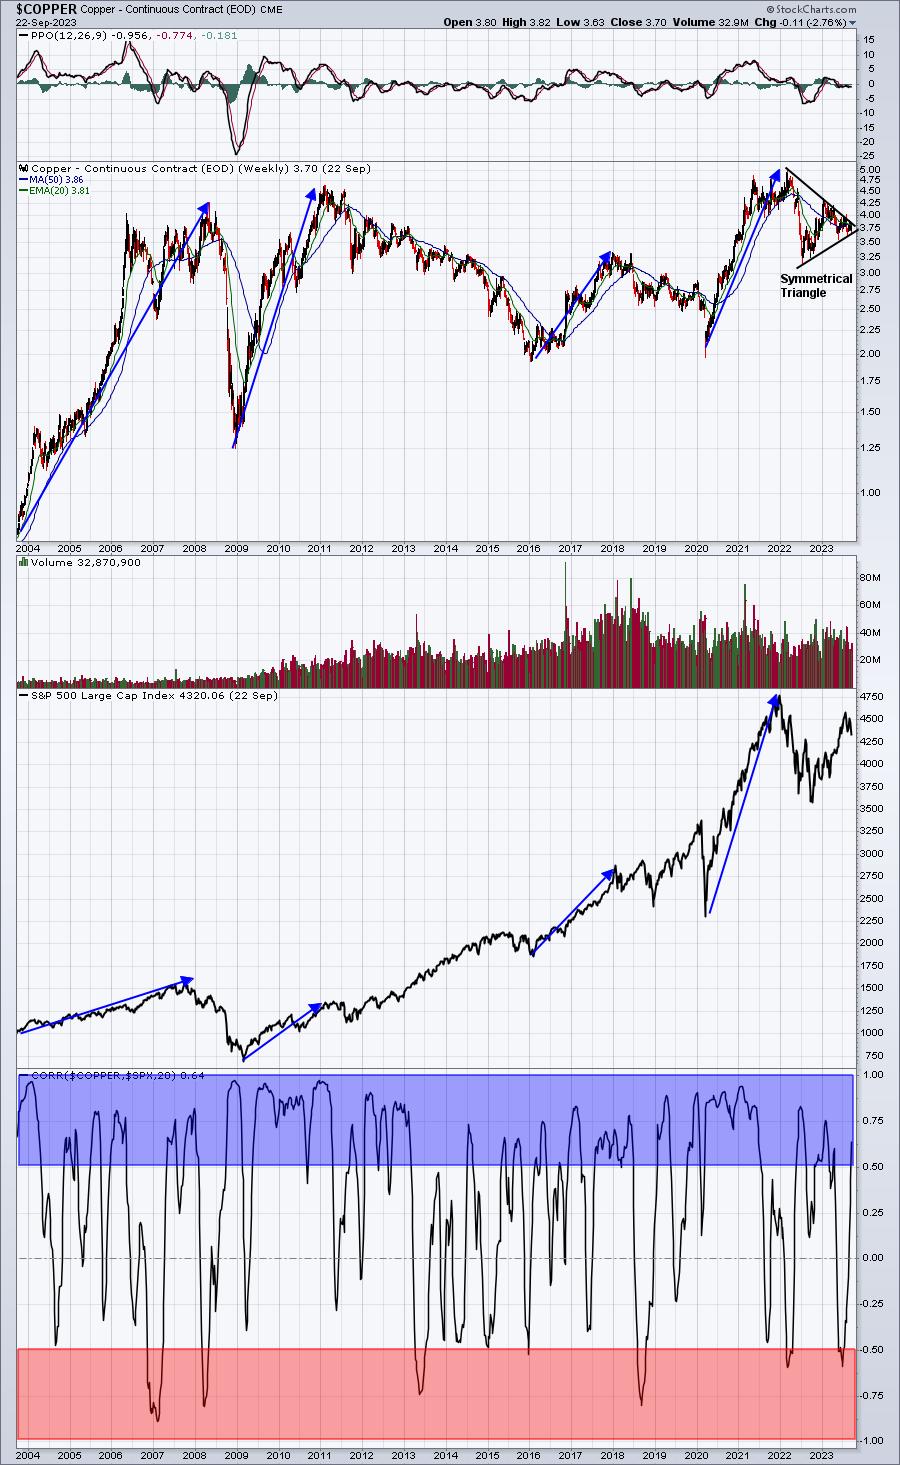
Once again, check out the positive correlation (blue-shaded area) vs. inverse correlation (red-shaded area). It's fairly clear to me that as goes copper, so goes the S&P 500. Currently, copper resides in a symmetrical triangle, which is a bullish continuation pattern after an uptrend. The higher probability is that copper moves higher from here. If it does, that would be one more positive signal for U.S. equities.
Intermarket Relationships
I want to provide you a quick update of my key intermarket relationships that I follow regularly.
QQQ vs. SPY
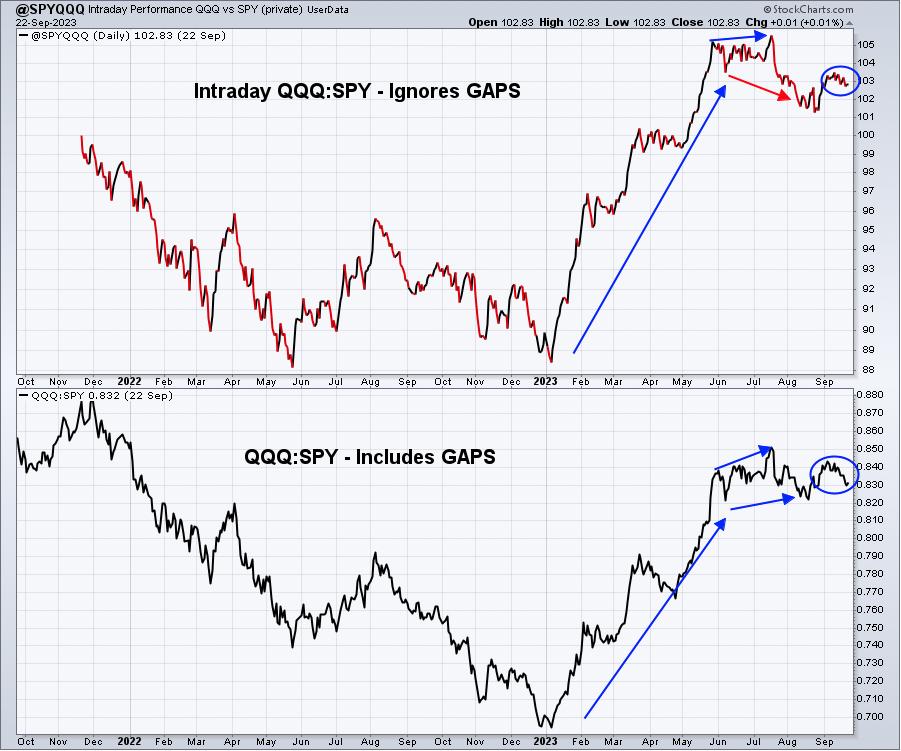
Note that the S&P 500 has broken down beneath the August low recently. But these two ratios both are well above their August low. This suggests that as the stock market moves lower and lower, money is rotating MORE towards the growth-oriented NASDAQ 100. And the top panel is the INTRADAY relationship between the two and it's holding up even better. Sorry, but I just don't see the big Wall Street firms pouring out of aggressive growth stocks, so I can't buy into the argument that we're heading for a recession, mild or otherwise.
XLY:XLP
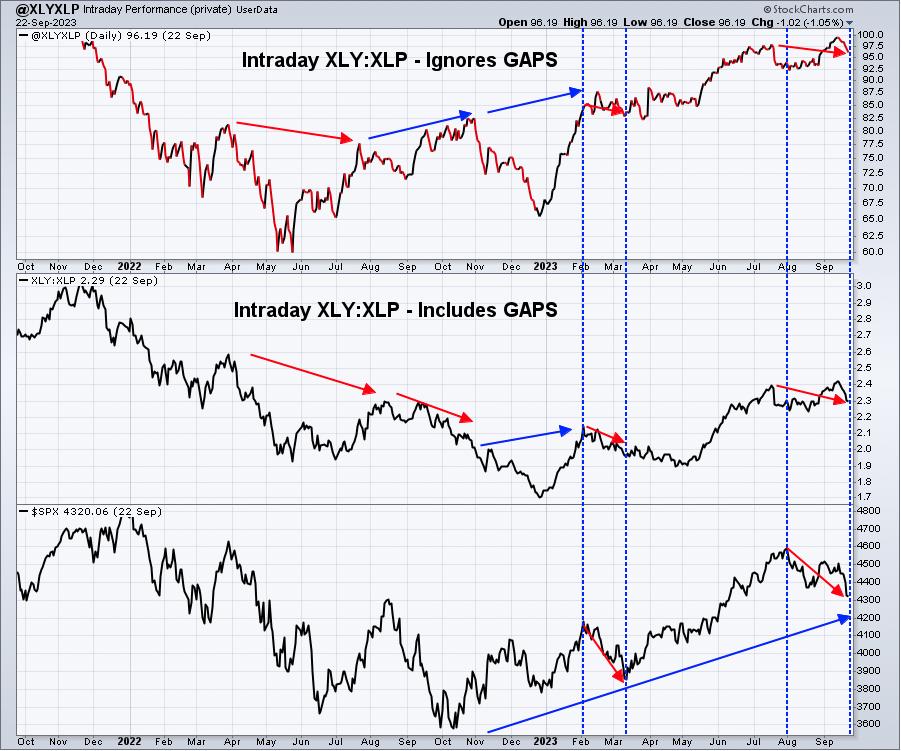
Check out the August-September pullback on the S&P 500. Again, the XLY:XLP ratio has not moved to new lows. Money, on a relative basis, remains in the much more aggressive discretionary area of consumer spending. I cannot grow bearish with this backdrop. It doesn't mean the stock market cannot go lower, it simply means that I don't believe it will. You have to commit and choose sides in the market. I remain a bull.
IWM:QQQ
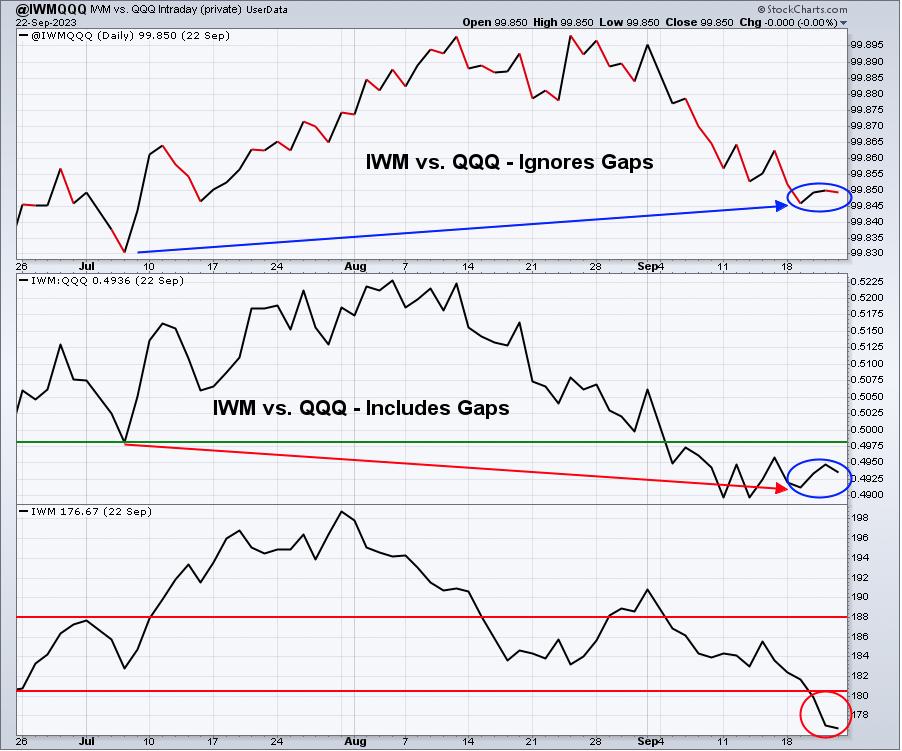
The IWM easily broke to new lows last week, but it outperformed the QQQ on a relative basis. I've only been following this relationship for a couple years, which isn't exactly a large sample size. But common sense tells me to watch the relationship, especially the INTRADAY relationship in the top panel.
Trade Setups
I want to continue focusing on stocks that could run higher into year end for various reasons. In the first two weeks, I pointed out JPM, BA, and FFIV as stocks that I believe will outperform the S&P 500 into year end, possibly longer. I still like all three, but BA is now testing a much more critical price support range in the 190s.
This week, I have one stock that I'd like to add.
Mastercard (MA):
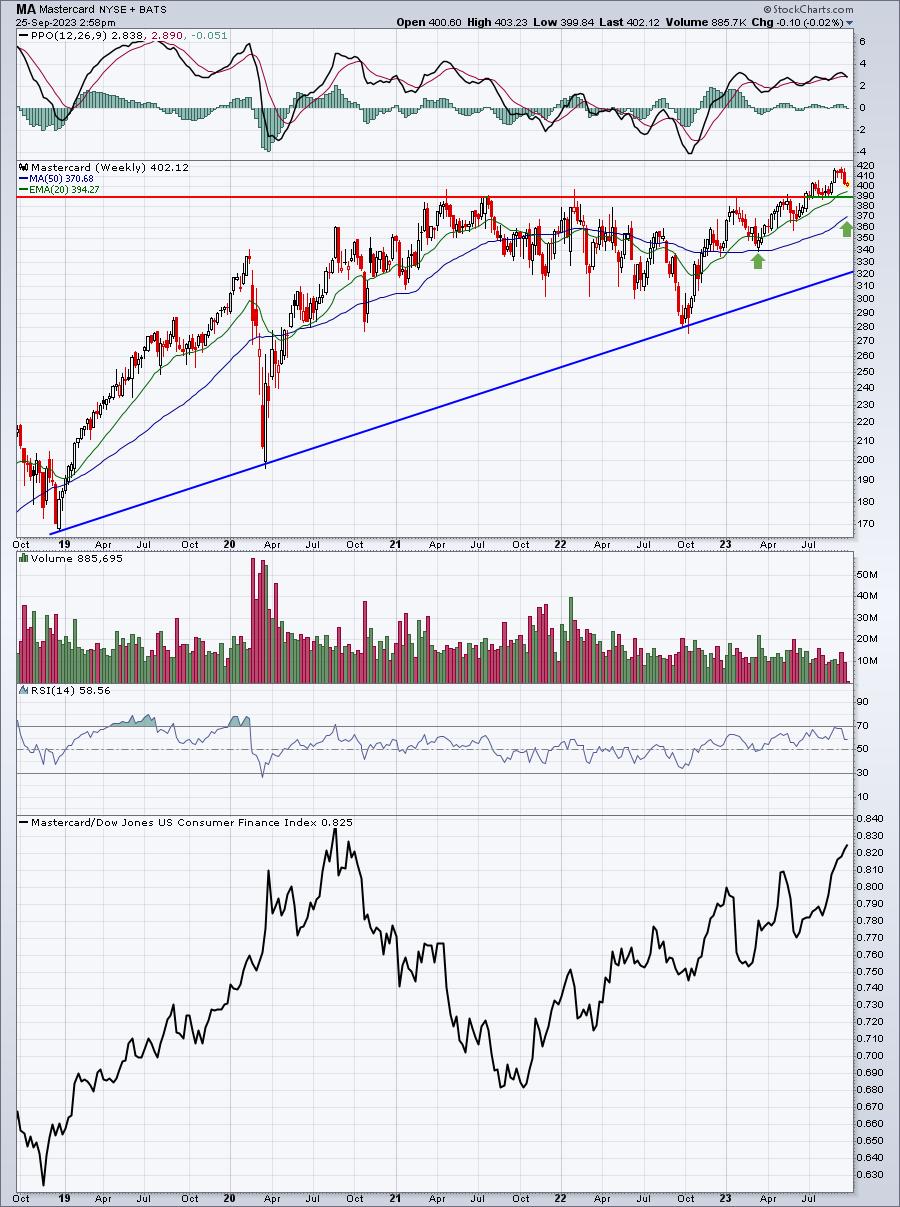
MA is in the consumer finance ($DJUSSF) space and has been one of its leaders, as you can see from the bottom panel. It's obviously got a great brand and the recent market weakness sets this stock up a bit cheaper. It's testing trendline support now, but I'd be fine holding it down to its 50-week SMA, which is currently at 370 and rising. I expect new highs in MA during Q4, especially if I'm right about another overall market advance.
I want to ALWAYS remind everyone that I am NOT a Registered Investment Advisor (RIA) and am not recommending that anyone buy or sell any securities that I mention. EarningsBeats.com, nor any of its employees, are RIAs. Please consult your financial advisor before buying or selling any securities. The above analysis should be construed as education only. You are responsible for any securities that you buy or sell.
Looking Ahead
Upcoming Earnings
We won't see much in the form of market-moving earnings reports this week. Here are a few interesting companies reporting this week, however, by day and market cap:
Monday: None
Tuesday: AZO ($46 billion)
Wednesday: FDX ($64 billion), GIS ($38 billion), KBH ($4 billion)
Thursday: DRI ($18 billion), FDS ($16 billion)
Friday: None
Key Economic Reports
The Fed meeting is out of the way, but there's still plenty for us to consider this week:
Monday: None
Tuesday: Case-Shiller home price index, consumer confidence, new home sales
Wednesday: Durable goods
Thursday: Initial jobless claims, GDP, pending home sales
Friday: Personal income, personal spending, Chicago PMI, consumer sentiment
Historical Data
Each week, I'll provide you the average annualized returns for each calendar day and by index. Here are the historical numbers for this week:
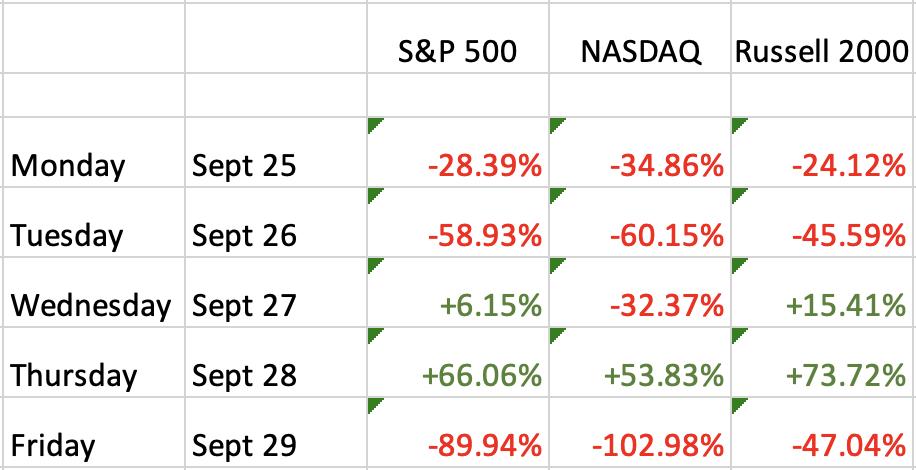
The S&P 500 data dates back to 1950, while the NASDAQ and Russell 2000 information date back to 1971 and 1987, respectively.
The historical storm that is the September 20th to September 30th period slowly begins to clear up as move into the later part of the week. I would expect to see more attention on Q3 earnings and the outlook for 2024 as we end this week and head into the more bullish calendar month of October.
Final Thoughts
Here is what I'm thinking right now:
- Last week, I said I'd be following rotation while others focused on a weak market. That's exactly what I did. I pointed out above that rotation isn't painting a bearish picture as we look ahead.
- Now, I'm looking for that signal, perhaps capitulation, where I can fill out my leveraged positions in anticipation of a market rally.
- Final Q2 GDP will be released on Thursday. That will be interesting as the consensus estimates are at 2.3% vs. the prior actual number of 2.1%. In other words, it appears our economy is stronger than previously forecast
- Interest rates are moving higher. We're up another 10 basis points today to 4.54%, possibly heading higher to test 5.00%. Higher rates is typically a bullish development as money is leaving the bond market and usually heading to the stock market.
- Watch the 4305 level on the S&P 500. Do we hold it? We are at 4328 right now, after touching 4302 this morning. We may have bottomed.
Feedback
I hope you enjoyed our fourth edition of our EB Weekly Market Report! We'd absolutely love your feedback, whether positive or negative. Let us know what you think by sending us your comments to "[email protected]". We are continuing to work to improve the layout and presentation and encourage you to share your thoughts with respect to this exciting new report!
Thanks and happy trading!
Tom