
EB Monthly Seasonality Report - April 2026
A Look Back At March Stocks:
Last month, we released our list of the Top 20 large cap stocks (plus 12 small cap stocks) that had strong historical track records during the month of March. Here are how they performed in March 2026 (through approximately 2pm ET on March 31, 2026), in order of best to worst performer:
Large Caps:
- CTRA: +13.70%
- EQT: +3.01%
- EQIX: +0.98%
- FAST: +0.37%
- WST: -1.36%
- LIN: -2.48%
- ZS: -4.75%
- NUE: -4.99%
- AIG: -6.83%
- STLD: -7.96%
- TKO: -8.44%
- TPL: -10.34%
- WSM: -11.79%
- CARR: -13.04%
- KDP: -13.77%
- EXR: -13.78%
- LULU: -18.35%
- CAG: -18.96%
- ULTA: -23.87%
- DG: -24.81%
Small Caps:
- CC: +19.85%
- VIRT: +6.01%
- CWEN: +2.22%
- DXPE: +0.93%
- ARWR: -1.04%
- KRYS: -6.23%
- FIZZ: -8.17%
- CTRE: -9.45%
- CALM: -9.77%
- PATK: -10.36%
- DY: -19.49%
- SCVL: -23.63%
The percentages represent the returns from the February 27th close to the March 31st close. The average performance of all 20 large cap stocks (-8.37%) trailed both the S&P 500 (-5.78%) and the NASDAQ 100 (QQQ, -5.58%). The average performance of the 12 small cap stocks (-4.93%) squeaked past the small cap Russell 2000 (IWM, -5.83%), posting its 3rd consecutive month of outperformance.
S&P 500 April Performance
The annualized performance of the S&P 500 (since 1950) during the month of April is strong at +16.82%, trailing only November (+22.05%) and December (+17.00%), among all calendar months. The S&P 500 has closed higher in April 53 times out of the last 76 years. The only calendar month that closes higher more often is December (55 times).
Here's a breakdown of the historically strong and weak performance periods throughout April on the S&P 500 since 1950. The %'s shown are the ANNUALIZED returns for the period:
- April 1-18: +27.76%
- April 19-24: -4.49%
- April 25-30: +10.95%
Sector Performance
Last month, I pointed out that there was one very clear relative sector leader since 2013 - utilities (XLU). This defensive group had outperformed the S&P 500 in 12 of the last 13 years in March through 2025. I looked for the group to show relative strength once again in March 2026 and it did. The XLU actually traded lower in March, but it performed way better than the S&P 500, which endured much heavier losses for the month.
Looking ahead to April, energy (XLE) has performed best during this calendar month over the past 13 years and since this current secular bull market was confirmed. The XLE is already the best-performing sector, by far, in 2026, so bullish relative momentum is definitely on its side as we enter the month:
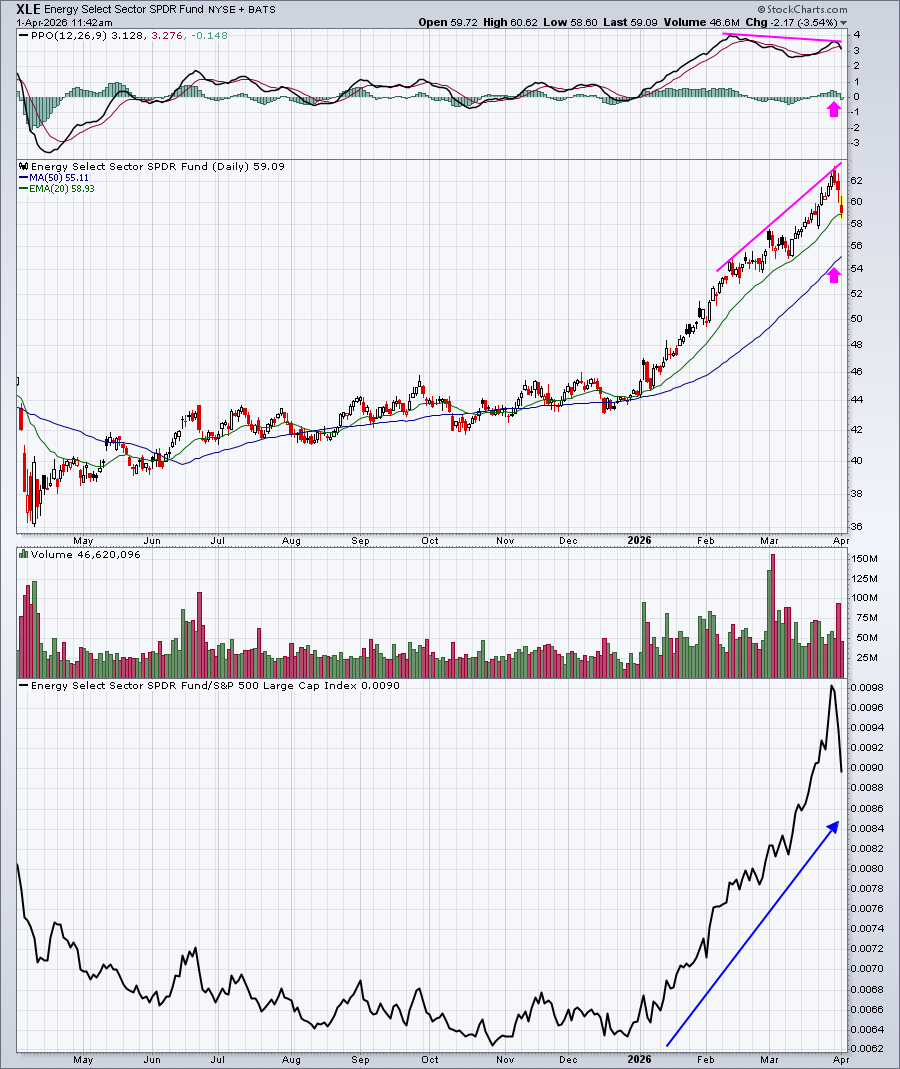
Unfortunately, as you can see from the above, absolute momentum shows a negative divergence. That doesn't guarantee selling ahead, but it does add another level of short-term risk. I'd be looking for a 20-day EMA test. If that moving average does not hold, then a 50-day SMA test could be in store. After a potential short-term pullback, however, I'd look for leadership from energy once again.
Industry Performance
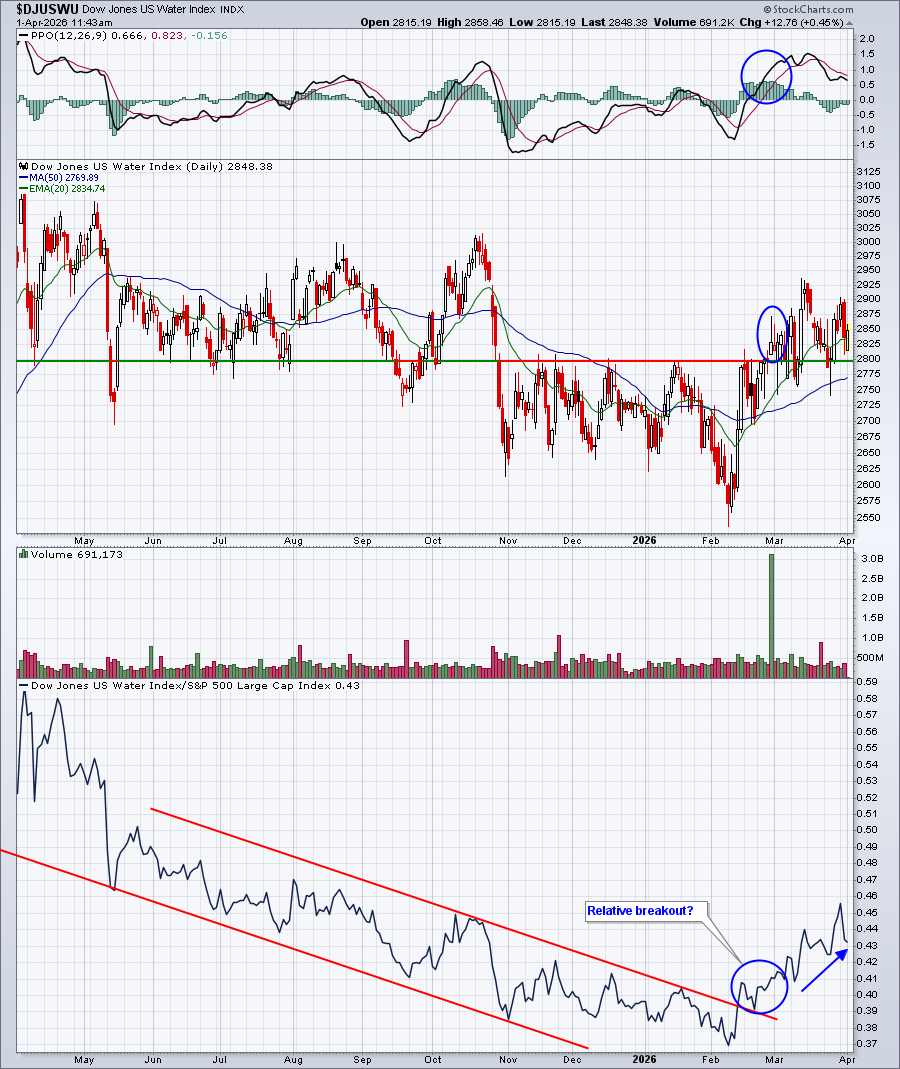
Last month, I pointed out that the water index ($DJUSWU) was just beginning to show some relative strength as we entered March and that it typically outperforms the S&P 500 in March. It wasn't a huge month for water, but the relative strength continued to surge:
Exploration & production stocks ($DJUSOS) are typically very strong in April and the group is on fire right now, as we enter April 2026:
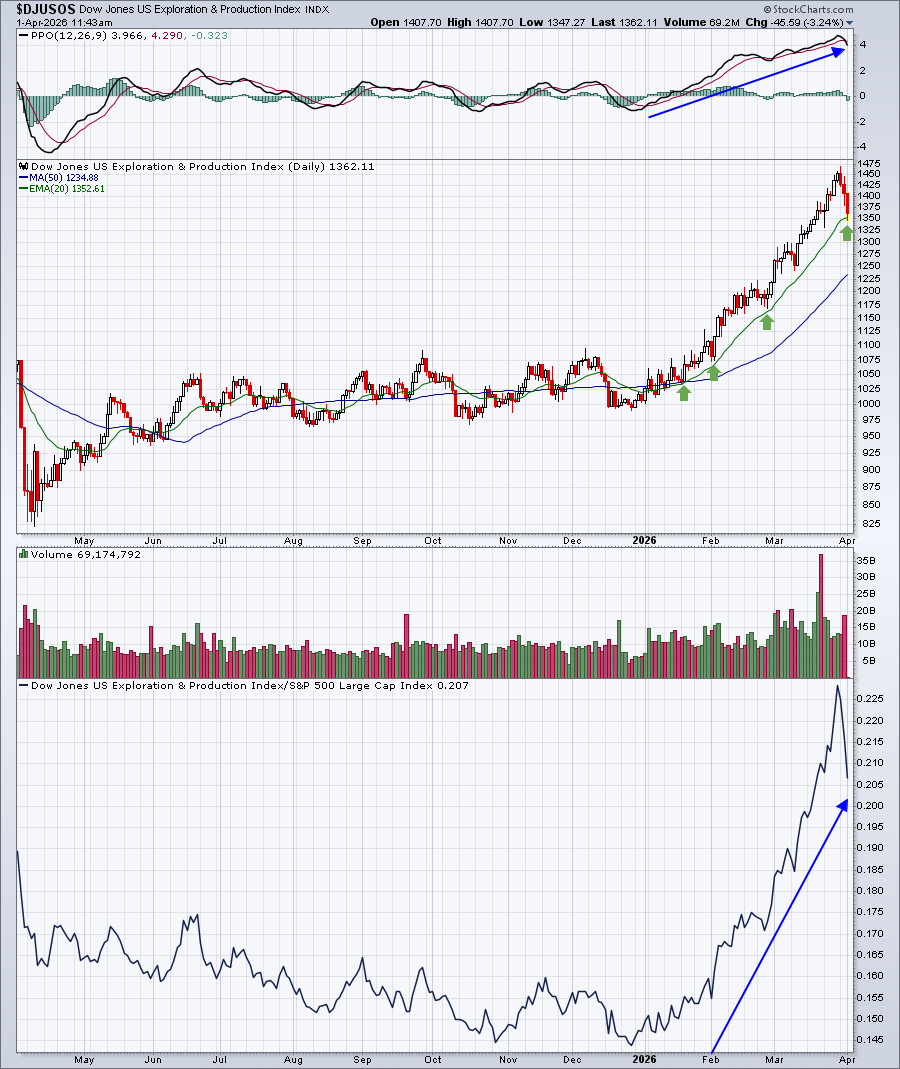
We've seen some profit taking the past few days, but I'd be looking for buyers to show up again if the DJUSOS tests its rising 20-day EMA.
Here are all industry groups that tend to perform much better than the benchmark S&P 500 during April, broken down by sector:
Technology (XLK):
- renewable energy, software
Consumer Discretionary (XLY):
- tires, broadline retailers, restaurants & bars
Communication Services (XLC):
- internet
Industrials (XLI):
- marine transportation
Financials (XLF):
- consumer finance, full line insurance, specialty finance
Health care (XLV):
- none
Consumer staples (XLP):
- distillers & vintners
Real estate (XLRE):
- none
Utilities (XLU):
- none
Energy (XLE):
- exploration & production, integrated oil & gas, coal
Materials (XLB):
- gold mining, mining, nonferrous metals, paper
Stocks for April
A "Seasonality - April 2026" ChartList (annotated with 1 or 2 support levels to watch) will be created by tomorrow and will be added to our website.
You must be a StockCharts.com Extra or Pro member to download our ChartLists. Basic members and non-StockCharts.com members can view the charts one at a time.
Happy trading!
Tom