
EB Monthly Seasonality Report - March 2026
A Look Back At February Stocks:
Last month, we released our list of the Top 20 large cap stocks (plus 10 small cap stocks) that had strong historical track records during the month of February. Here are how they performed in February 2026, in order of best to worst performer:
Large Caps:
- TPL: +50.50%
- TRGP: +17.33%
- AMAT: +15.65%
- FCX: +13.03%
- URI: +7.65%
- CF: +7.34%
- HII: +6.04%
- XYZ: +5.41%
- HLT: +4.49%
- CPAY: +3.33%
- MPWR: +1.65%
- MOS: +1.24%
- NXPI: +0.38%
- FTNT: -2.74%
- AON: -3.85%
- ANET: -5.81%
- NVDA: -7.29%
- BKNG: -15.24%
- CVNA: -16.69%
- TTD: -21.46%
Small Caps:
- ESI: +20.58%
- MTRN: +18.03%
- SNEX: +13.58%
- REZI: +12.96%
- ZWS: +10.80%
- TDC: +10.41%
- ANDE: +5.32%
- RGR: +2.04%
- KRYS: -1.29%
- LZB: -1.90%
The percentages represent the returns from the January 31st close to the February 28th close. The average performance of all 20 large cap stocks (+3.05%) easily beat the S&P 500 (-0.86%) and the NASDAQ 100 (QQQ, -2.34%). The average performance of the 10 small cap stocks (+9.05%) crushed the small cap Russell 2000 (IWM, +0.68%).
S&P 500 March Performance
The annualized performance of the S&P 500 (since 1950) during the month of March is solid, but not spectacular, from a long-term perspective as the S&P 500 has closed higher in March 49 times out of the last 76 years, producing an annualized return of +12.30% over that time frame. This annualized return places March in the 6th spot among the 12 calendar months in terms of March performance.
Since 1950, March has produced an annualized return of +12.30% on the S&P 500, which ranks 6th among all 12 calendar months. Here's a breakdown of the historically strong and weak performance periods throughout March on the S&P 500 since 1950. The %'s shown are the ANNUALIZED returns for the period:
- March 1-5: +37.80%
- March 6-9: -24.42%
- March 10-18: +30.83%
- March 19-22: -18.13%
- March 23-31: +11.63%
Sector Performance
Last month, I indicated that industrials (XLI) have regularly enjoyed relative strength vs. the S&P 500 during the month of February. The XLI promptly soared relative to the S&P 500, backed by those seasonal tailwinds. Here was the chart I showed on the XLI last month, updated to include the strong February 2026:
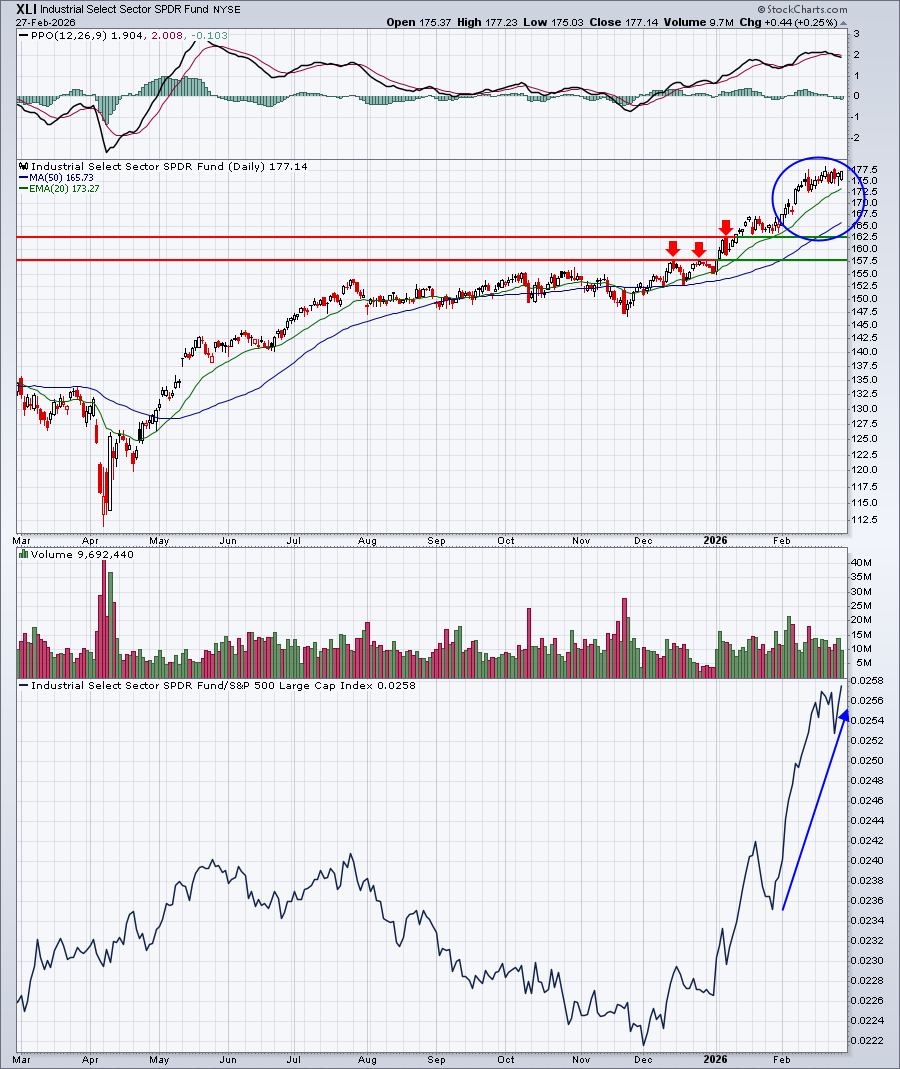
Support held and the XLI built off of its January gain.
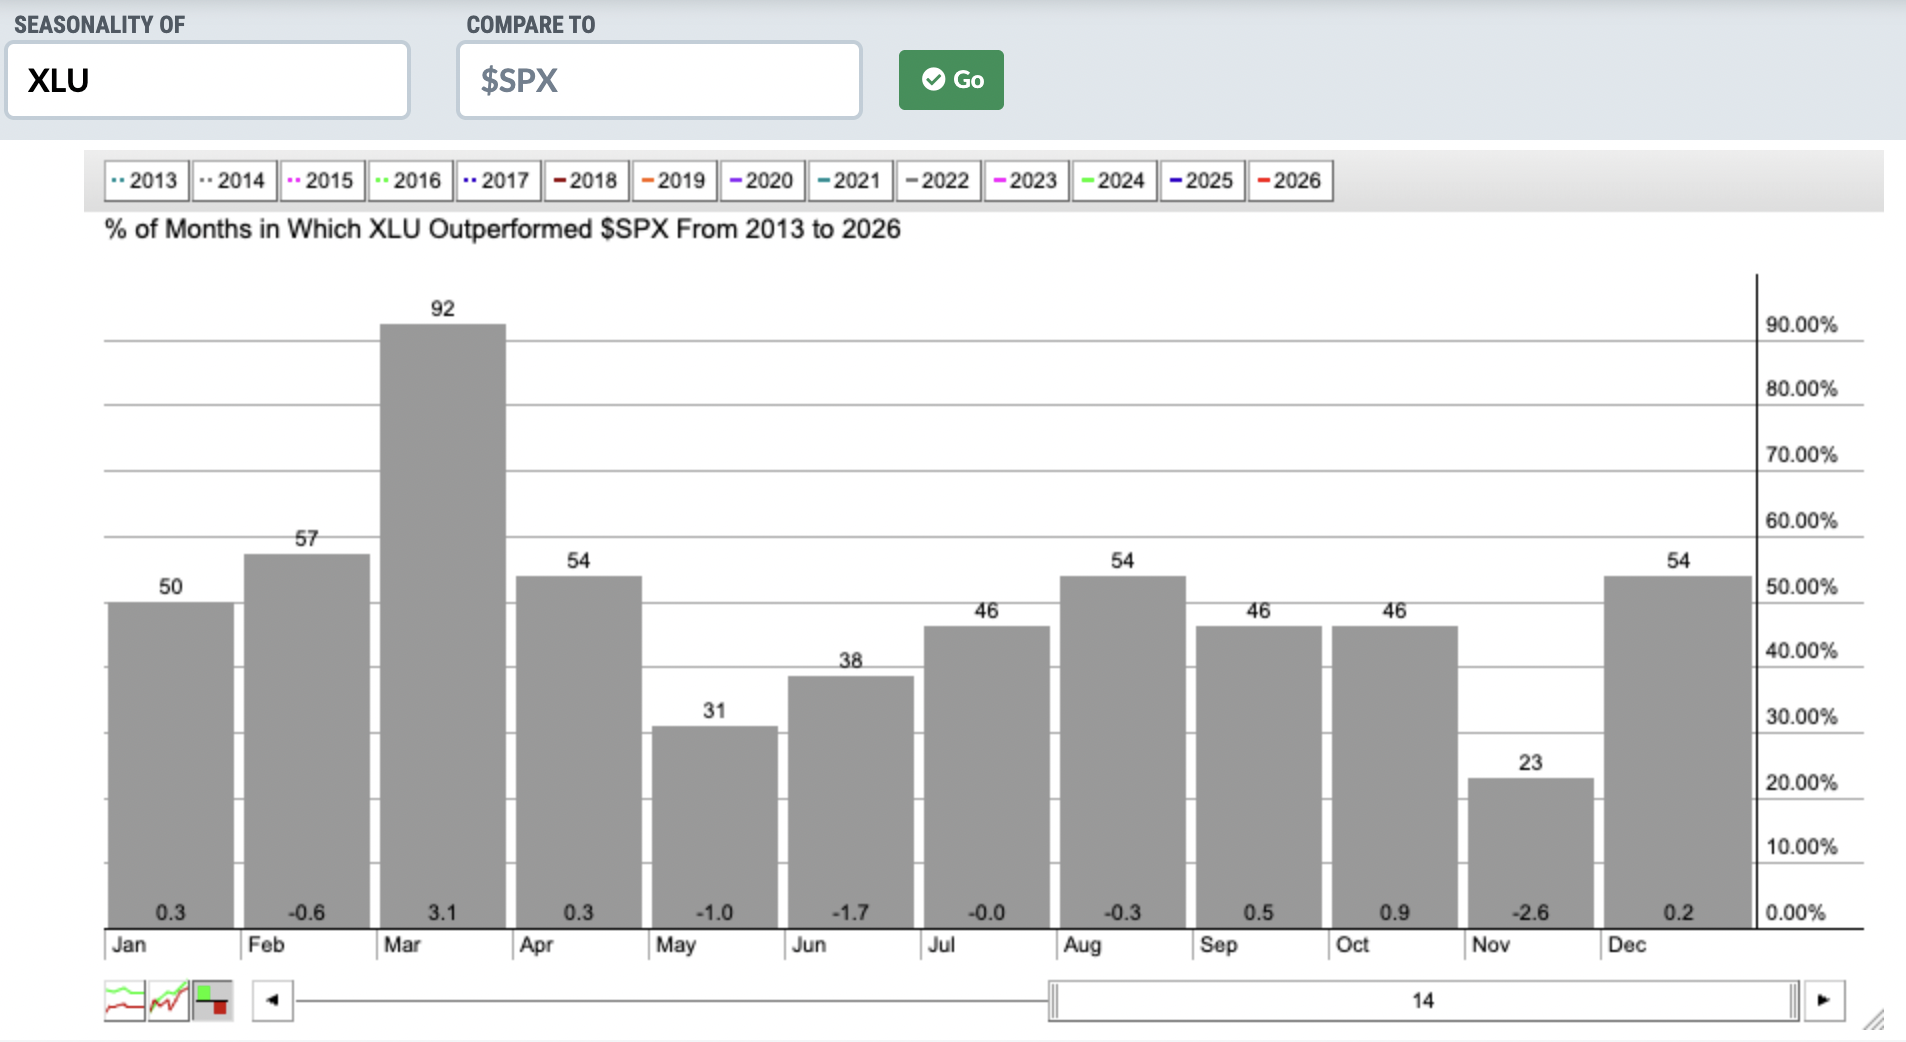
Looking ahead to March, there's one very clear relative leader since 2013 - utilities (XLU). This defensive group has outperformed the S&P 500 in 12 of the last 13 years in March. I'd look for the group to show relative strength once again. First, check out the seasonal strength that the XLU typically enjoys in March:
.....and now take a look at the technical breakout in February:
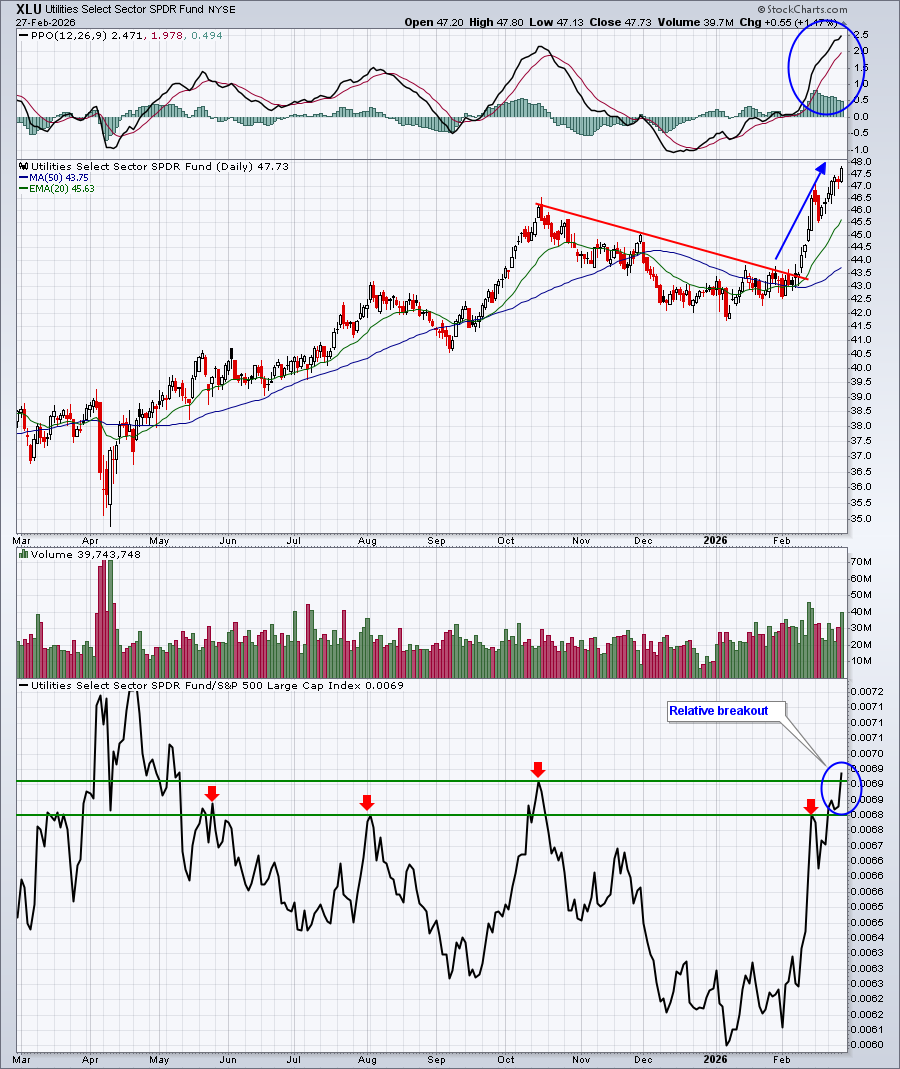
Obviously, there are never any guarantees with respect to the stock market, but the XLU certainly appears poised to for solid action in the month ahead.
Industry Performance
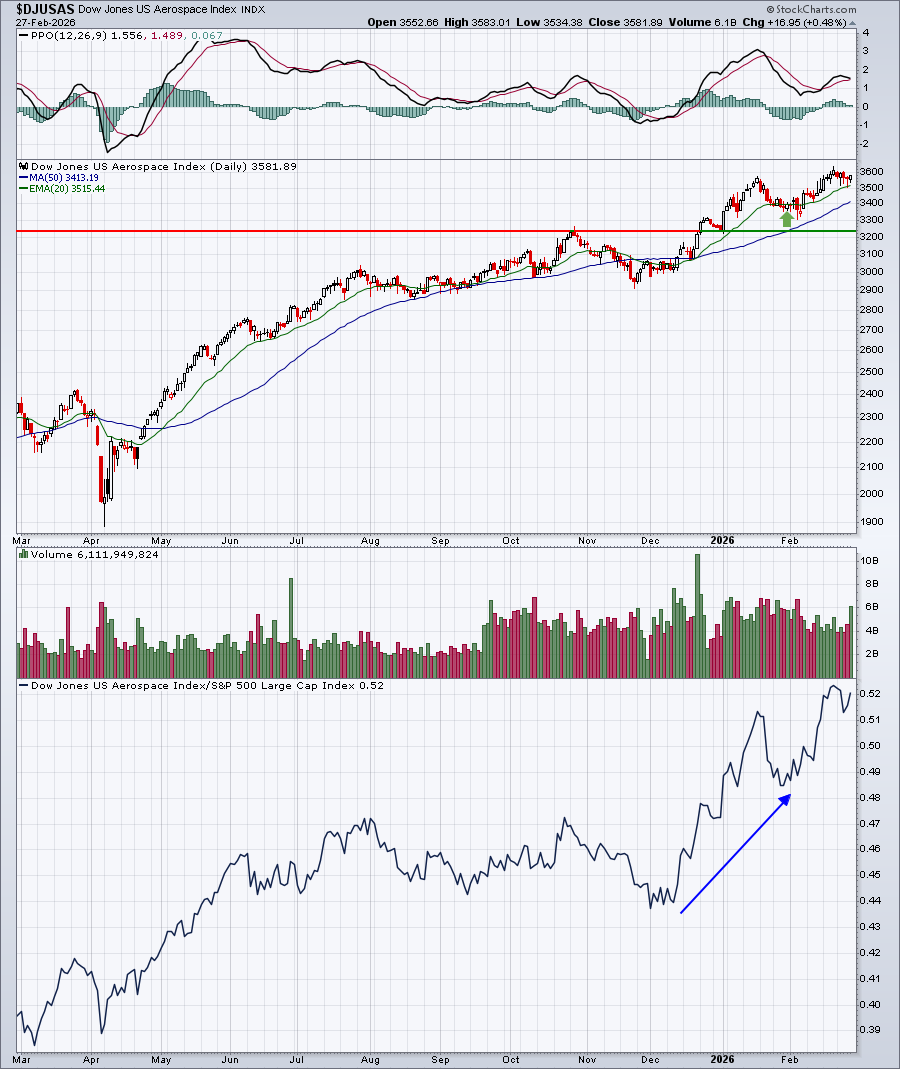
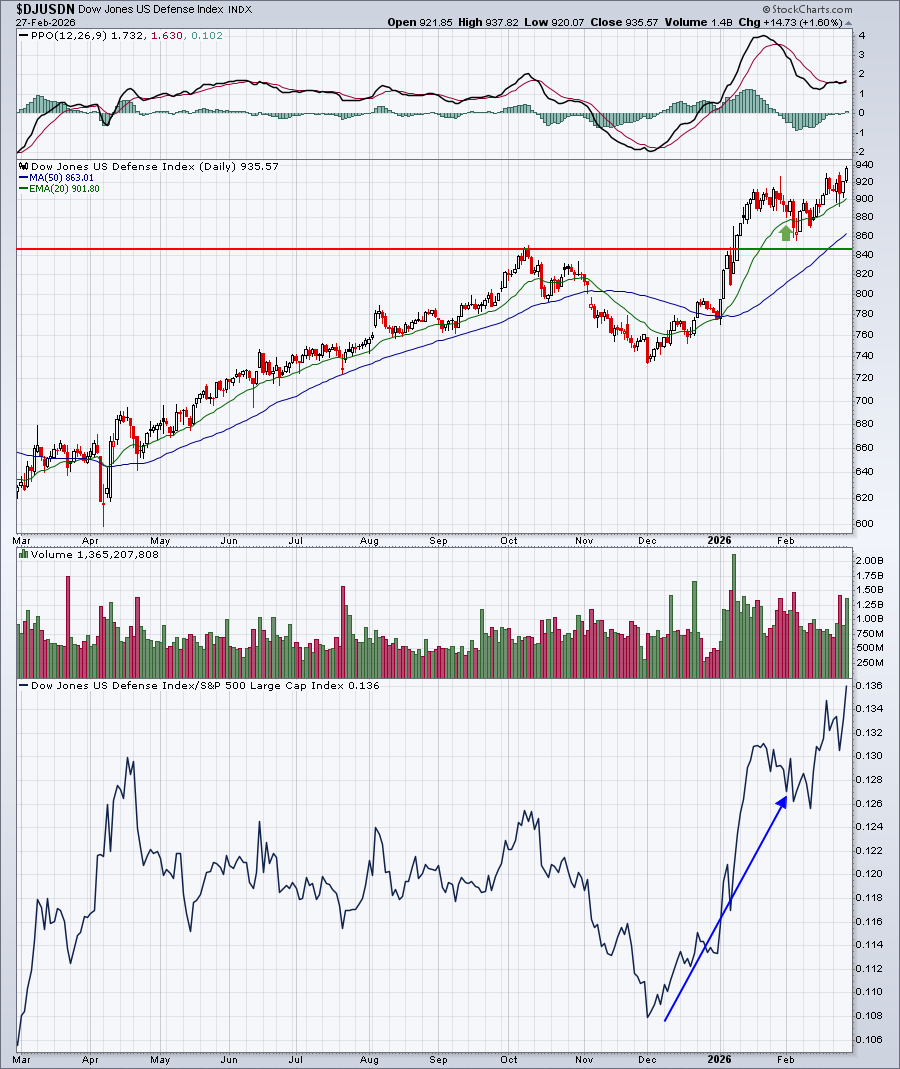
Last month, I highlighted aerospace ($DJUSAS) and defense ($DJUSDN) as two industry groups that could benefit from the seasonal tailwinds that seem to lift industrials every February. Both continued their ascent and performed well:
Aerospace:
Defense:
For March, all industries within utilities tend to perform well. Conventional electricity ($DJUSVE) and water ($DJUSWU) are slight seasonal outperformers within the group. The DJUSVE is now testing key overhead resistance from a high set back in October. The DJUSWU, on the other hand, has been much weaker, but did just clear some recent overhead price resistance:
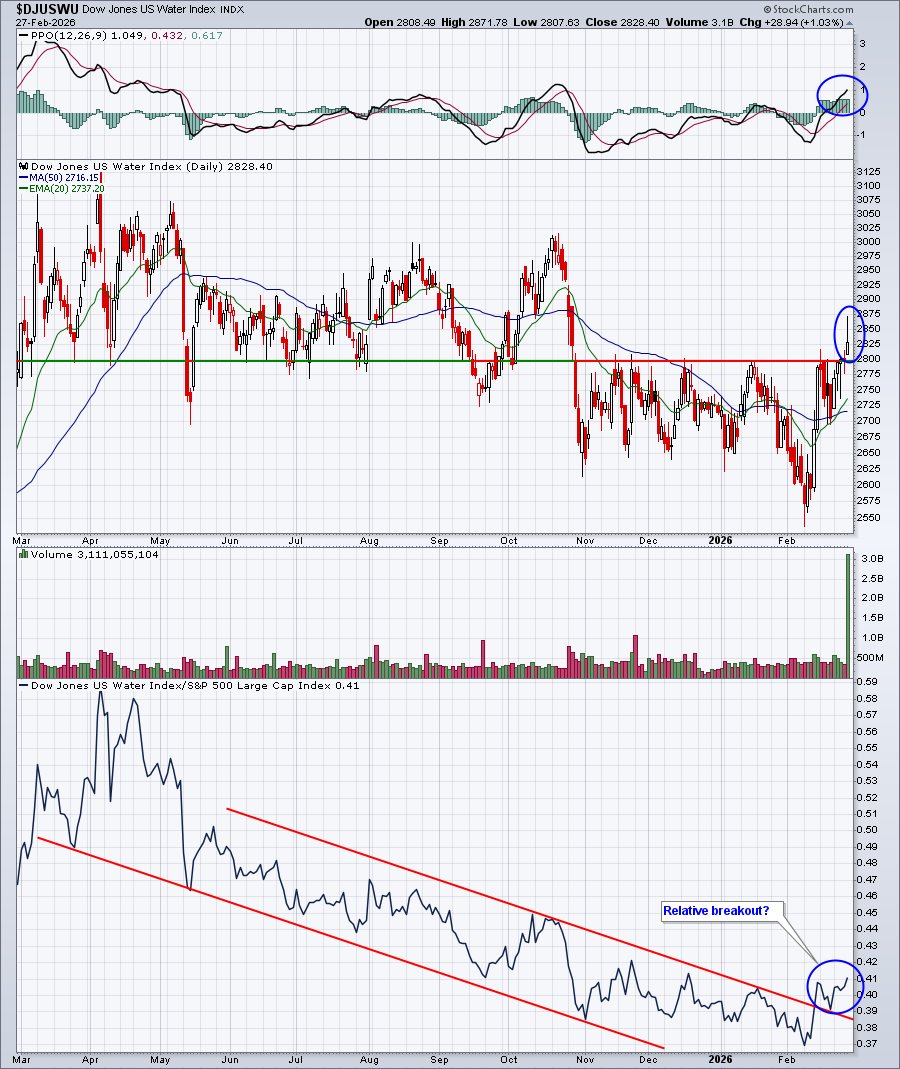
It looks to me like the relative downtrend on the DJUSWU may just be starting to turn back up. That could be great timing for water to once again show its March relative dominance.
Here are all industry groups that tend to perform much better than the benchmark S&P 500 during March, broken down by sector:
Technology (XLK):
- semiconductors, telecom equipment, computer hardware
Consumer Discretionary (XLY):
- broadline retailers, toys
Communication Services (XLC):
- mobile telecommunications
Industrials (XLI):
- waste & disposal services, delivery services
Financials (XLF):
- specialty finance, reinsurance
Health care (XLV):
- health care providers
Consumer staples (XLP):
- food products, distillers & vintners, food retailers & wholesalers, brewers, nondurable household products, drug retailers
Real estate (XLRE):
- specialty REITs
Utilities (XLU):
- conventional electricity, water, multiutilities, gas distribution
Energy (XLE):
- none
Materials (XLB):
- gold mining, mining, nonferrous metals, steel
Stocks for March
A "Seasonality - March 2026" ChartList (annotated with 1 or 2 support levels to watch) will be created and should be added to our website this weekend.
You must be a StockCharts.com Extra or Pro member to download our ChartLists. Basic members and non-StockCharts.com members can view the charts one at a time.
Happy trading!
Tom