
EB Daily Market Report - Wednesday, September 23, 2026
Executive Summary
- Futures were down overnight and our major indices gapped lower
- The 10-year treasury yield ($TNX) is soaring, up 15 basis points today to 5.12%, the highest level since 2007
- While yields are surging, there's been no major hedging against inflation by moving into gold ($GOLD, -1.16%) or real estate (XLRE, -1.14%)
- After a big recent drop, crude oil ($WTIC, +1.51%) is up today and back near $92 per barrel
- Utilities (XLU, -1.76%) typically suffer from rising treasury yields and the past few weeks have been no different
- Meanwhile, energy (XLE, +1.01%) is benefiting from the rebound in crude oil and is 1 of 2 sectors higher on the session
- Industrials (XLI, +0.20%) also have gained ground
- Cryptocurrencies are weak today, with bitcoin ($BTCUSD, -2.55%) nearing 84000
- It's now been a week since the Fed rate hike and over the past, semiconductors ($DJUSSC) have been the best industry group, outperforming the S&P 500 by nearly 7%
- Software stocks ($DJUSSC, +1.00%) are bucking the trend, with CrowdStrike Holding (CRWD, +4.47%) leading the S&P 500
Market Outlook
Well, I talked yesterday about the recent improvement in our major indices. But I also discussed needing to see a breakout. Otherwise, we have sideways consolidation on our hands and nothing more. Right on cue, futures weakened overnight and sellers regained control of the action today. Until we make a definitive breakout, it's this type of back and forth, whipsaw action that we'll need to be prepared for. Here's the same chart I showed yesterday, but this time I've shortened the time period from 6 months down to 3:
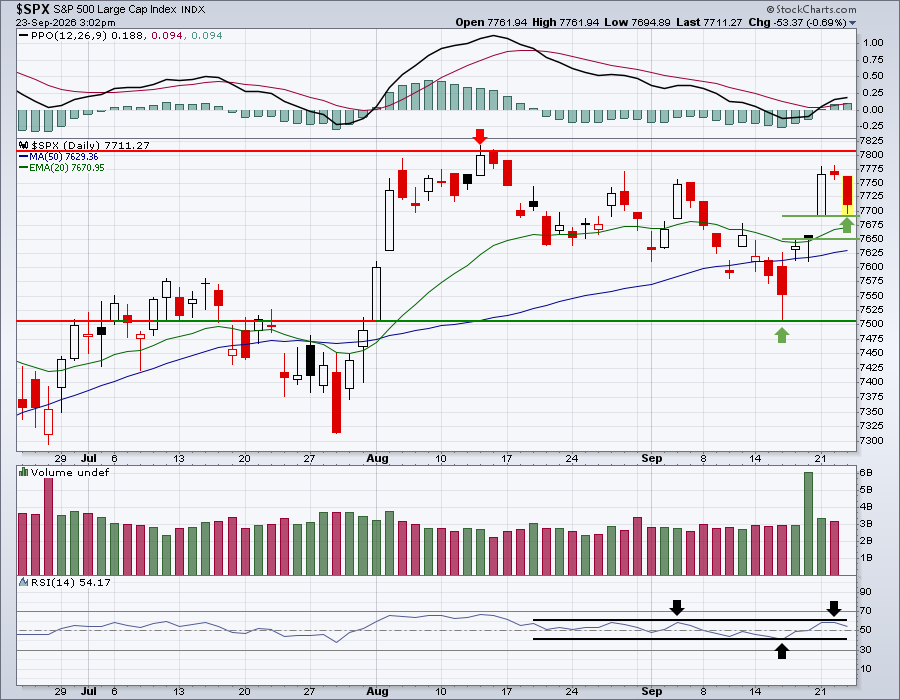
The only annotation I added were the two gap support lines, both at the top and bottom of the gap. Today's intraday low tested the top of gap support. Note that the rising 20-day EMA now falls between both of these gap support lines. So I'd view the S&P 500's very near-term support range to be the gap support zone, from 7650.50 to 7692.83. That 20-day EMA falls in this range at 7671.
If you're looking for further short-term downside, you'll need to see this support range give way. It may or may not happen. I will say, however, that the 10-year treasury yield ($TNX) is up 15 basis points (!!!) today to 5.12%. If there are reasons to see a significant short-term selloff in U.S. equities, the shock of rapidly rising rates above 5.00% would be one of them, in my opinion. So let's see how the S&P 500 finishes the day.
Sectors/Industries
Specialty retailers ($DJUSRS) have been weak, but the weekly chart suggests that more strength could be just ahead. As the group approaches a key support level, you can see that the weekly PPO has turned considerably higher. This means that another price low would very likely result in a positive divergence on the weekly chart, a sign of slowing selling momentum:
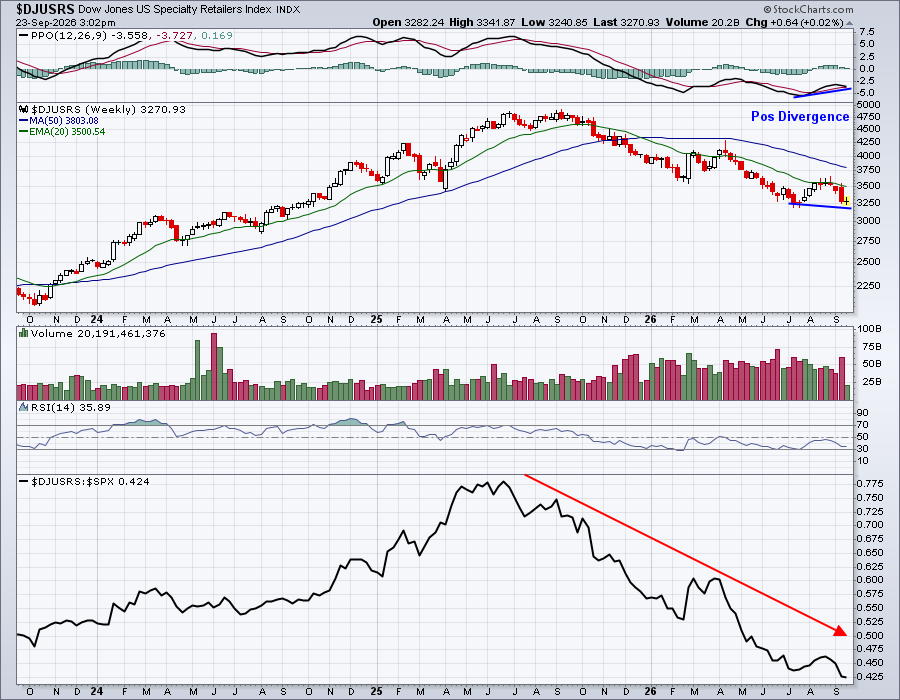
That bottom panel shows a very poor group, one that displays awful relative strength. But that's not uncommon when a bottom forms with a positive divergence.
ChartLists and Trading Strategies
I looked at our Seasonality ChartList (SEASCL) for September to see if any of the stocks there are worth entering or keeping an eye on. One that stood out is Ulta, Inc. (ULTA), a leading specialty retailer. It's actually showing improving relative strength, but just can't seem to clear overhead price resistance and its peer group, as explained earlier, hasn't yet turned the corner. ULTA is trending higher over the past 3 months, however, and currently shows a bullish ascending triangle continuation pattern, so if it can clear 570, there's a chance we could see further upside acceleration:
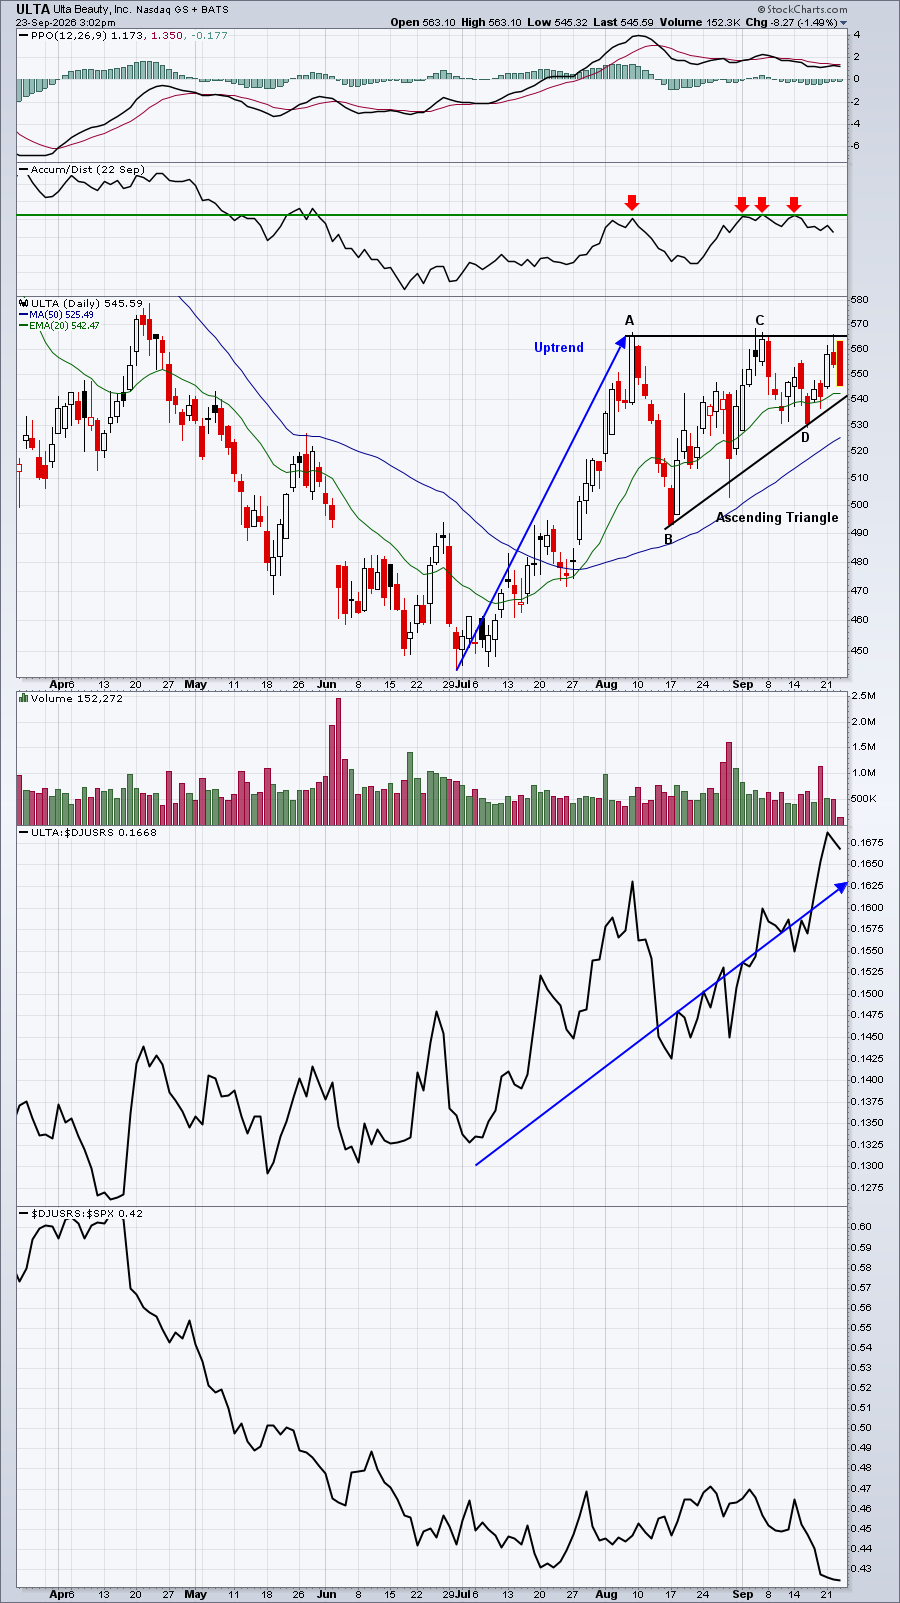
Specialty retailers ($DJUSRS) have been struggling, but ULTA has been strengthening on a relative basis. If it can clear 570 and the AD line confirms with a breakout, I'd grow much more bullish near-term. An improving industry gorup would only add to the potential bullishness. Keep an eye on this one.
Upcoming Earnings
Upcoming Earnings and Upcoming Earnings Relative Strength ChartLists are produced for EB.com members to track upcoming earnings reports and provide them to you via ChartLists throughout earnings season. We will begin producing Upcoming Earnings ChartLists again on a weekly basis when Q3 earnings season begins in mid-October.
Economic Reports
September PMI manufacturing: 57.0 (actual) vs. 53.5 (estimate)
September PMI services: 58.7 (actual) vs. 55.7 (estimate)
Happy trading!
Tom